![Weis Volume Dynamics Indicator for MetaTrader 4 Download - [TradingFinder]](https://cdn.tradingfinder.com/image/341443/2-27-en-weis-volume-dynamics-mt4-1.webp)
![Weis Volume Dynamics Indicator for MetaTrader 4 Download - [TradingFinder] 0](https://cdn.tradingfinder.com/image/341443/2-27-en-weis-volume-dynamics-mt4-1.webp)
![Weis Volume Dynamics Indicator for MetaTrader 4 Download - [TradingFinder] 1](https://cdn.tradingfinder.com/image/341444/2-27-en-weis-volume-dynamics-mt4-2.webp)
![Weis Volume Dynamics Indicator for MetaTrader 4 Download - [TradingFinder] 2](https://cdn.tradingfinder.com/image/341442/2-27-en-weis-volume-dynamics-mt4-3.webp)
![Weis Volume Dynamics Indicator for MetaTrader 4 Download - [TradingFinder] 3](https://cdn.tradingfinder.com/image/341445/2-27-en-weis-volume-dynamics-mt4-4.webp)
The Weis Volume Dynamics Indicator is a Technical analysis tool for analyzing trading volume and price changes, designed for use on the MetaTrader 4 (MT4) platform.
This indicator was developed based on Richard Wyckoff's analytical method for identifying the strengths and weaknesses of bullish and bearish trends using volume data.
Weis Volume Dynamics Specifications Table
Table below reviews the Weis Volume Dynamics indicator.
Indicator Categories: | Oscillators MT4 Indicators Pivot Points & Fractals MT4 Indicators Currency Strength MT4 Indicators |
Platforms: | MetaTrader 4 Indicators |
Trading Skills: | Intermediate |
Indicator Types: | Reversal MT4 Indicators |
Timeframe: | Multi-Timeframe MT4 Indicators |
Trading Style: | Intraday MT4 Indicators |
Trading Instruments: | Forward Market MT4 Indicators Stock Market MT4 Indicators Cryptocurrency MT4 Indicators Forex MT4 Indicators |
Uptrend Conditions
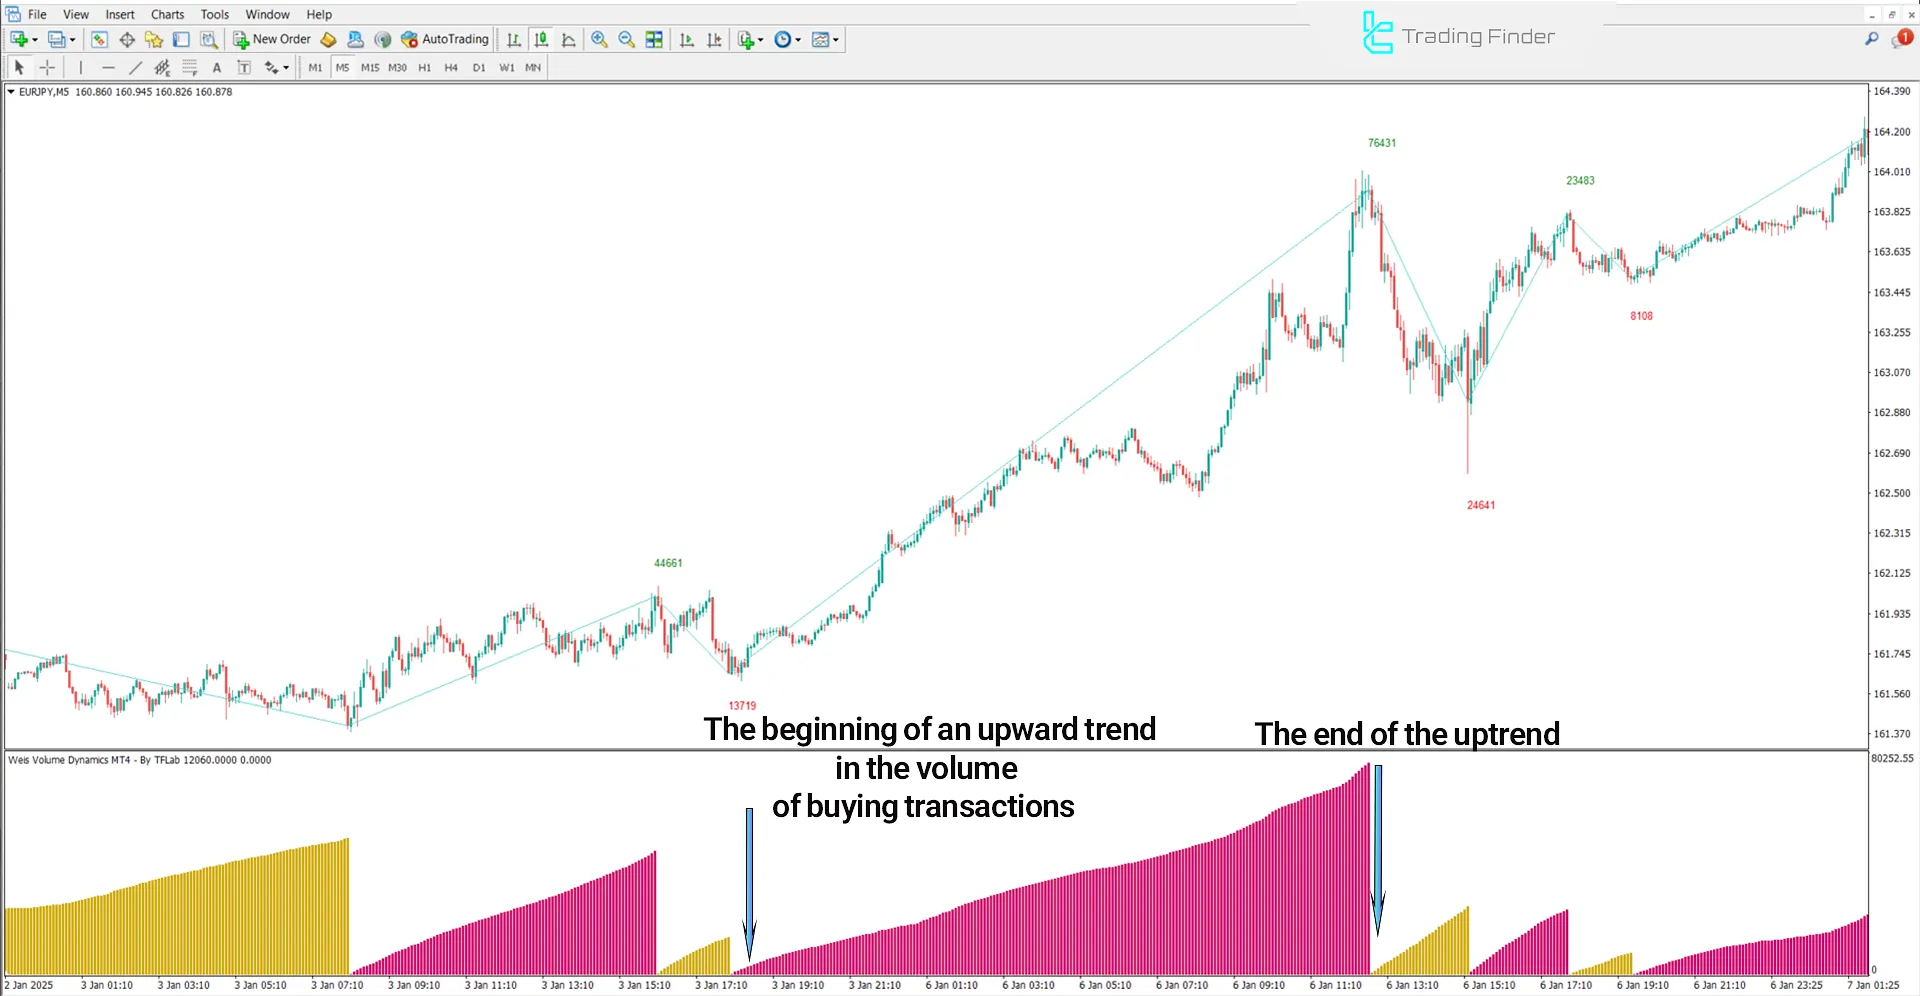
In the EUR/CHF currency pair's price chart on the 5-minute timeframe, as the price moves up and buying volume increases, the oscillator's color in MT4 changes to pink, and the histogram bars show an upward trend. Under these conditions, a Buy signal is generated.
Later, when the price reaches the end of the trend and the trading volume at the last pivot point is calculated, along with a color change in the oscillator, an Exit signal is provided.

Downtrend Conditions
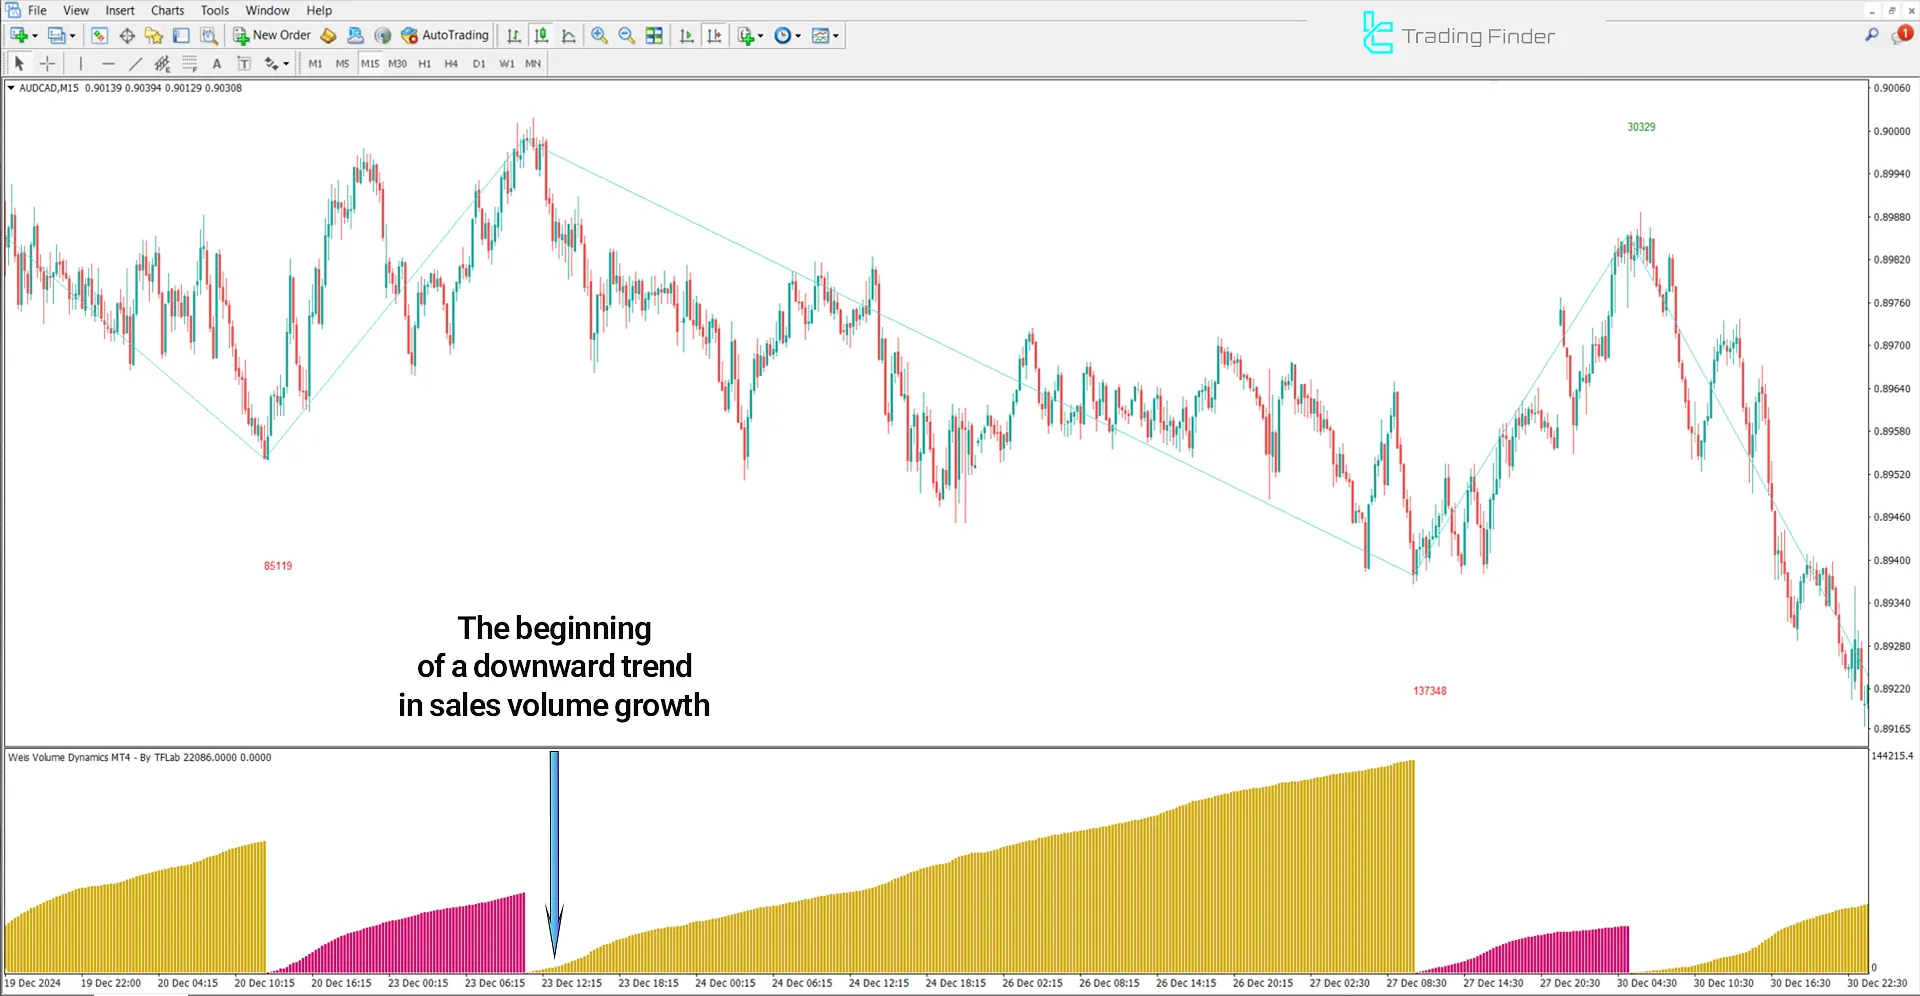
The price decreases in the price chart of the AUD/CAD currency pair in the 15-minute timeframe, and consequently, the oscillator changes from pink to yellow. Simultaneously, the increasing height of the histogram bars indicates the strength of the bearish trend, confirming a Sell signal.

Indicator Settings
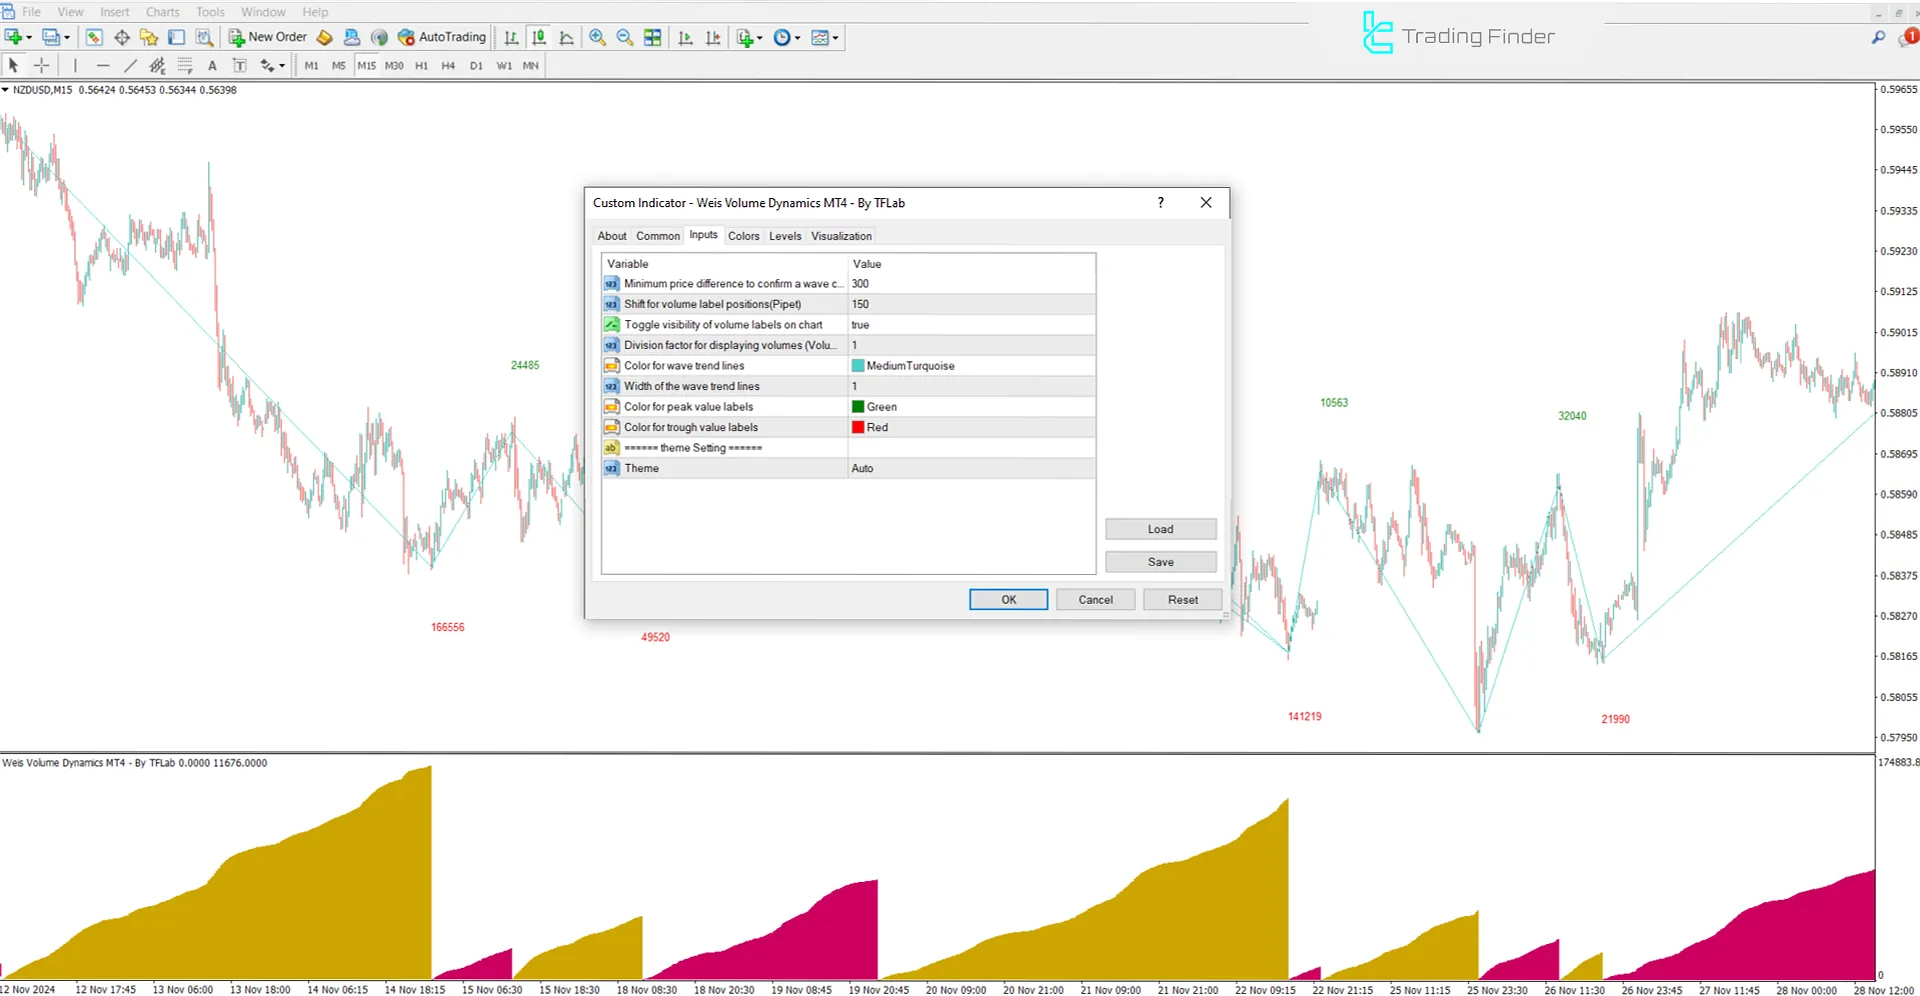
Image below displays the adjustable parameters of the Weis Volume Dynamics Indicator:

- Minimum price difference to confirm a wave change: The smallest price movement needed to identify a new wave
- Shift for volume label positions (Pipet): Adjusts where volume labels appear on the chart
- Toggle visibility of volume labels on chart: Option to show or hide volume labels on the chart
- Division factor for displaying volumes (Volume Scaling): Sets a scale to display volume values more clearly
- Color for wave trend lines: Defines the color of trend lines for price waves
- Width of the wave trend lines: Adjusts the thickness of wave trend lines
- Color for peak value labels: Sets the color for labels showing peak price points
- Color for trough value labels: Sets the color for labels showing trough (low) price points
Conclusion
The Weis Volume Dynamics Indicator provides essential information through volume analysis, trend line drawing, pivot point identification, and histogram bar color changes.
These key insights include trend direction and strength, enabling traders to find suitable entry and exit points.
Weis Volume Dynamics MT4 PDF
Weis Volume Dynamics MT4 PDF
Click to download Weis Volume Dynamics MT4 PDFWhat is the appropriate timeframe for using the Weis Volume Dynamics Indicator?
This is a multi-timeframe indicator and applies to all timeframes.
Does the Weis Volume Dynamics Oscillator provide entry and exit signals?
No, this oscillator provides entry and exit zones using histogram bars and color changes.


