![Williams AD MA Indicator in MT4 Download - Free - [TradingFinder]](https://cdn.tradingfinder.com/image/146837/13-46-en-williams-ad-ma-mt4-1.webp)
![Williams AD MA Indicator in MT4 Download - Free - [TradingFinder] 0](https://cdn.tradingfinder.com/image/146837/13-46-en-williams-ad-ma-mt4-1.webp)
![Williams AD MA Indicator in MT4 Download - Free - [TradingFinder] 1](https://cdn.tradingfinder.com/image/146839/13-46-en-williams-ad-ma-mt4-2.webp)
![Williams AD MA Indicator in MT4 Download - Free - [TradingFinder] 2](https://cdn.tradingfinder.com/image/146840/13-46-en-williams-ad-ma-mt4-3.webp)
![Williams AD MA Indicator in MT4 Download - Free - [TradingFinder] 3](https://cdn.tradingfinder.com/image/146838/13-46-en-williams-ad-ma-mt4-4.webp)
The Williams AD MA Indicator combines volume analysis and price trends used by professional traders to evaluate market changes. This tool integrates two key concepts Accumulation/Distribution (A/D) and Moving Average (MA).
Using this trading tool, traders can effectively assess trend strength and identify optimal entry (Entry) and exit (Exit) points.
Indicator Table
Indicator Categories: | Oscillators MT4 Indicators Volatility MT4 Indicators Currency Strength MT4 Indicators |
Platforms: | MetaTrader 4 Indicators |
Trading Skills: | Intermediate |
Indicator Types: | Range MT4 Indicators Reversal MT4 Indicators |
Timeframe: | Multi-Timeframe MT4 Indicators |
Trading Style: | Intraday MT4 Indicators |
Trading Instruments: | Share Stocks MT4 Indicators Indices Market MT4 Indicators Commodity Market MT4 Indicators Stock Market MT4 Indicators Cryptocurrency MT4 Indicators Forex MT4 Indicators |
Overview of the Indicator
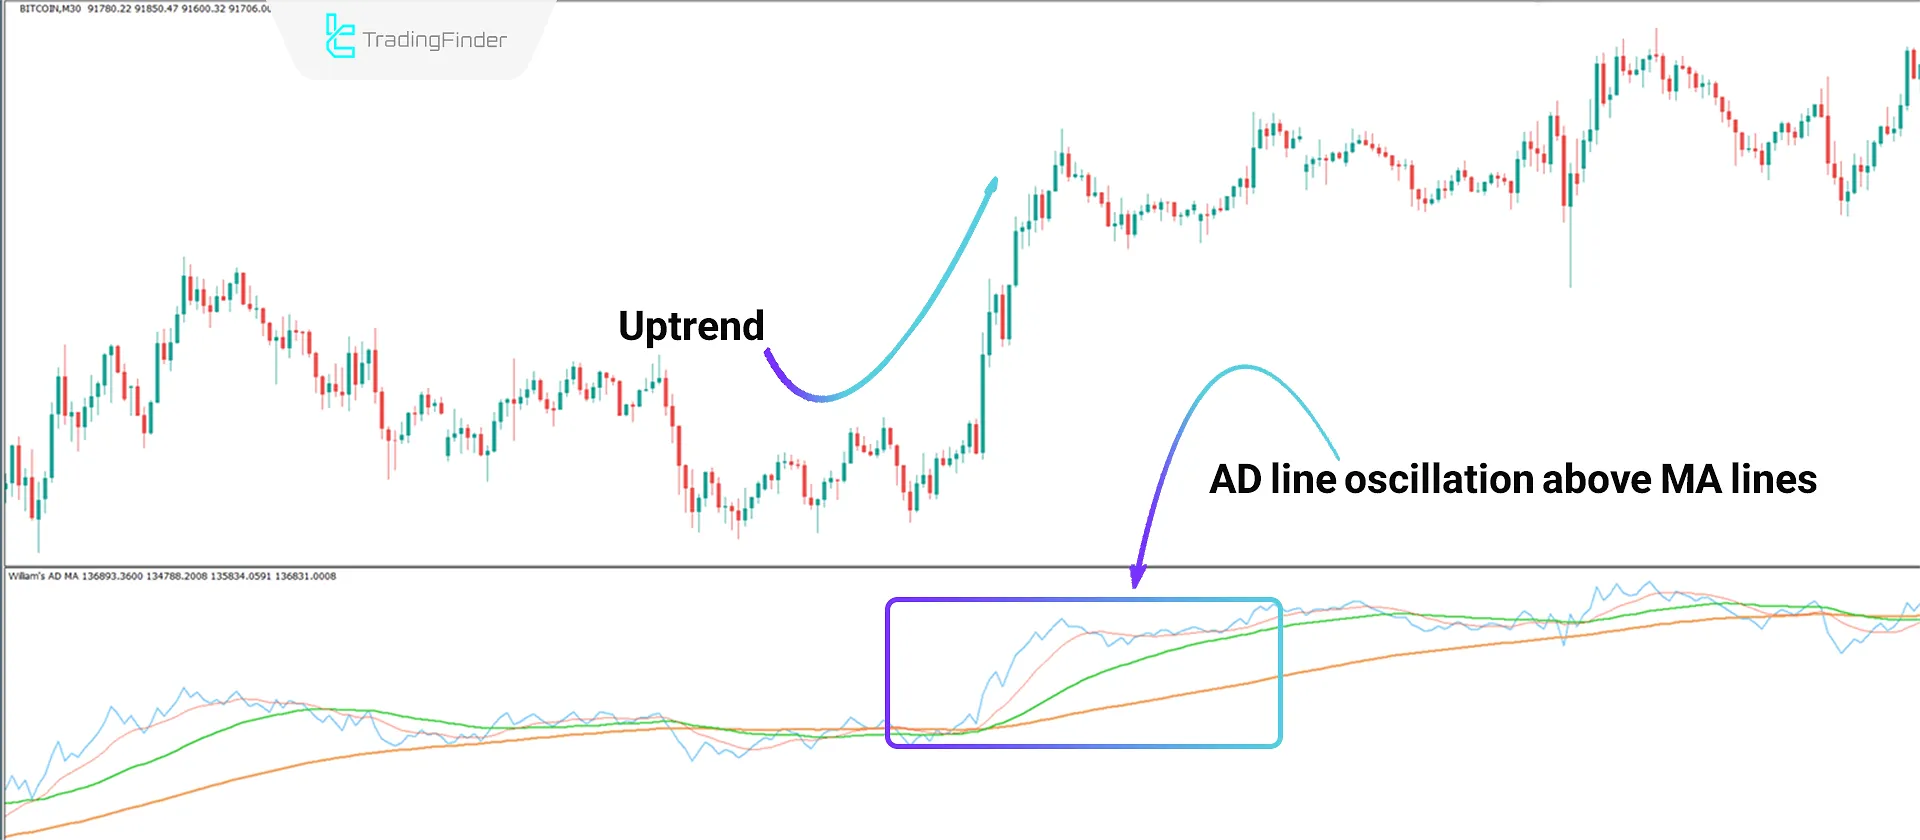
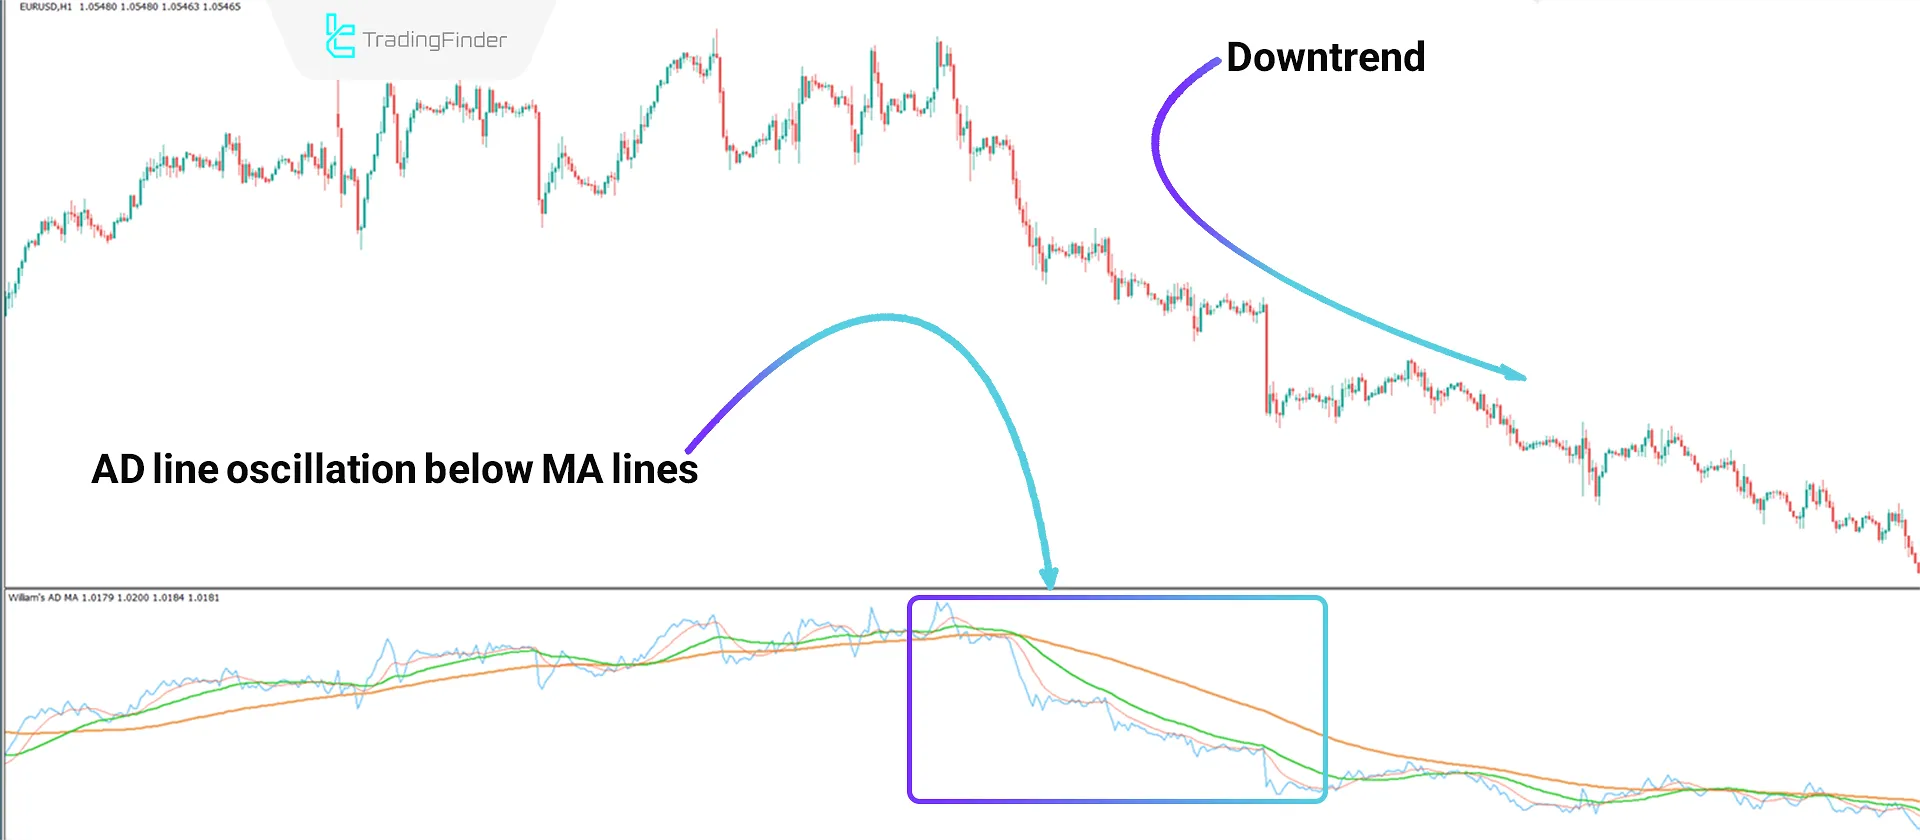
This indicator includes a light blue "AD" line and three MA lines, displayed as oscillators in a separate window below the price chart. The oscillation and crossover of the "AD" line relative to the MA lines determine whether the trend is bullish or bearish.
Bullish Trend Conditions
Based on the 30-minute price chart of Bitcoin (BTC), the light blue "AD" line oscillating above the MA lines indicates a bullish trend.
In this situation, the crossover of the main line with the moving averages is considered a buy signal.

Bearish Trend Conditions
According to the 1-hour price chart of the EUR/USD currency pair, the light blue "AD" line oscillating below the MA lines indicates a bearish trend.
In this situation, the crossover of the main line with the moving averages is considered a sell signal.

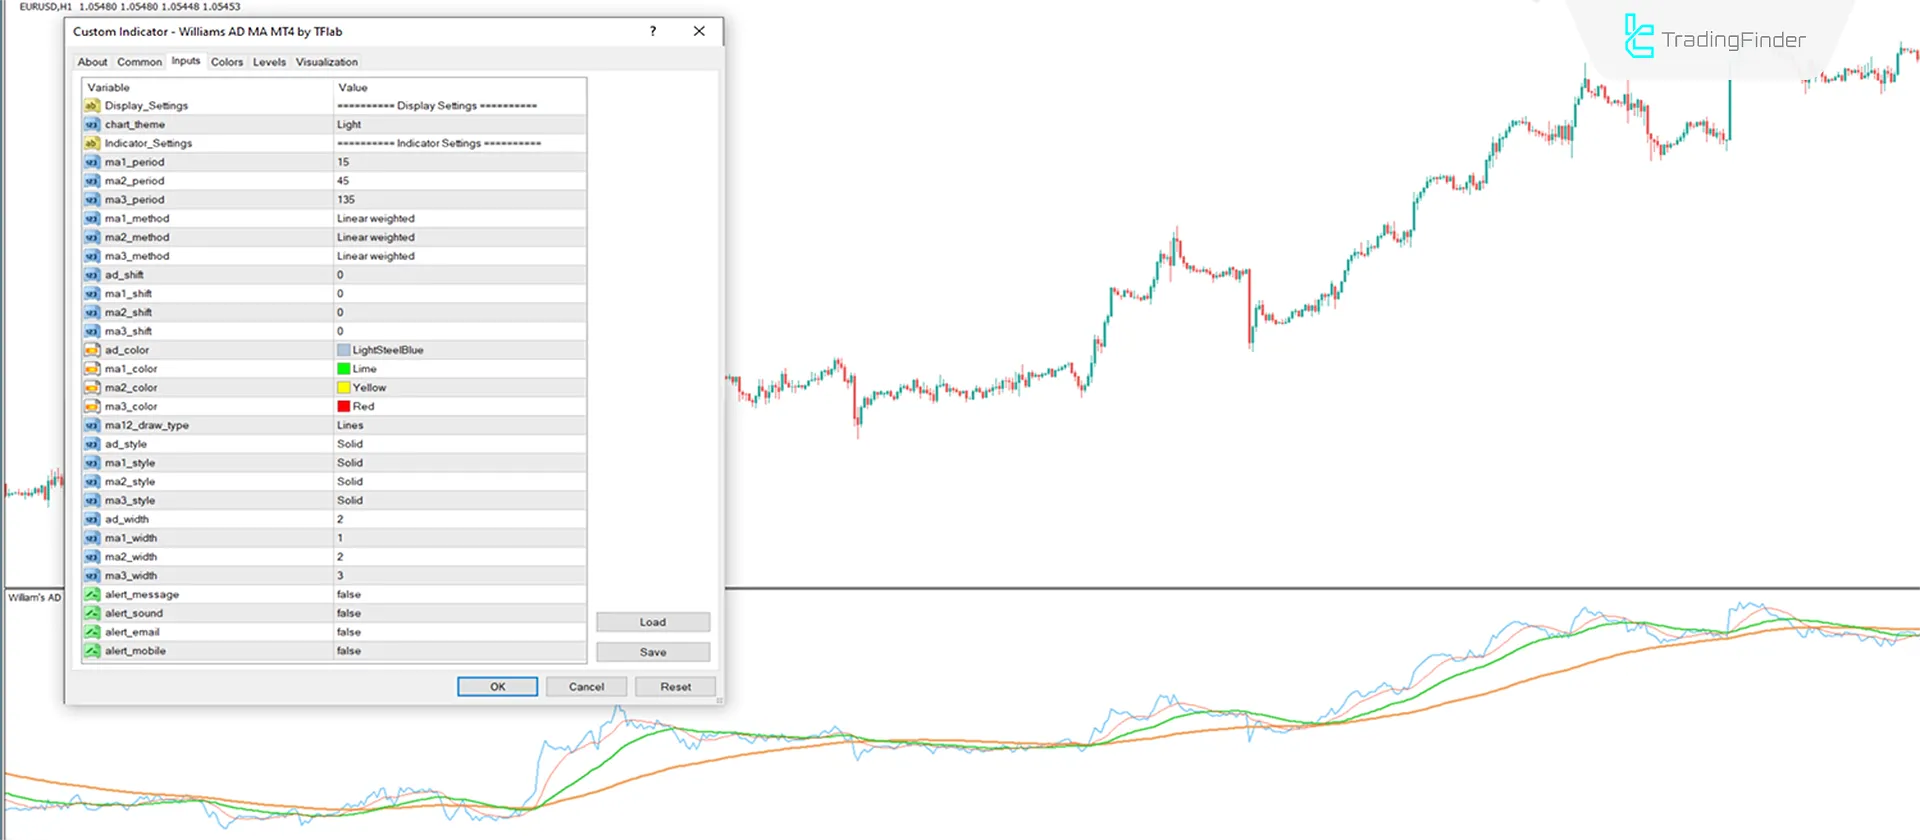
Indicator Settings

- Chart theme: The theme of the indicator;
- MA1 period: The first moving average is set to 15;
- MA2 period: The period for the second moving average is set to 45;
- MA3 period: The period for the third moving average is set to 135;
- MA method (1-2-3): Calculation method for the moving averages (e.g., Linear Weighted);
- AD shift: The number of candles for shifting the AD line forward or backward;
- MA shift (1-2-3): The number of candles for shifting the moving averages (1-2-3);
- AD Color: The color of the AD line;
- MA color (1-2-3): The colors of the moving averages (1-2-3);
- MA12 draw type: The style for displaying the moving average lines;
- AD style: The style for the AD line;
- MA style (1-2-3): The styles of the moving averages (1-2-3);
- AD width: The thickness of the AD line;
- MA width (1-2-3): The thickness of the moving averages (1-2-3);
- Alert message: Sends alerts as messages;
- Alert sound: Enables sound alerts;
- Alert email: Sends alerts via email;
- Alert mobile: Sends alerts to mobile devices.
Conclusion
The Williams AD MA Indicator, combining volume and price data with smoothing changes via "MA," helps traders analyze market trends with greater precision. The crossover signals, divergences, and trend strength evaluation make this trading tool a special choice for professional analysts and traders.
Williams AD MA MT4 PDF
Williams AD MA MT4 PDF
Click to download Williams AD MA MT4 PDFCan the parameters of the indicator be adjusted?
To match their trading strategies, traders can modify parameters like the moving average period, MA calculation method, colors, and alert settings.
Is the Williams AD MA Indicator suitable for divergence analysis?
This indicator can identify positive and negative divergences between price and the "AD" line.


