![AMKA Indicator for MetaTrader 5 – Free Download [TradingFinder]](https://cdn.tradingfinder.com/image/460309/2-104-en-amka-indicator-mt5-1.webp)
![AMKA Indicator for MetaTrader 5 – Free Download [TradingFinder] 0](https://cdn.tradingfinder.com/image/460309/2-104-en-amka-indicator-mt5-1.webp)
![AMKA Indicator for MetaTrader 5 – Free Download [TradingFinder] 1](https://cdn.tradingfinder.com/image/460307/2-104-en-amka-indicator-mt5-2.webp)
![AMKA Indicator for MetaTrader 5 – Free Download [TradingFinder] 2](https://cdn.tradingfinder.com/image/460312/2-104-en-amka-indicator-mt5-3.webp)
![AMKA Indicator for MetaTrader 5 – Free Download [TradingFinder] 3](https://cdn.tradingfinder.com/image/460311/2-104-en-amka-indicator-mt5-4.webp)
The AMKA indicator is an advanced adaptive moving average based on the Kaufman algorithm.
Compared to simple moving averages (SMA) and exponential moving averages (EMA), this technical analysis tool has two significant and distinct features:
- In trending markets, it reacts to price fluctuations with greater precision and speed, aligning more closely with the trend direction;
- In non-trending or sideways markets, it slows down to avoid false signals.
AMKA Indicator Table
The table below provides a general overview of the AMKA indicator.
Indicator Categories: | Signal & Forecast MT5 Indicators Currency Strength MT5 Indicators Momentum Indicators in MT5 |
Platforms: | MetaTrader 5 Indicators |
Trading Skills: | Elementary |
Indicator Types: | Reversal MT5 Indicators |
Timeframe: | Multi-Timeframe MT5 Indicators |
Trading Style: | Intraday MT5 Indicators |
Trading Instruments: | Forex MT5 Indicators Crypto MT5 Indicators Stock MT5 Indicators |
Overview of the AMKA Indicator
The Adaptive Moving Average Kauffman indicator, utilizing a 9-period adaptive moving average, accurately detects changes in trend direction and the current market path.
In trending phases, theAMA level acts as a support or resistance level. This tool visually displays buy and sell signals via blue dots (bullish) and red dots (bearish).
Indicator in an Uptrend
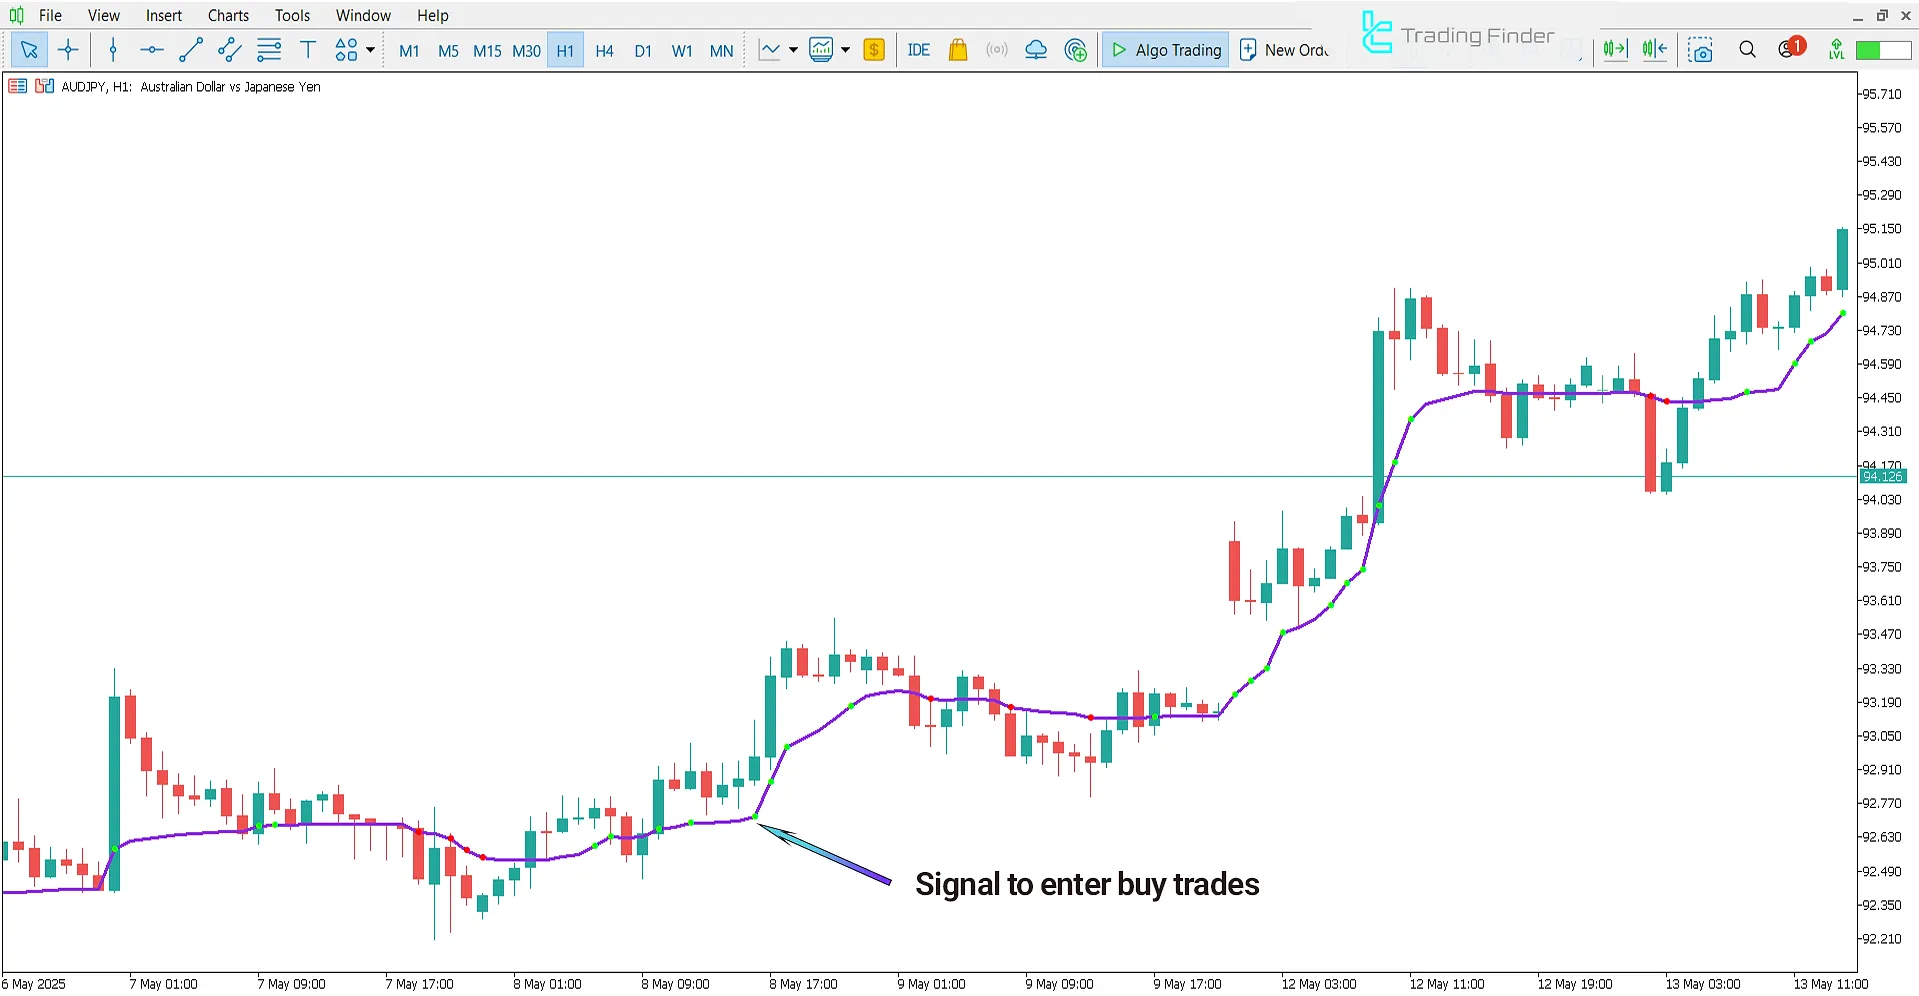
The image below displays the AUD/JPY currency pair on a 1-hour time frame. In the AMKA indicator, price crossing from below to above the adaptive average line signals a potential upward trend.
If green dots accompany this breakout, the signal gains credibility and can be considered a buy entry.

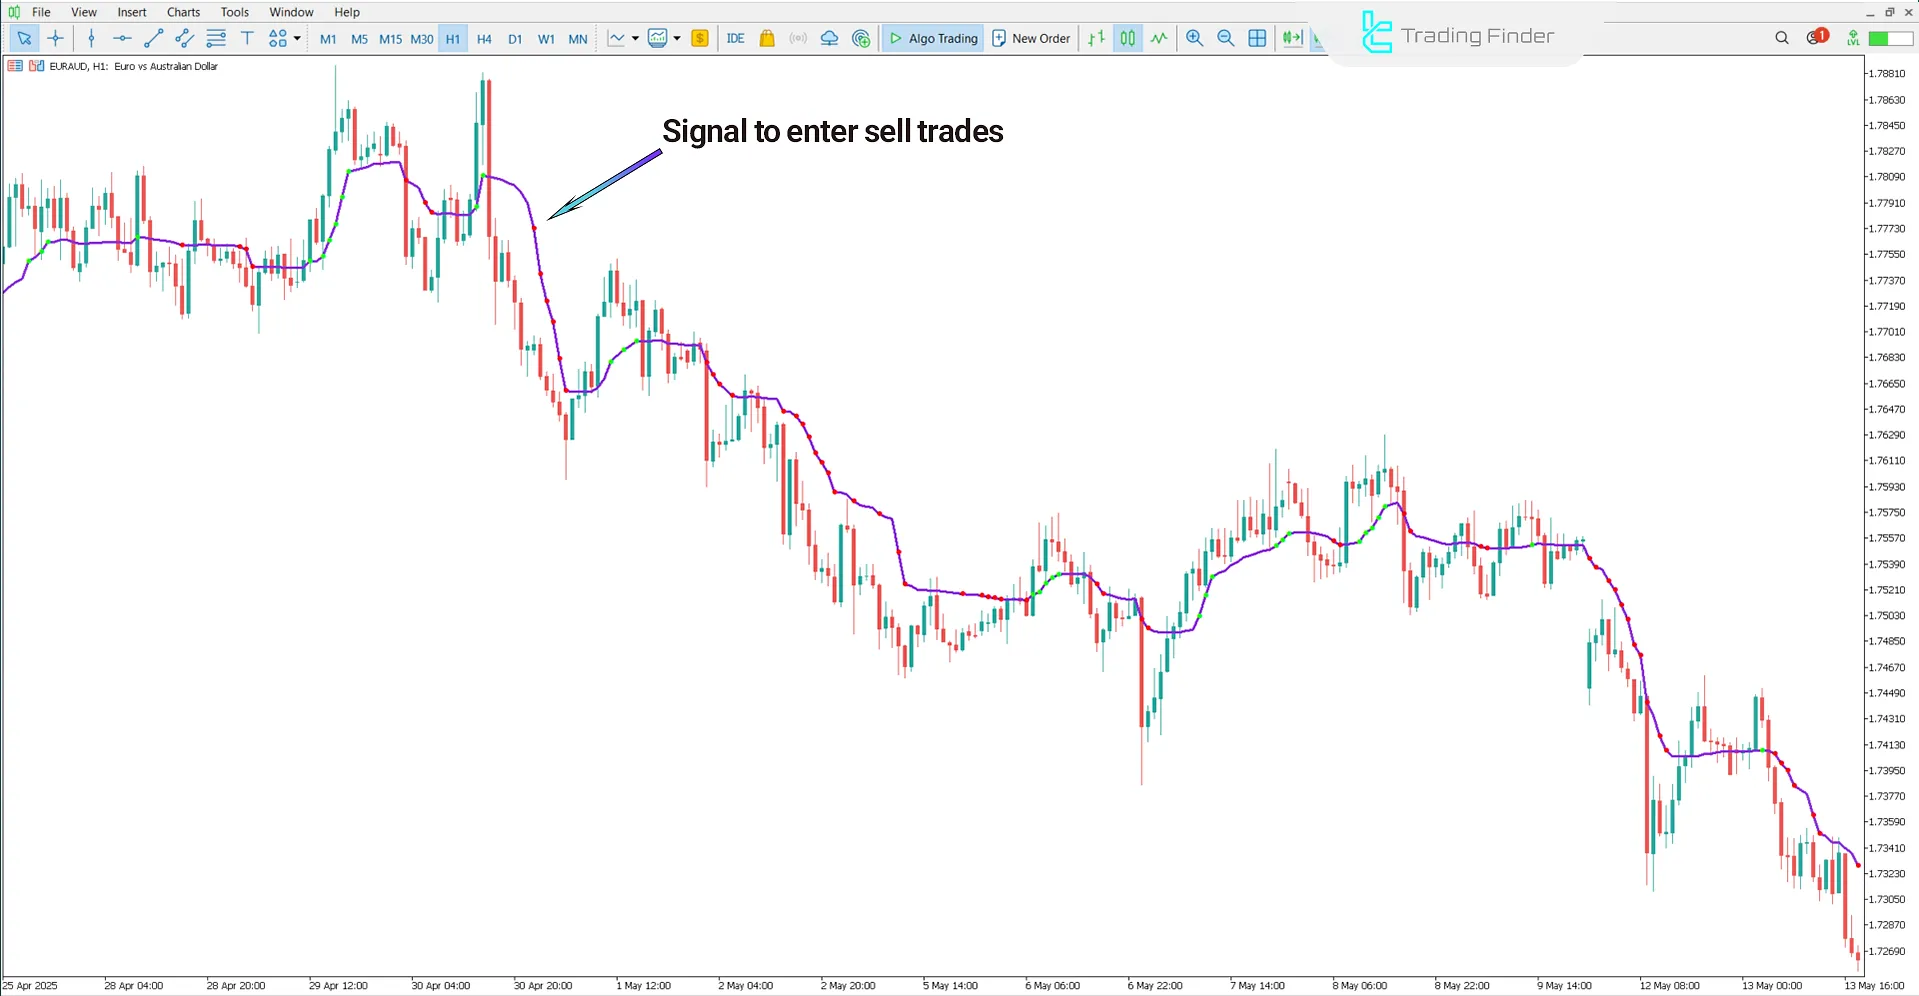
Indicator in a Downtrend
The chart below shows the Gold Spot Index (XAU/USD). When price falls below the AMKA line and the indicator simultaneously displays red dots, this combination may indicate the start of a downtrend, triggering a sell signal.

AMKA Indicator Settings
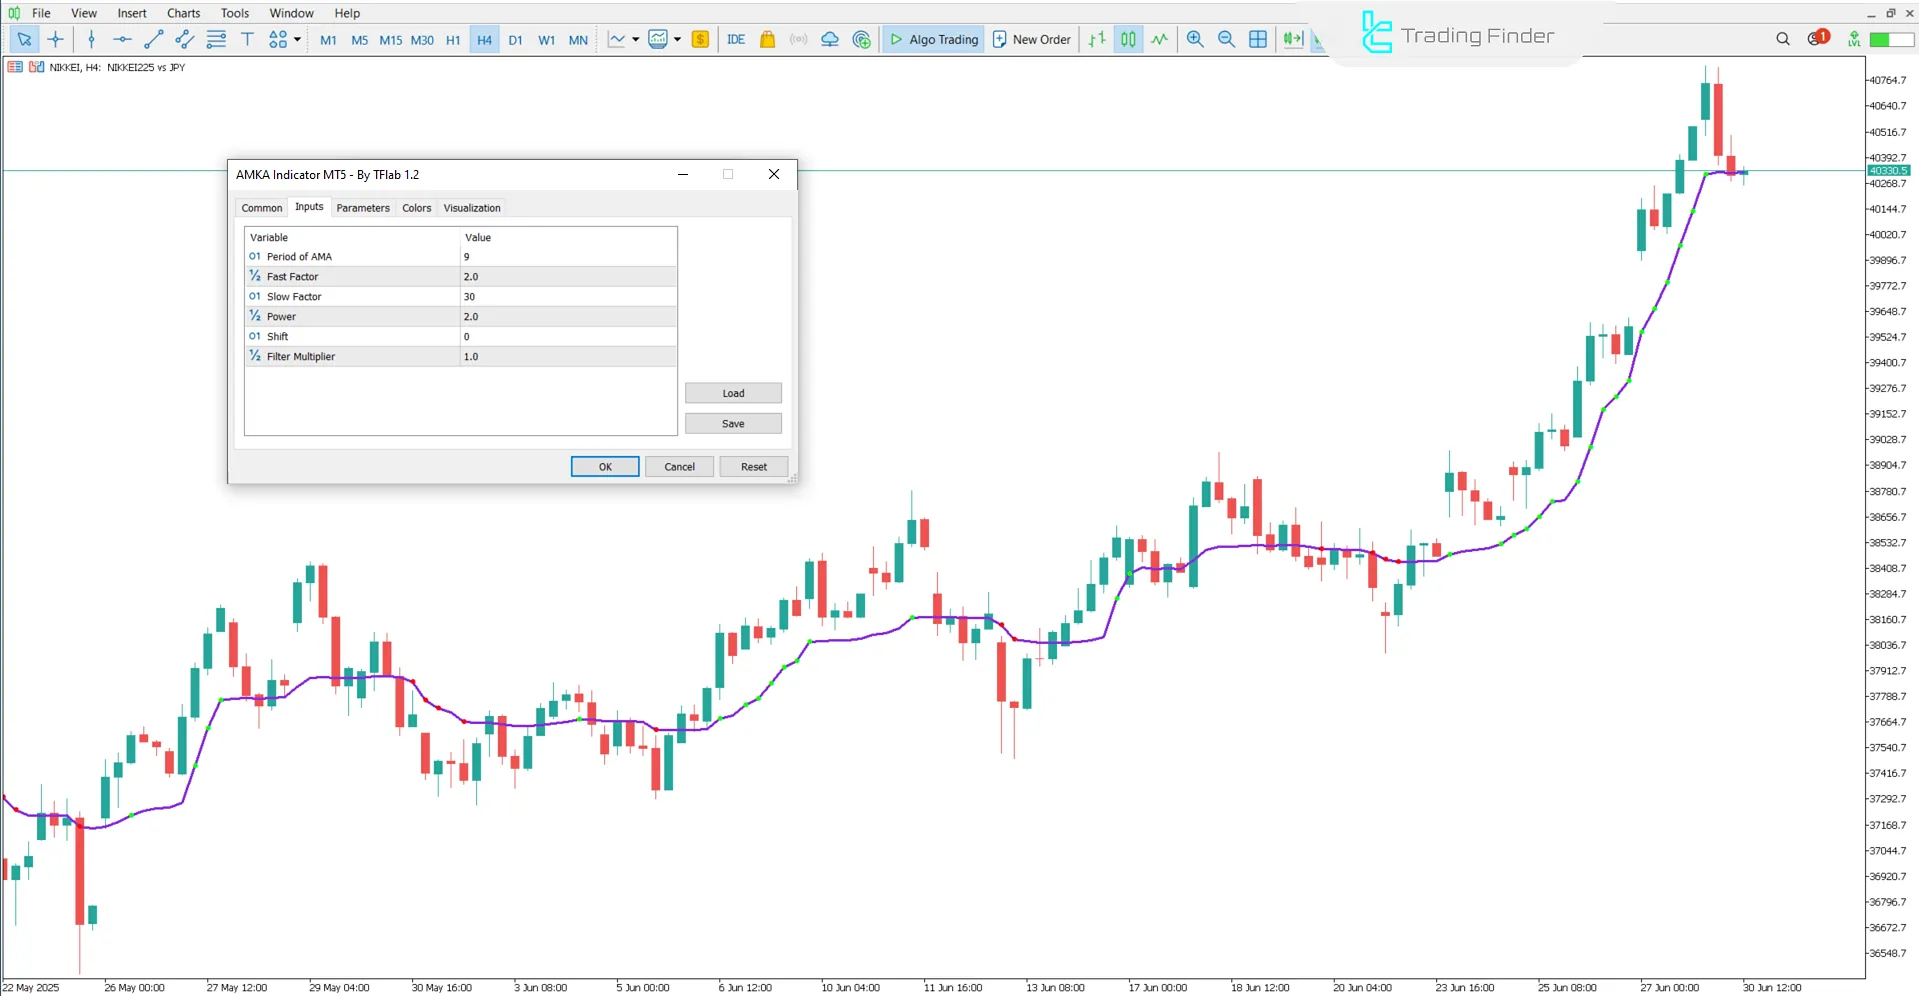
The image below shows the AMKA indicator settings panel:

- Period of AMA: Show Period for AMA;
- Fast Factor: Fast coefficient;
- Slow Factor: Slow coefficient;
- Power: Strength;
- Shift: Offset;
- Filter Multiplier: Display Filter multiplier.
Conclusion
The AMKA indicator is an adaptive moving average based on the Kaufman algorithm, which accurately identifies market direction.
By considering the price position relative to its line and graphically displaying colored dots, the indicator helps identify suitable conditions for entry and exit in trades.
AMKA MT5 PDF
AMKA MT5 PDF
Click to download AMKA MT5 PDFWhat is the role of the colored dots (red, green) in this indicator?
In this indicator, blue dots indicate buy signals (upward movement), while red dots indicate sell signals (downward movement).
Under what conditions does the AMKA indicator issue a buy signal?
In this trading tool, when the price crosses above the AMKA line and a green or blue dot appears simultaneously, it signifies the start of an uptrend and issues a buy signal.


