![Classic Cypher Harmonic Pattern Indicator for MT5 Download - [TradingFinder]](https://cdn.tradingfinder.com/image/338135/2-47-en-classic-cypher-harmonic-pattern-mt5-1.webp)
![Classic Cypher Harmonic Pattern Indicator for MT5 Download - [TradingFinder] 0](https://cdn.tradingfinder.com/image/338135/2-47-en-classic-cypher-harmonic-pattern-mt5-1.webp)
![Classic Cypher Harmonic Pattern Indicator for MT5 Download - [TradingFinder] 1](https://cdn.tradingfinder.com/image/338137/2-47-en-classic-cypher-harmonic-pattern-mt5-2.webp)
![Classic Cypher Harmonic Pattern Indicator for MT5 Download - [TradingFinder] 2](https://cdn.tradingfinder.com/image/338136/2-47-en-classic-cypher-harmonic-pattern-mt5-3.webp)
![Classic Cypher Harmonic Pattern Indicator for MT5 Download - [TradingFinder] 3](https://cdn.tradingfinder.com/image/338134/2-47-en-classic-cypher-harmonic-pattern-mt5-4.webp)
On July 1, 2025, in version 2, alert/notification and signal functionality was added to this indicator
The Classic Cypher Harmonic Pattern Indicator is one of the technical analysis structures based on harmonic patterns, designed using asymmetrical Fibonacci ratios.
This pattern precisely identifies key points X, A, B, C, and D and highlights important price reversal zones on the chart using red and gray lines.
Classic Cypher Harmonic Pattern Specifications Table
The specifications of the Classic Cypher Harmonic Pattern Indicator are presented in the table below.
Indicator Categories: | Price Action MT5 Indicators Chart & Classic MT5 Indicators Harmonic MT5 Indicators |
Platforms: | MetaTrader 5 Indicators |
Trading Skills: | Intermediate |
Indicator Types: | Reversal MT5 Indicators |
Timeframe: | Multi-Timeframe MT5 Indicators |
Trading Style: | Intraday MT5 Indicators |
Trading Instruments: | Forex MT5 Indicators Crypto MT5 Indicators Stock MT5 Indicators Forward MT5 Indicators Share Stock MT5 Indicators |
Indicator at a Glance
The Classic Cypher Harmonic Pattern Indicator is a pattern based on recurring behavioral structures in the market. It combines precise Fibonacci ratios to identify trend weakness zones.
This indicator analyzes the price structure through five key points and four consecutive waves, highlighting point D as the most likely price reaction zone.
Uptrend Conditions
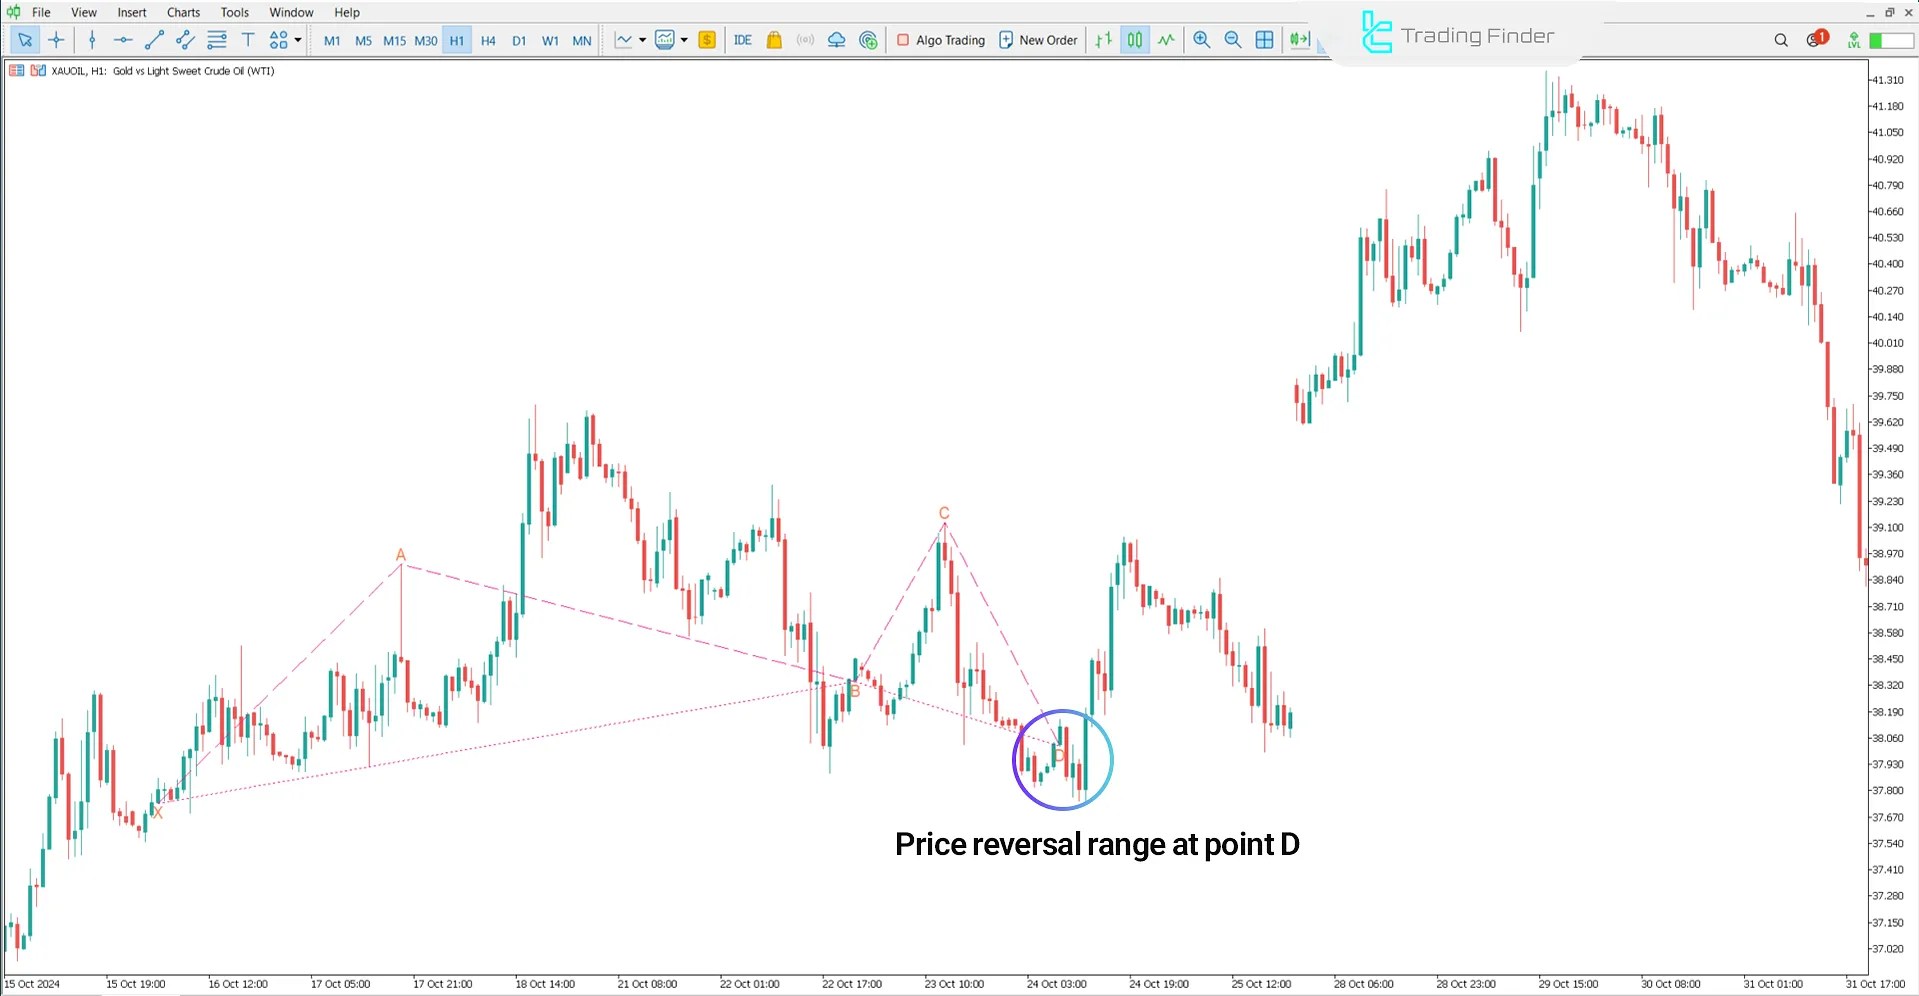
The Cypher pattern starts with a bullish move from X to A in the one-hour chart of Gold vs. Oil. Then, the price temporarily corrects down to point B.
Next, wave BC moves beyond the A high. After that, the price enters the final correction phase and reaches point D, where a bullish reversal is anticipated.

Downtrend Conditions
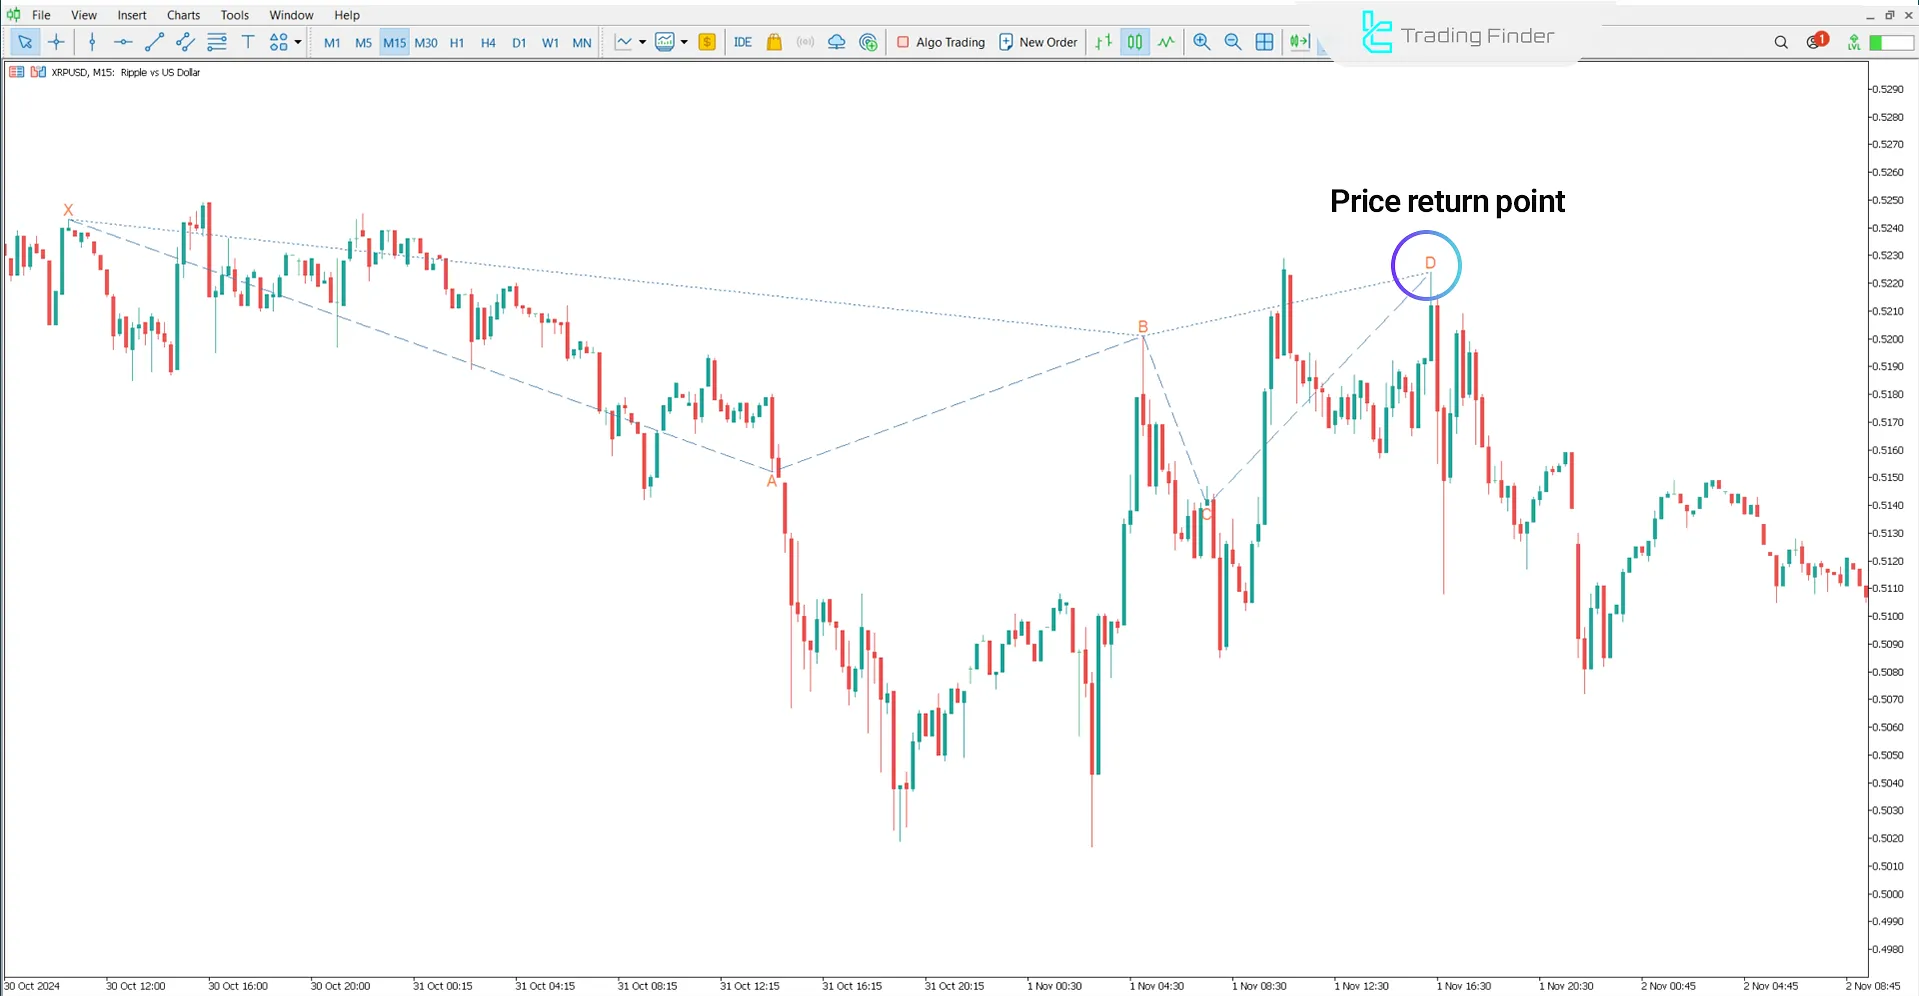
In the 15-minute XRPUSD chart, the bearish Cypher pattern begins with a price decline from X to A. Then, a temporary correction pushes the price up to point B.
Subsequently, wave BC breaks below A with strong bearish momentum, signaling seller entry.
Upon reaching point D, the pattern completes, and the PRZ (Potential Reversal Zone) is identified as the area to begin a bearish move.

Indicator Settings
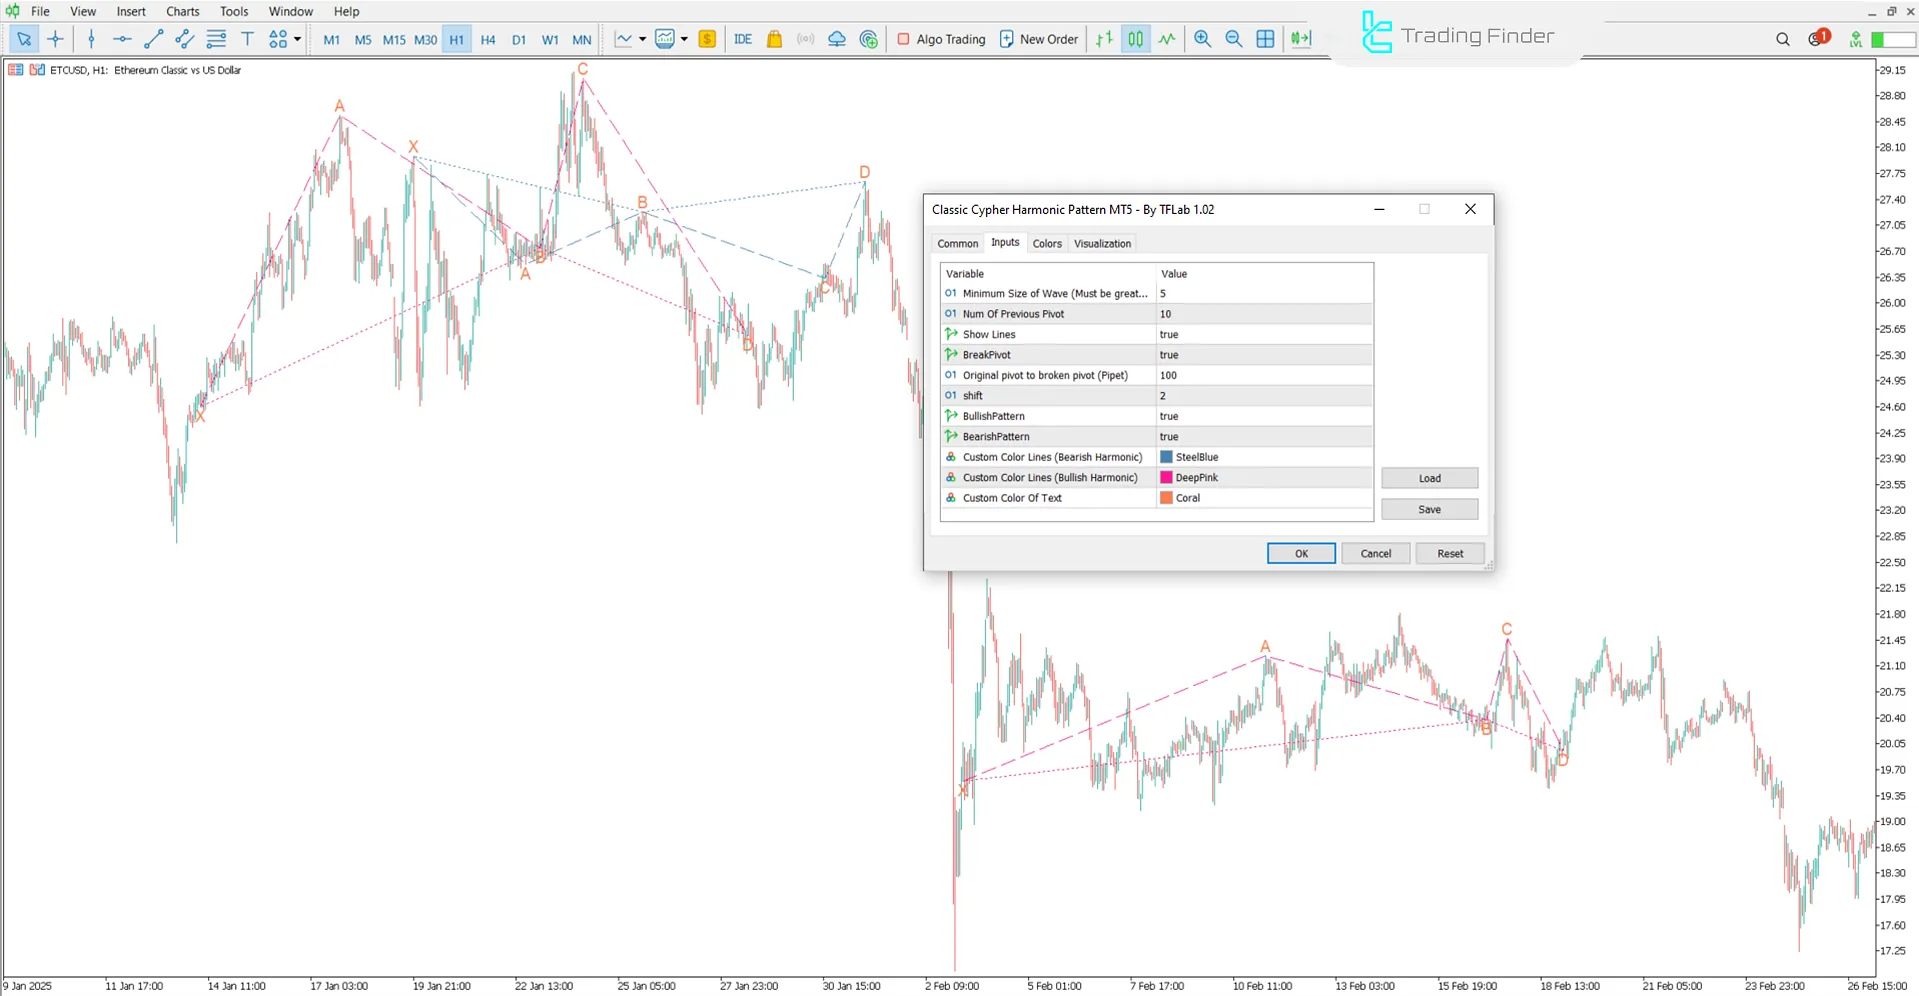
The following image shows the settings panel of the Classic Cypher Harmonic Pattern Indicator on MetaTrader 5:

- Minimum Length Of Wave (candle): Minimum length of a wave (in number of candles)
- Num Of Previous Candle: Number of previous candles to scan the market
- Show Lines: Display pattern lines
- BreakPivot: Analyze pivot breakouts
- Original pivot to broken pivot (Pipet): Distance (in pipets) from the original pivot to the broken one
- Shift: Horizontal shift of lines
- BullishPattern: Show bullish patterns
- BearishPattern: Show bearish patterns
- Style Of Line: Type of line
- Width Of Line: Line thickness
- Custom Color Lines (Bearish Harmonic): Color of bearish harmonic lines
- Custom Color Lines (Bullish Harmonic): Color of bullish harmonic lines
- Custom Color Of Text: Color of annotation text on the chart
Conclusion
The Classic Cypher Harmonic Pattern Indicator is an advanced technical analysis tool that uses Fibonacci ratios to identify potential price reversal points.
This indicator is especially useful in sideways or low-volatility markets.
Classic Cypher Harmonic Pattern MT5 PDF
Classic Cypher Harmonic Pattern MT5 PDF
Click to download Classic Cypher Harmonic Pattern MT5 PDFWhat does the Classic Cypher Harmonic Pattern Indicator do?
This indicator automatically detects the Cypher structure on the chart and identifies point D (potential reversal zone) based on Fibonacci ratios.
In which markets does this indicator perform better?
This tool performs more accurately in volatile markets such as Forex, cryptocurrencies, and indices, as its core function is to analyze price waves and detect potential reversal points within corrective movements.


