![Weis Volume Dynamics Indicator for MetaTrader 5 Download - [TradingFinder]](https://cdn.tradingfinder.com/image/341674/2-27-en-weis-volume-dynamics-mt5-1.webp)
![Weis Volume Dynamics Indicator for MetaTrader 5 Download - [TradingFinder] 0](https://cdn.tradingfinder.com/image/341674/2-27-en-weis-volume-dynamics-mt5-1.webp)
![Weis Volume Dynamics Indicator for MetaTrader 5 Download - [TradingFinder] 1](https://cdn.tradingfinder.com/image/341675/2-27-en-weis-volume-dynamics-mt5-2.webp)
![Weis Volume Dynamics Indicator for MetaTrader 5 Download - [TradingFinder] 2](https://cdn.tradingfinder.com/image/341673/2-27-en-weis-volume-dynamics-mt5-3.webp)
![Weis Volume Dynamics Indicator for MetaTrader 5 Download - [TradingFinder] 3](https://cdn.tradingfinder.com/image/341662/2-27-en-weis-volume-dynamics-mt5-4.webp)
The Weis Volume Dynamics Indicator is an advanced Technical analysis tool on the MetaTrader 5 (MT5) platform that divides price movements into distinct waves and calculates the trading volume associated with each wave.
This MT5 oscillator uses histogram bars to identify the strengths and weaknesses of bullish and bearish trends.
Weis Volume Dynamics Specifications Table
The general specifications of the Weis Volume Dynamics oscillator are shown in the table below.
Indicator Categories: | Oscillators MT5 Indicators Pivot Points & Fractals MT5 Indicators Currency Strength MT5 Indicators |
Platforms: | MetaTrader 5 Indicators |
Trading Skills: | Intermediate |
Indicator Types: | Reversal MT5 Indicators |
Timeframe: | Multi-Timeframe MT5 Indicators |
Trading Style: | Intraday MT5 Indicators |
Trading Instruments: | Forex MT5 Indicators Crypto MT5 Indicators Stock MT5 Indicators Forward MT5 Indicators |
Uptrend Conditions
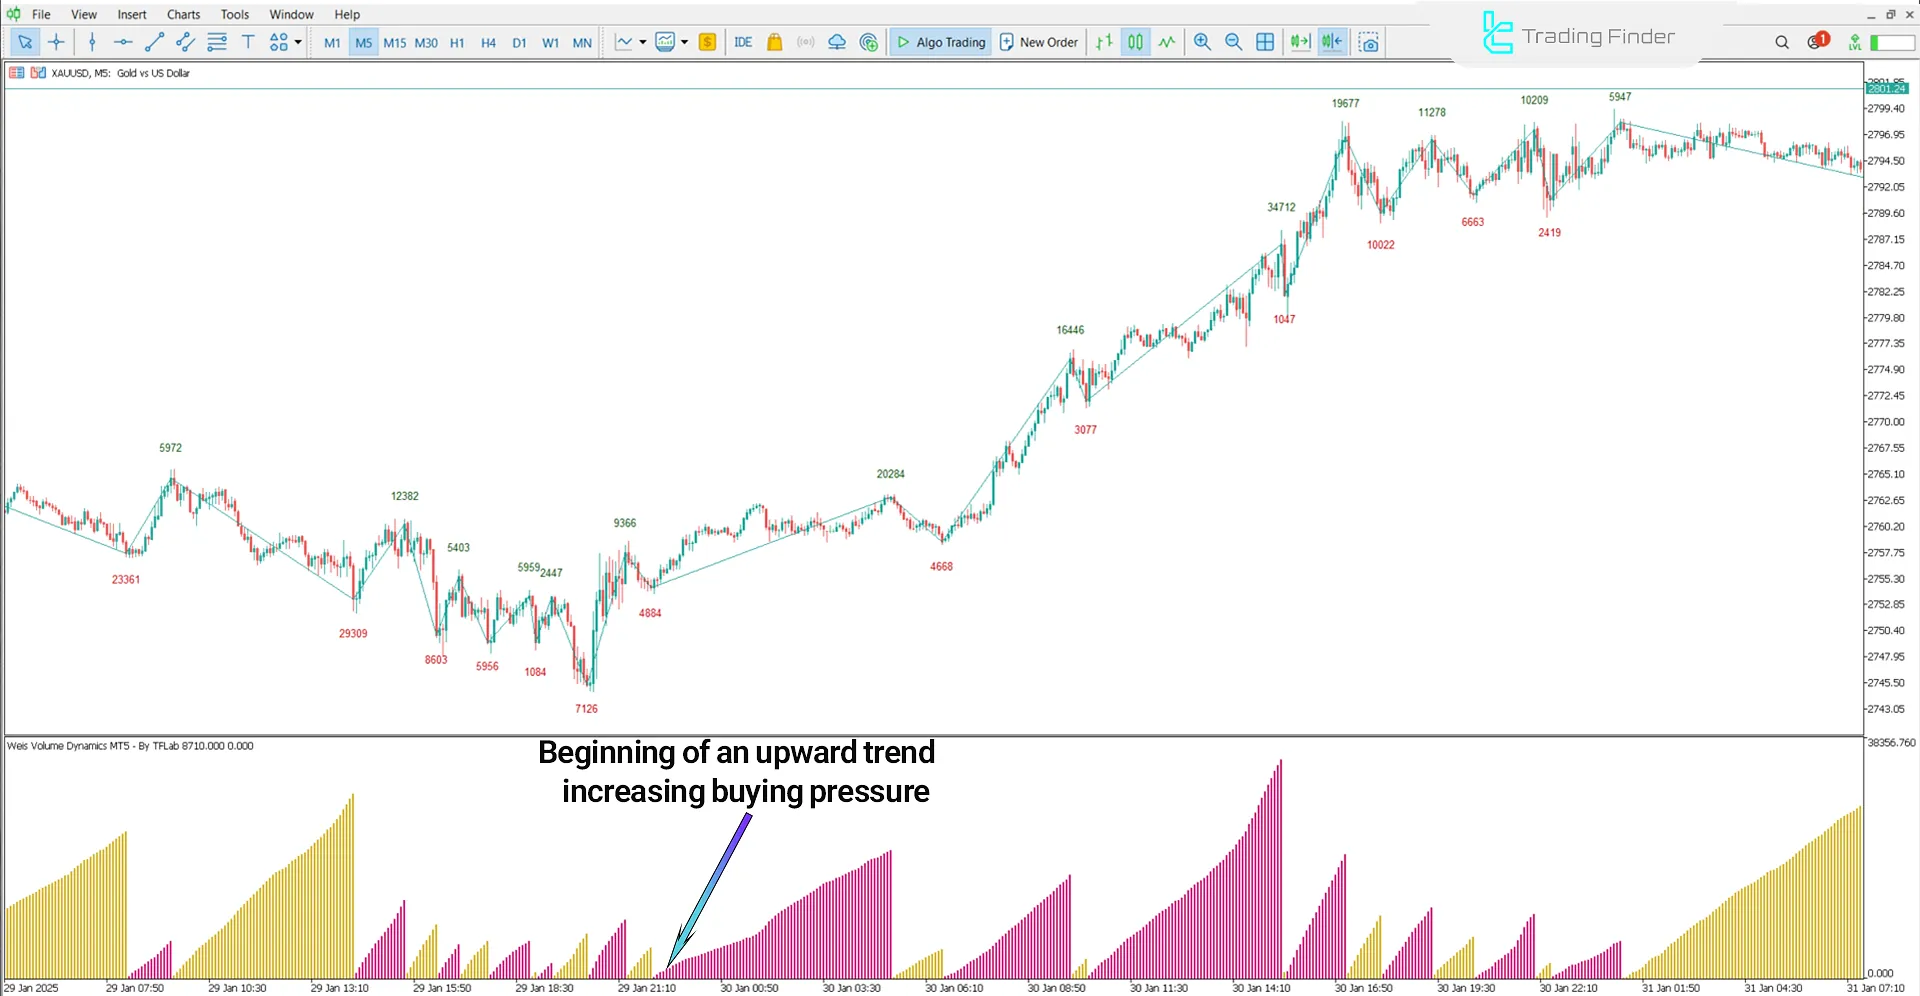
In the 5-minute XAU/USD (Gold) chart, the histogram's change from yellow to pink confirms the trend reversal from bearish to bullish.
The bullish trend starts with an increase in the length of the pink histogram bars, indicating trend strength and market oversold conditions. In such situations, a Buy signal is generated.

Downtrend Conditions
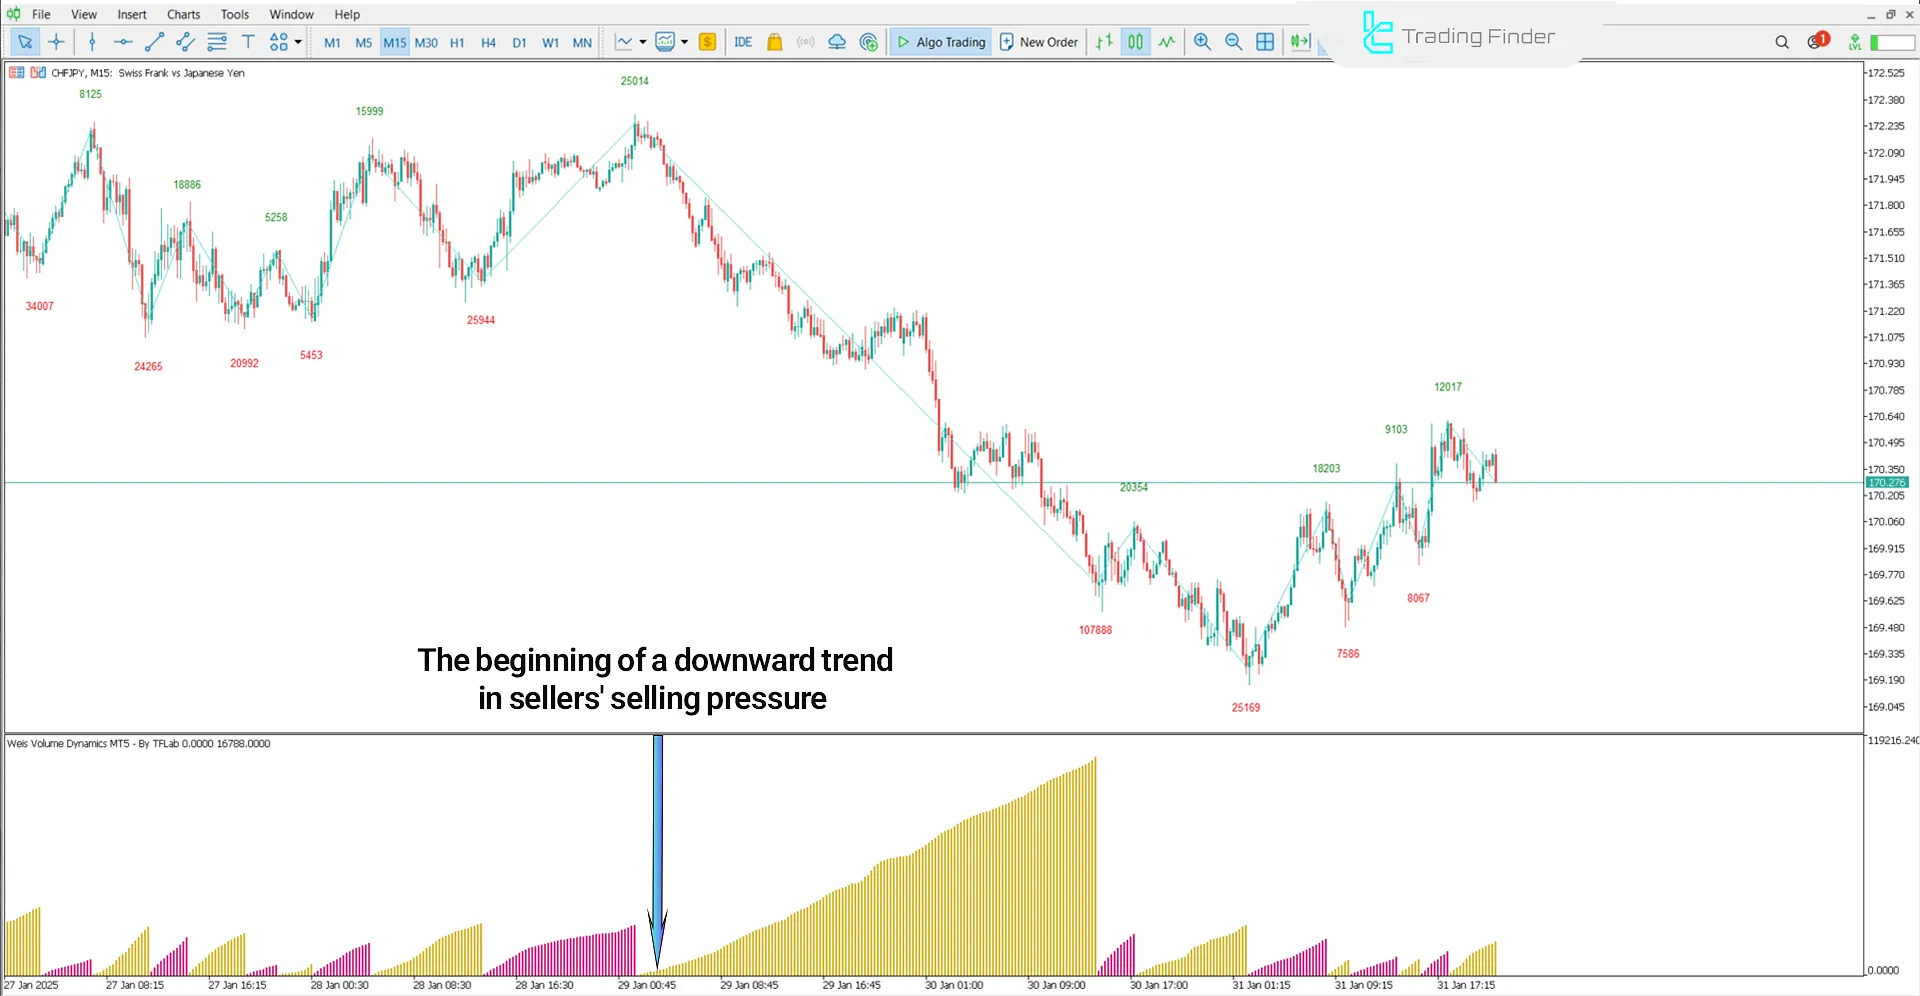
The 15-minute chart of CHF/JPY (Swiss Franc vs. Japanese Yen) shows increased selling pressure. The change in histogram bar color from pink to yellow indicates a trend reversal from bullish to bearish.
Additionally, the increase in the length of the yellow histogram bars confirms the strength of the bearish trend and generates a Sell signal.

Indicator Settings
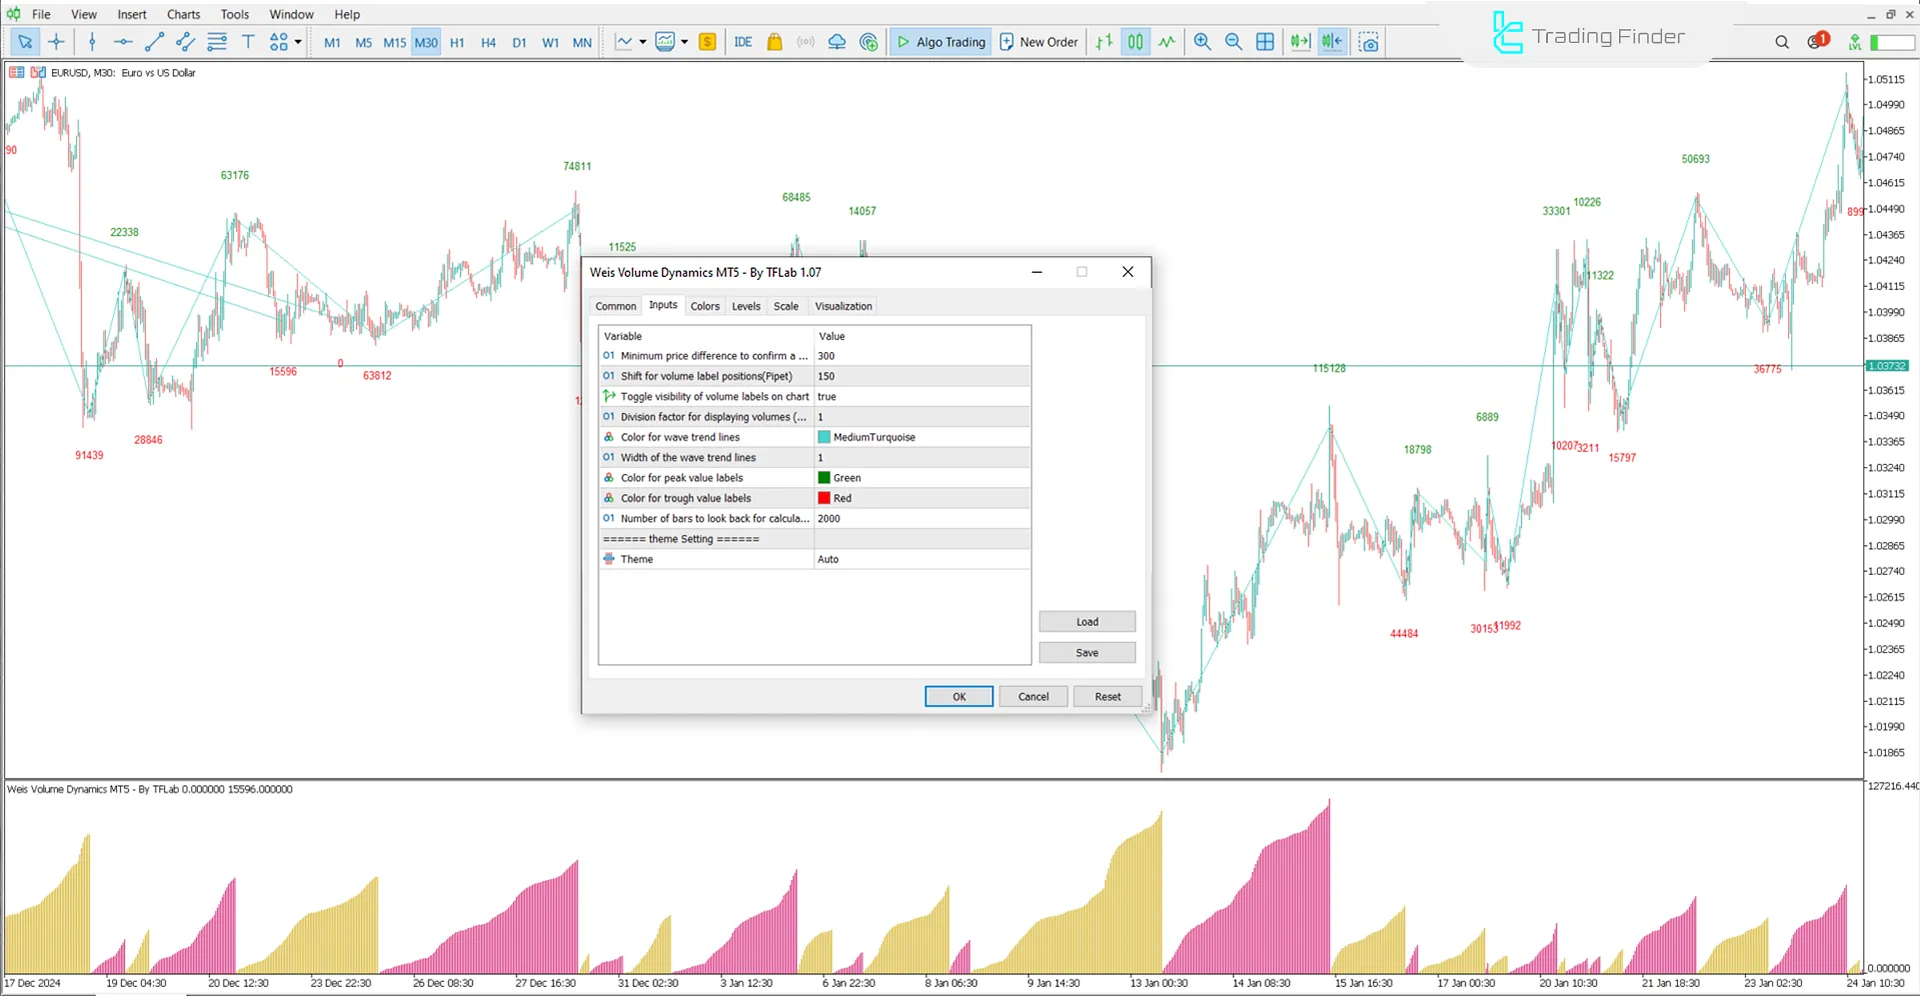
The indicator settings are fully displayed in the image below:

- Minimum price difference to confirm a wave change: hreshold for price deviation to validate wave reversal
- Shift for volume label positions (Pipet): Offset adjustment for volume label placement in pips
- Toggle visibility of volume labels on chart: Enable or disable volume labels display on the price chart
- Division factor for displaying volumes (Volume Scaling): Multiplier to scale displayed volume data for clarity
- Color for wave trend lines: Set color for trend lines representing wave direction
- Width of the wave trend lines: Adjust thickness of wave trend lines for better visualization
- Color for peak value labels: Define color for labels showing volume peaks
- Color for trough value labels: Set color for labels indicating volume troughs
Conclusion
The Weis Volume Dynamics Indicator for MetaTrader 5 provides traders with suitable entry and exit points using histogram bars in Markets like Forex.
This tool visually displays market trend changes and identifies trend strength by examining the increase or decrease in histogram bar length.
Weis Volume Dynamics MT5 PDF
Weis Volume Dynamics MT5 PDF
Click to download Weis Volume Dynamics MT5 PDFWhich timeframes is the Weis Volume Dynamics oscillator suitable for?
This oscillator is multi-timeframe and can be used across all timeframes.
Is the Weis Volume Dynamics indicator suitable for all markets?
This indicator can be used in various financial markets, including Forex, stocks, cryptocurrencies, and commodities.


