TradingView
MetaTrader4
MetaTrader5
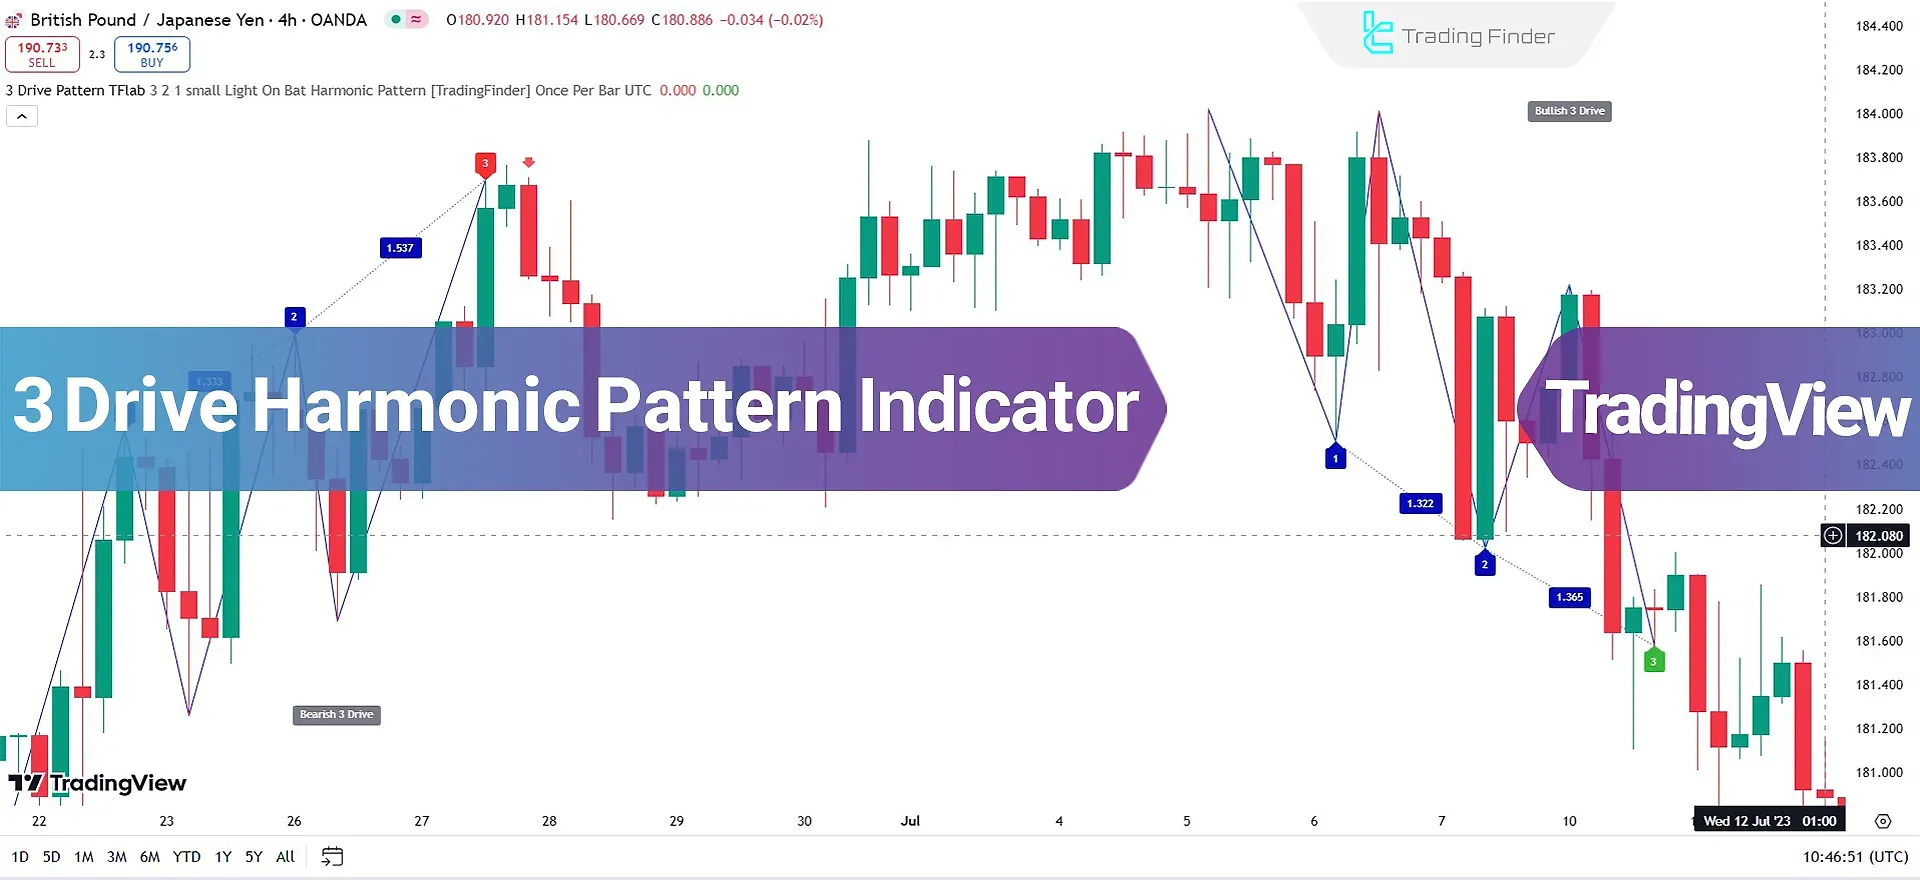
The 3 Drive Harmonic Pattern Indicator, among TradingView indicators, allows traders to identify harmonic reversal patterns on price charts.
This indicator examines three consecutive price movements and displays them sequentially numbered (1, 2, and 3) on the chart.

Once the third movement (Drive 3) completes and price reversal confirmations, such as Doji candles, are identified, the indicator issues a trade entry signal.
Indicator Table Specifications
Indicator Categories: | Signal & Forecast Tradingview Indicators Harmonic Tradingview Indicators Chart & Classic Tradingview indicators |
Platforms: | Trading View Indicators |
Trading Skills: | Intermediate |
Indicator Types: | Reversal Tradingview Indicators |
Timeframe: | Multi-Timeframe Tradingview Indicators |
Trading Style: | Intraday Tradingview Indicators |
Trading Instruments: | Stock Market MT4 Indicators TradingView Indicators in the Forex Market Cryptocurrency Tradingview Indicators |
Indicator Overview
The three consecutive price movements are analyzed based on key Fibonacci ratios (1.27 and 1.618), helping identify potential reversal zones (PRZ).
Each drive aligns with significant Fibonacci levels; the indicator marks buy signals with green arrows for upward trends and sell signals with red arrows for downward trends.
Indicator in an Uptrend
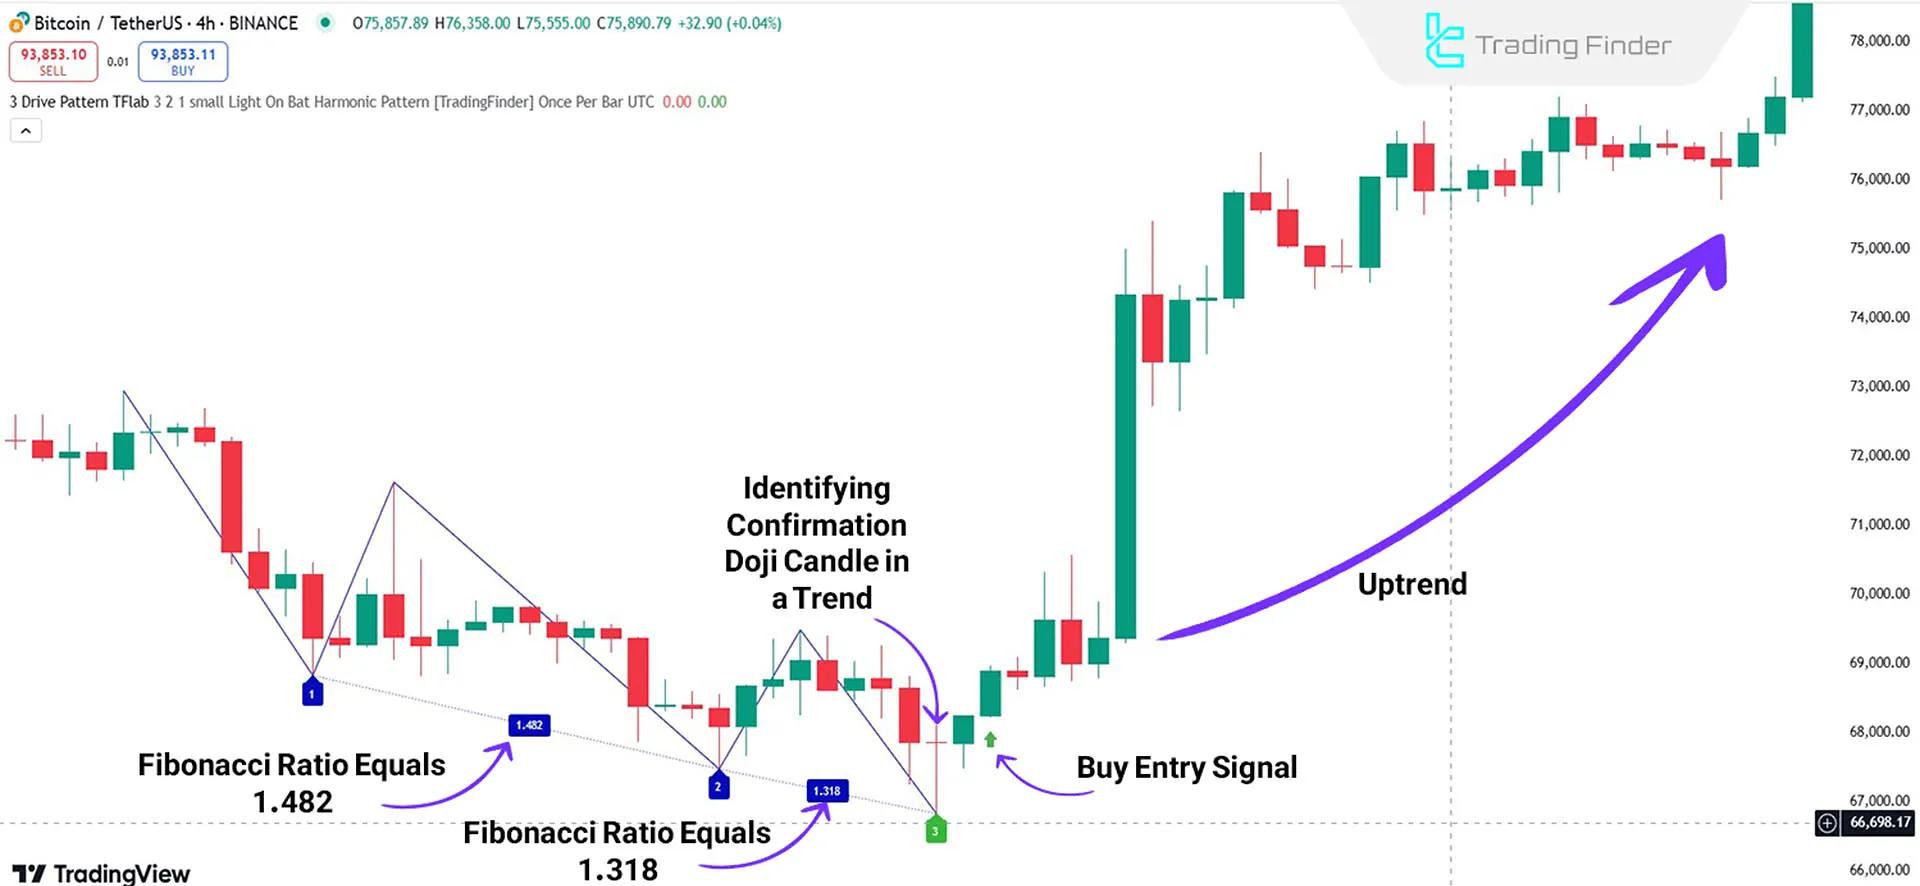
In the chart below, the price first moves downward, followed by a retracement to the Fibonacci 1.482 level. The price then continues its downward movement until reaching the Fibonacci 1.318 level from the previous correction.
During the third drive, the price enters the PRZ, where Fibonacci level confluence occurs, creating a potential reversal area for upward movement.
The indicator looks for confirmations like candlestick patterns (e.g., Doji or Pin Bar) in this area. Upon confirmation, it issues a Buy Entry Signal.

Indicator in a Downtrend
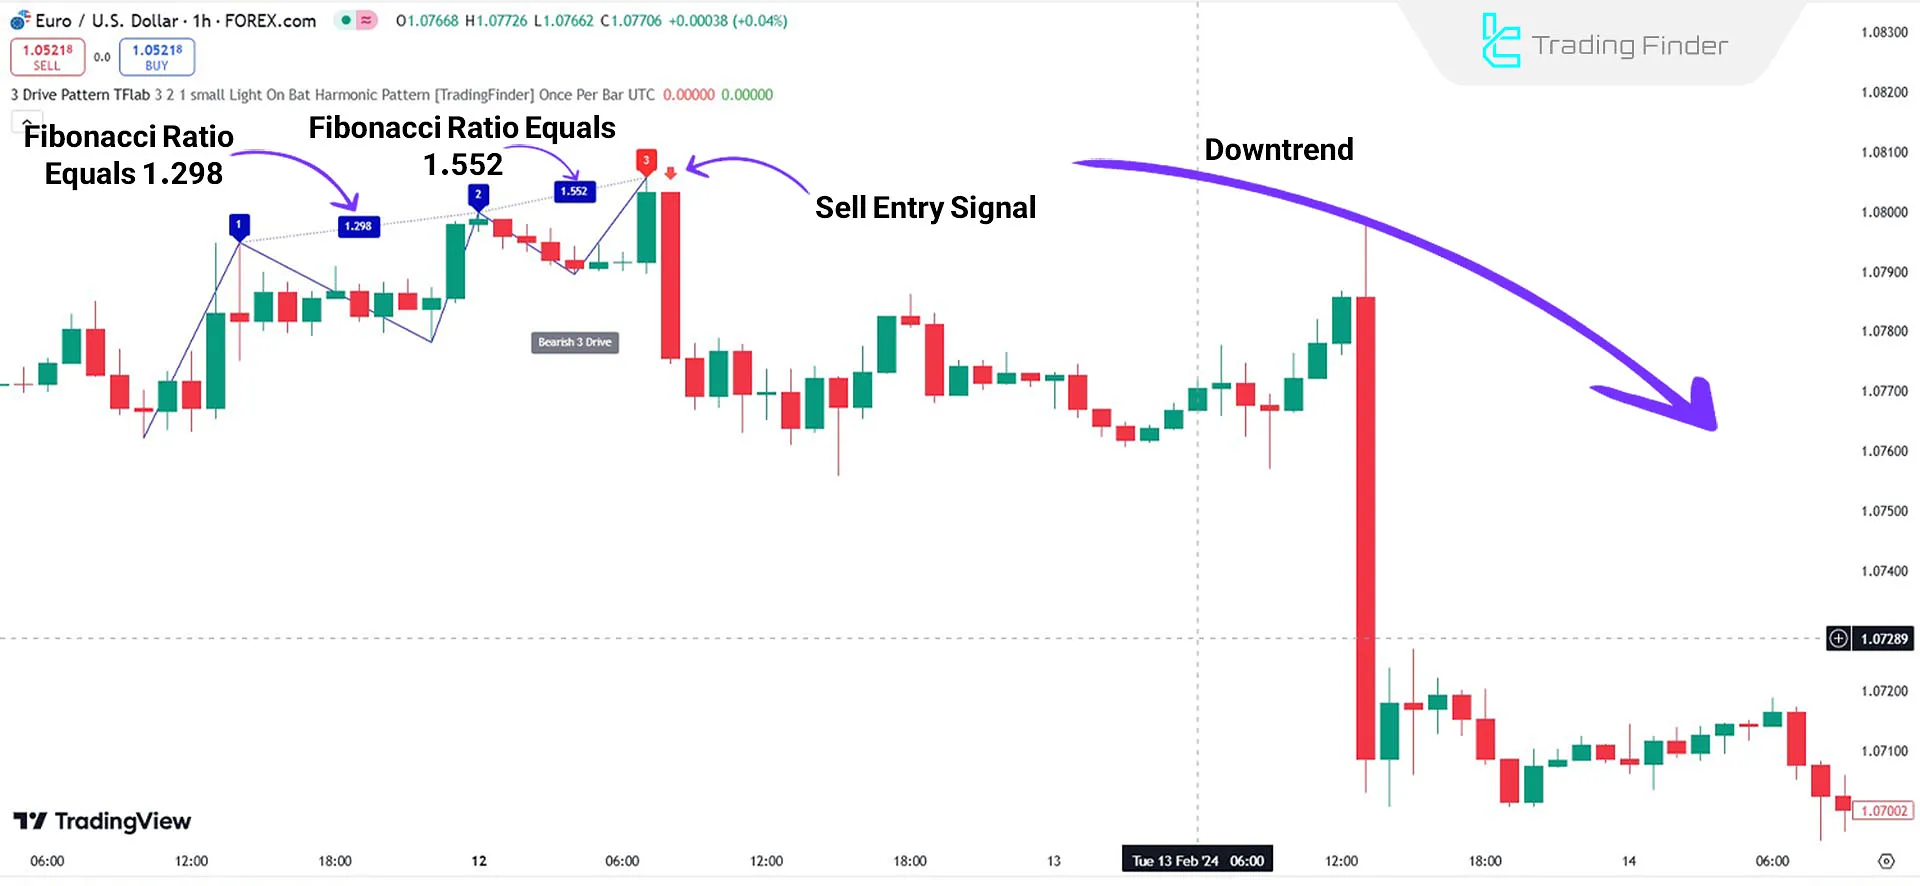
In the first drive, the price moves upward and retraces to approximately 1.298 Fibonacci level; in the second drive, the price extends upward to the 1.552 Fibonacci level. This pattern repeats for the third drive until reaching the PRZ.
Once the PRZ is identified, the indicator displays a Sell Entry Signal with a red arrow for traders.

Indicator Settings

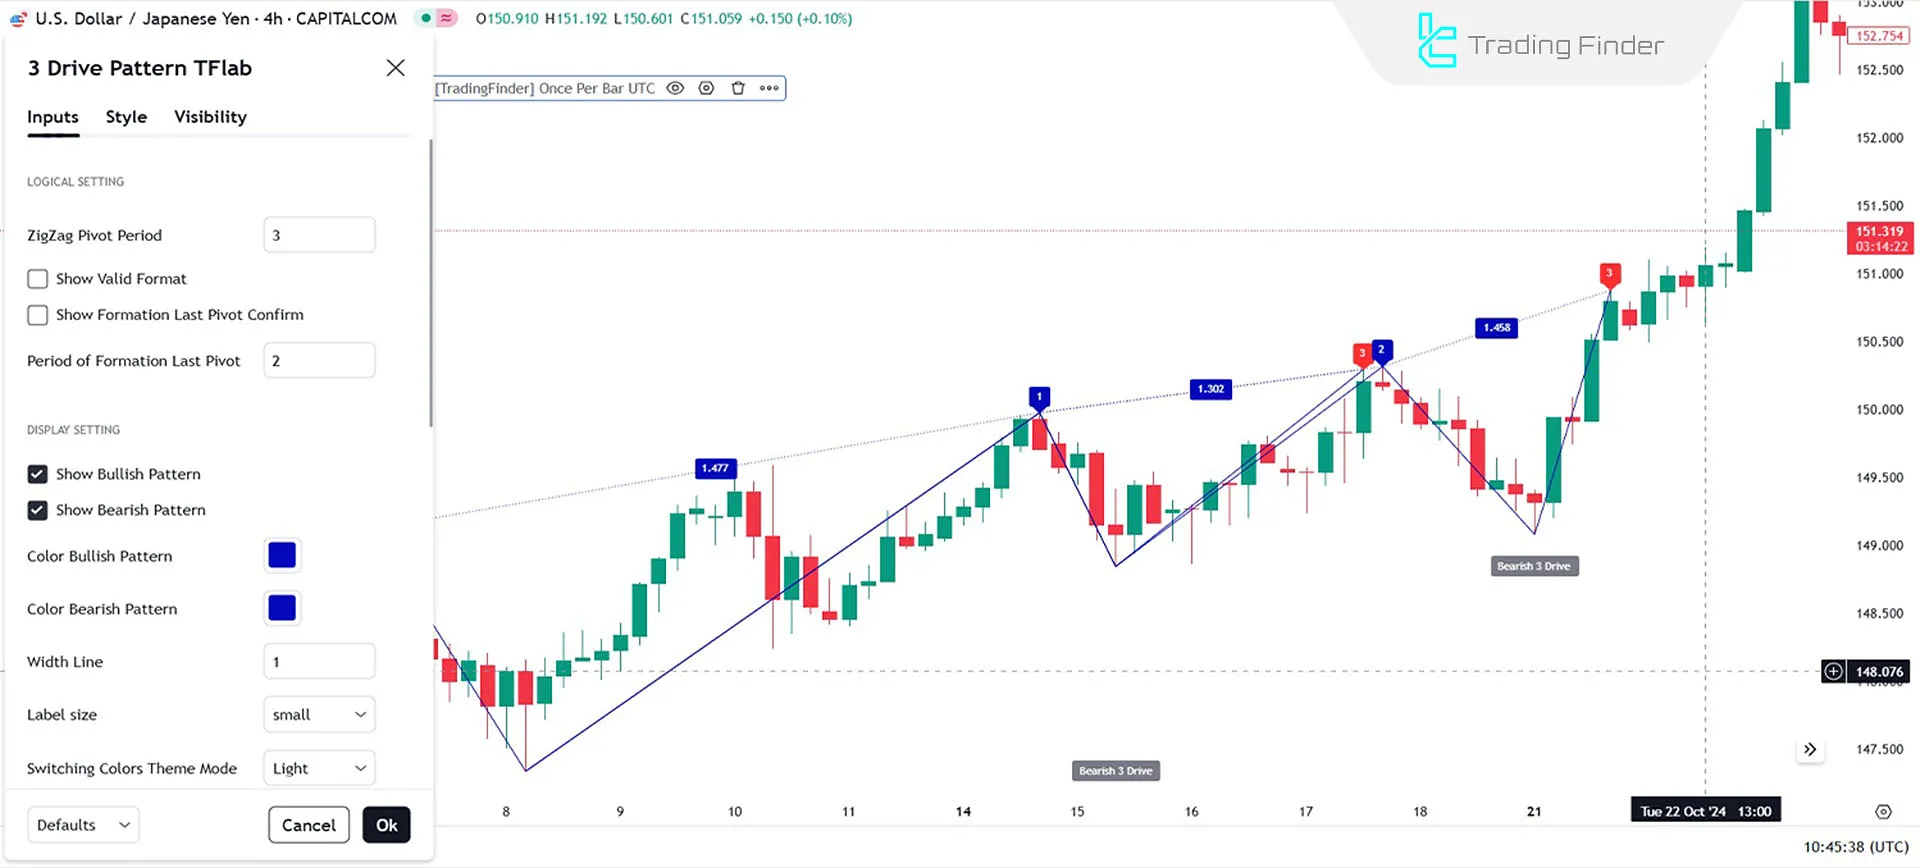
- ZigZag Pivot Period: Configures the number of periods for identifying pivot points in the ZigZag chart;
- Show Valid Format: Option to display valid formats for pattern recognition;
- Show Formation Last Pivot Confirm: Enables confirmation for the last pivot formation;
- Period of Formation Last Pivot: Sets the number of periods to confirm the last pivot formation;
- Show Bullish Pattern: Displays bullish patterns on the chart;
- Show Bearish Pattern: Displays bearish patterns on the chart;
- Color Bullish Pattern: Sets the color for bullish patterns;
- Color Bearish Pattern: Sets the color for bearish patterns;
- Width Line: Adjusts line thickness for patterns;
- Label Size: Configures label size on the chart;
- Switching Colors Theme Mode: Toggles color themes between light and dark modes;
- Alert: Sends alerts when patterns are detected;
- Alert Name: Sets a custom name for alerts;
- Message Frequency: Customizes the message content for alerts;
- Show Alert Time by Time Zone: Displays alert times according to the selected time zone.
Conclusion
This harmonic pattern indicator, with features such as automatic pattern detection, precise Fibonacci ratios (1.27 and 1.618), and support for confirmation signals like candlestick patterns, is well-suited for trading strategies based on harmonic analysis.
The indicator generates Buy Entry Signals (green arrow) for uptrends and Sell Entry Signals (red arrow) for downtrends using its sequential structure.
Three Drive Harmonic Pattern TradingView PDF
Three Drive Harmonic Pattern TradingView PDF
Click to download Three Drive Harmonic Pattern TradingView PDFHow are buy and sell signals shown in the Three-Drive Pattern?
In uptrends, the indicator shows buy signals with green arrows, and in downtrends, it issues sell signals with red arrows.
What confirmations are used for the indicator signals?
The indicator uses candlestick confirmations, such as Doji or Pin Bar patterns, to add reliability to its signals.


