TradingView
MetaTrader4
MetaTrader5
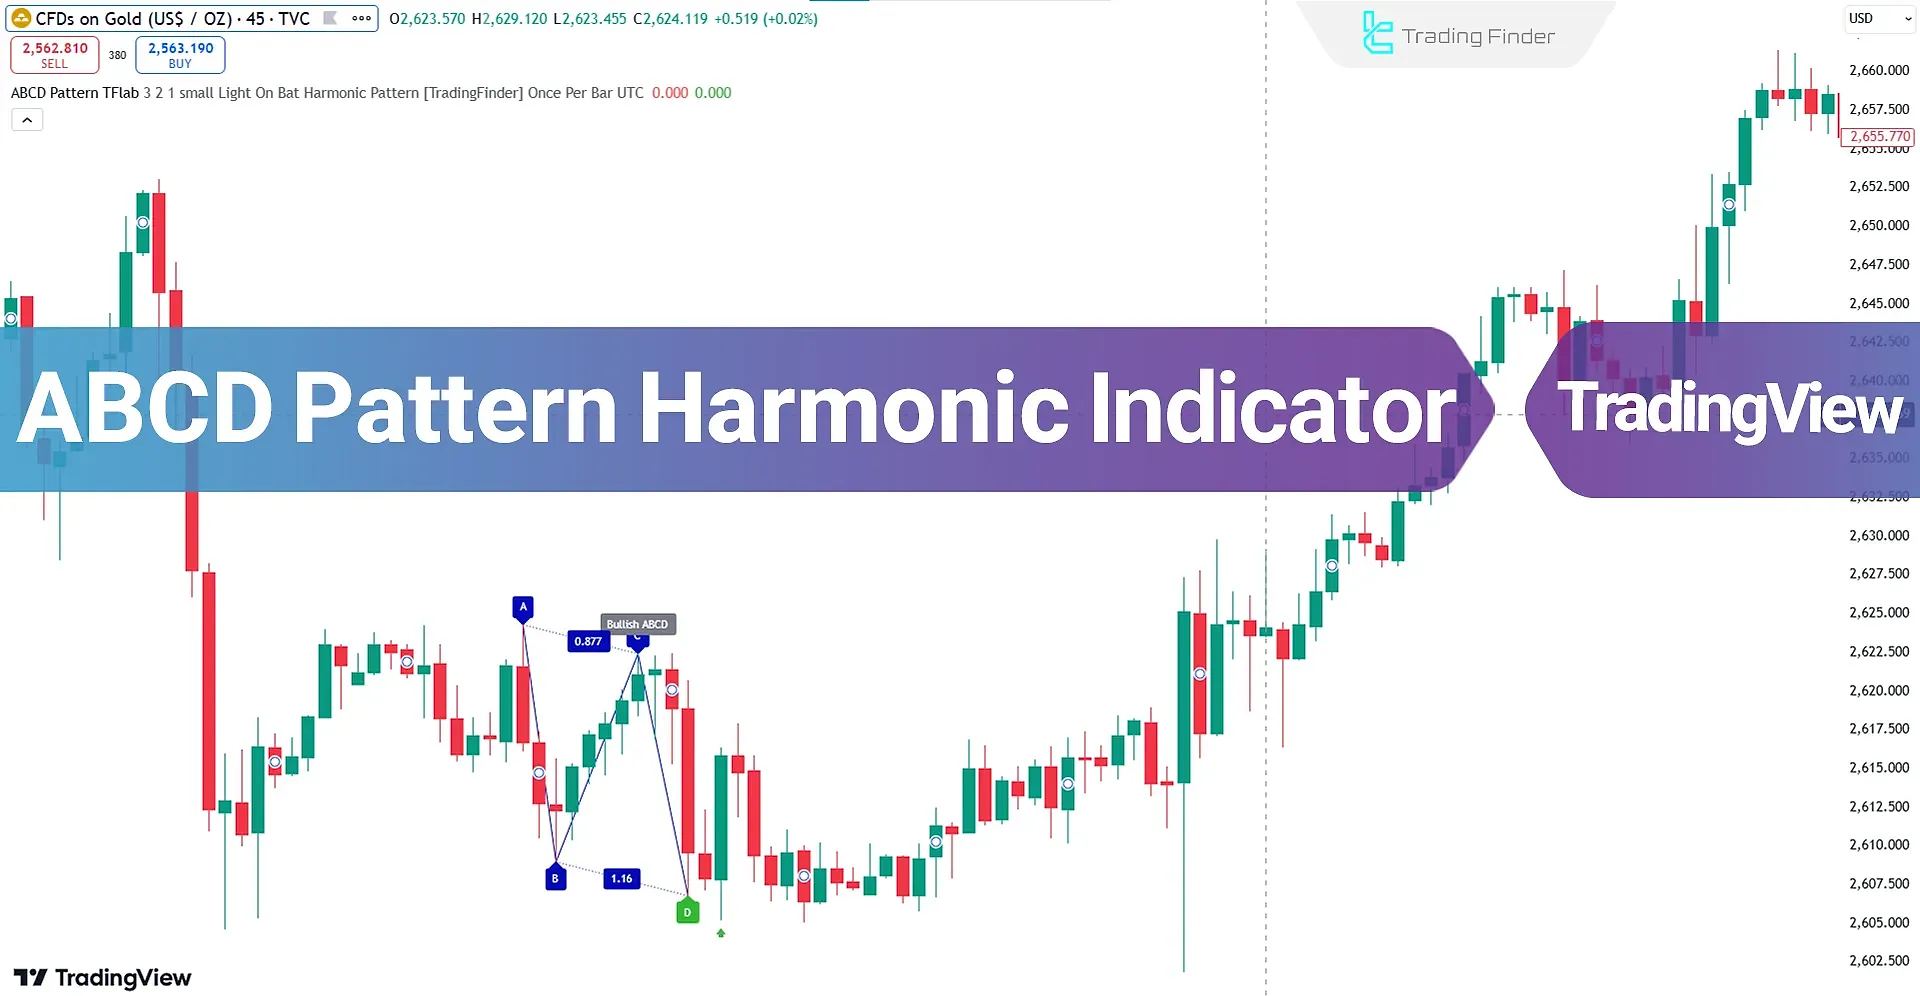
The ABCD Harmonic Pattern is one of the technical analysis tools available in theTradingView indicators, used to identify potential price reversal points. This pattern consists of four key points, named A, B, C, and D.
In this structure, the two waves AB and CD move in the same direction, while wave BC forms a corrective move in the opposite direction.

A bullish signal in this indicator is displayed with a green arrow, and the sell entry signal is indicated by a red arrow.
Indicator Table
Indicator Categories: | Signal & Forecast Tradingview Indicators Harmonic Tradingview Indicators Chart & Classic Tradingview indicators |
Platforms: | Trading View Indicators |
Trading Skills: | Intermediate |
Indicator Types: | Reversal Tradingview Indicators |
Timeframe: | Multi-Timeframe Tradingview Indicators |
Trading Style: | Intraday Tradingview Indicators |
Trading Instruments: | TradingView Indicators in the Forex Market Cryptocurrency Tradingview Indicators Forward Tradingview Indicators Share Stocks Tradingview Indicators |
Indicator at a Glance
The ABCD Harmonic Pattern is based on Fibonacci ratios and accurately identifies Potential Reversal Zones (PRZ).
In this pattern, point C usually retraces between 0.382 and 0.886 (Fibonacci numbers) of wave AB, representing the correction of wave BC. Then, wave CD, as the final part of the pattern, continues to point D.
This wave is accompanied by Fibonacci extensions between 1.13 and 2.618 of wave BC. Ultimately, point D is recognized as the price reversal zone. After identifying these zones, the indicator issues trade entry signals.
Indicator in an Uptrend
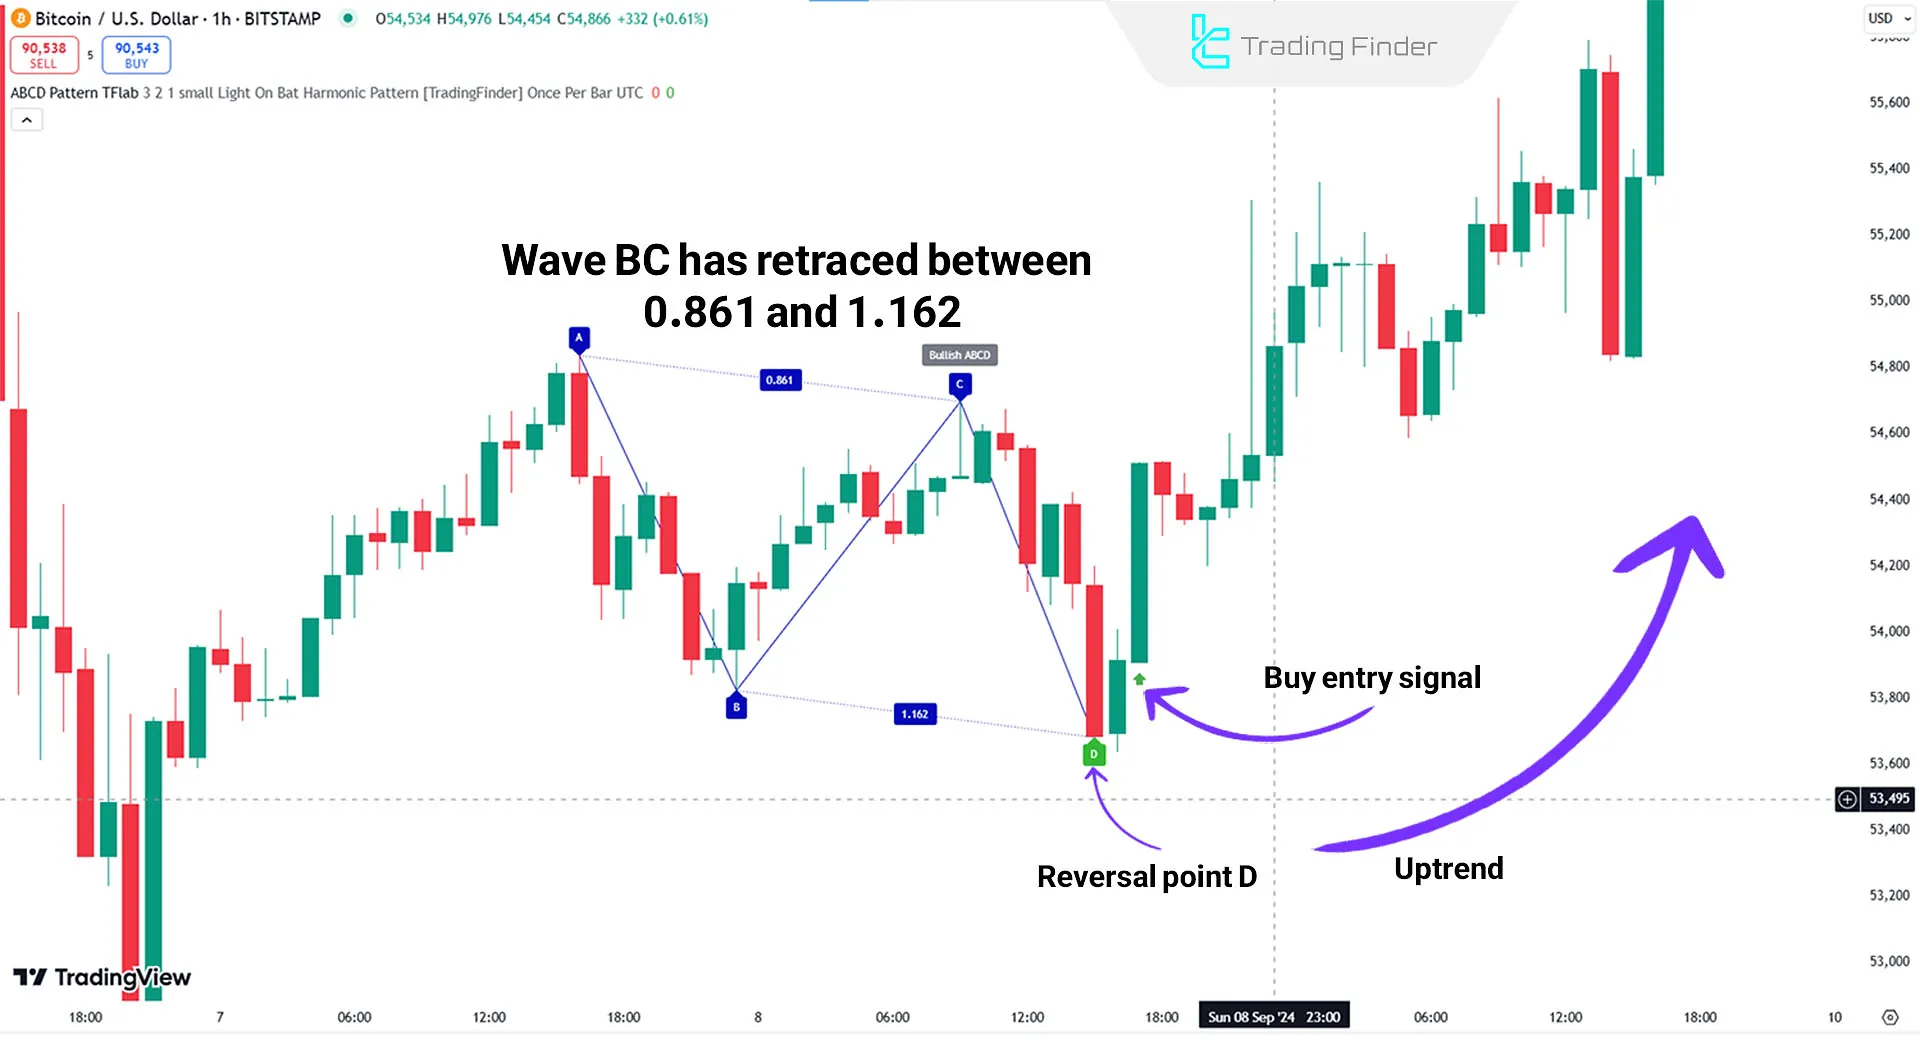
In the 1-hour Bitcoin (BTC) chart, the indicator initially identifies the bearish wave AB, followed by the corrective bullish wave BC, which covers a range between 0.861 and 1.162 of wave AB.
After wave BC ends, the bearish wave CD begins, and the price reaches point D. Upon identifying this zone, the indicator issues a Buy entry signal.

Indicator in a Downtrend
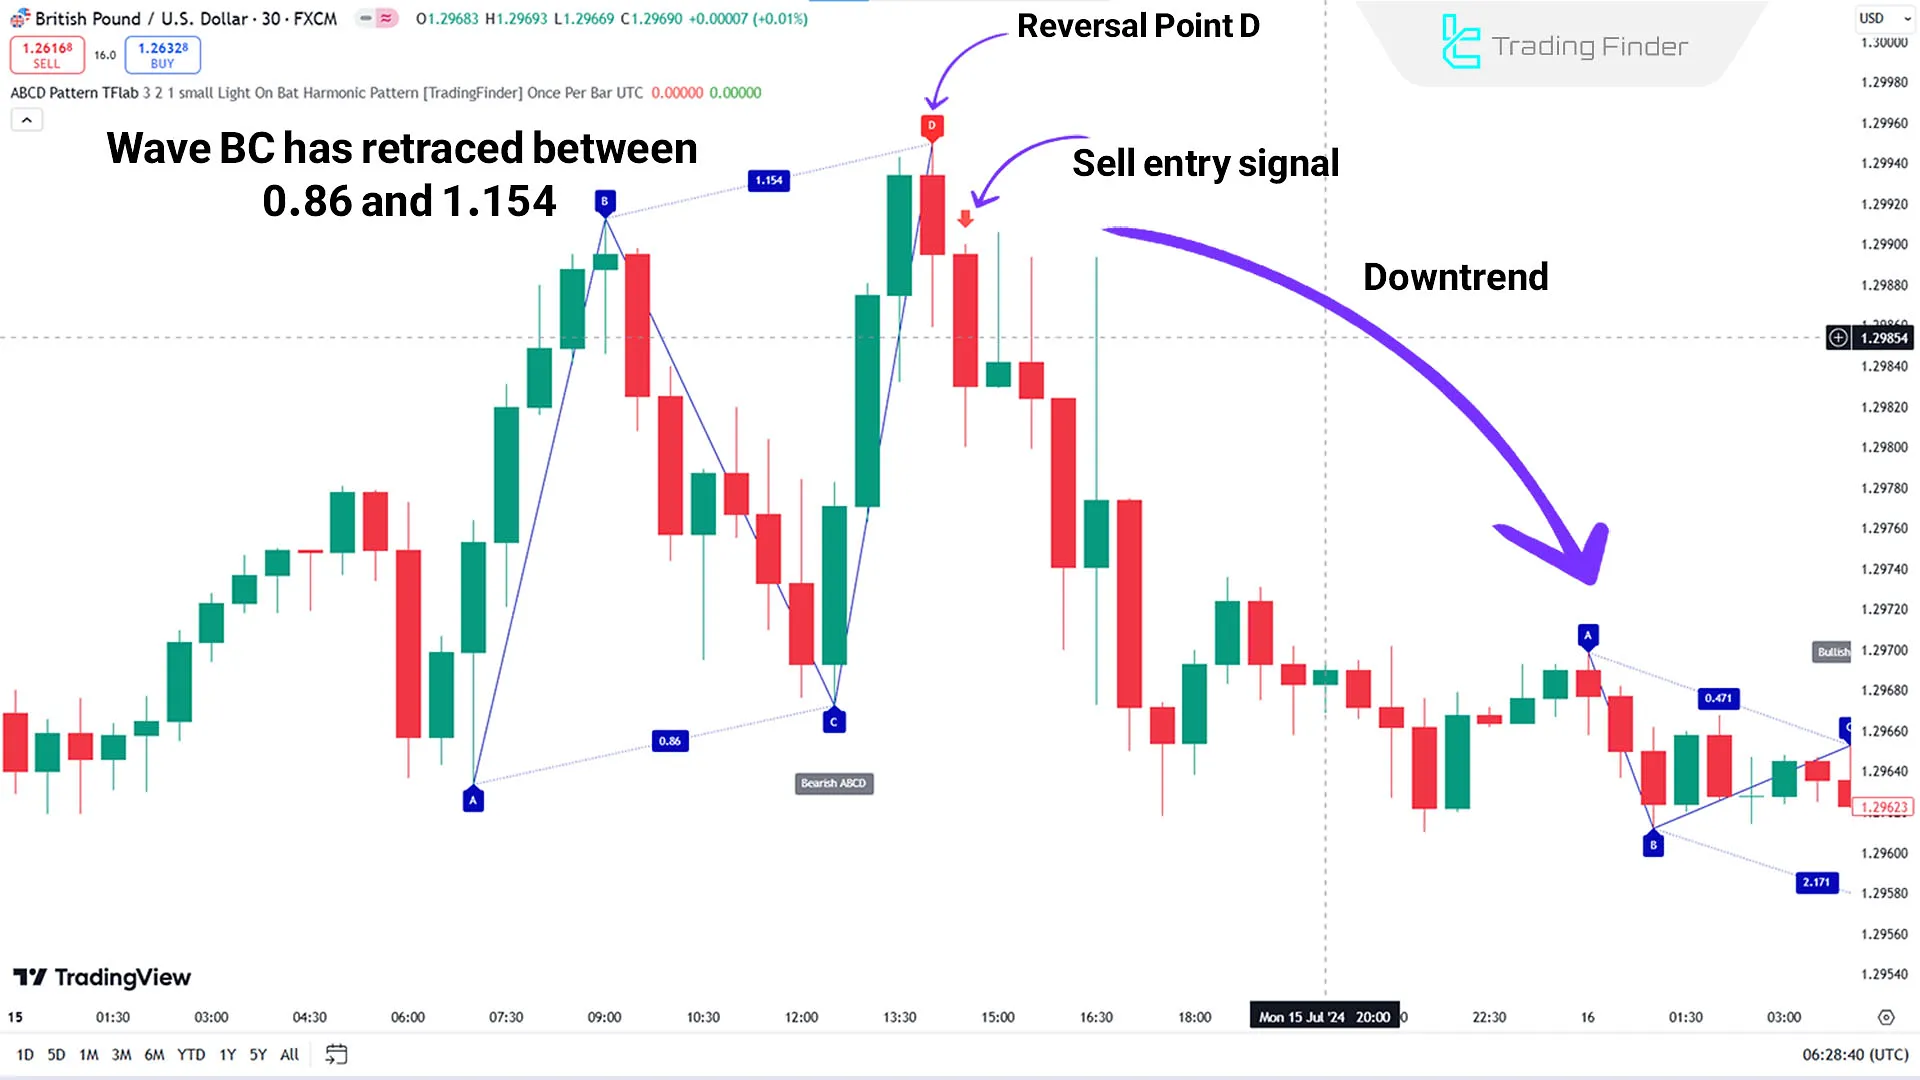
The price first forms the bullish wave AB in the 30-minute price chart of the GBP/USD currency pair. Then, wave BC moves downward, retracing between 0.86 and 1.154 of wave AB.
Subsequently, wave CD forms upward, reaching point D. Point D is the PRZ (Potential Reversal Zone), where the price will likely reverse downward.
At this point, the indicator identifies the zones and displays a Sell entry signal to traders.

Indicator Settings

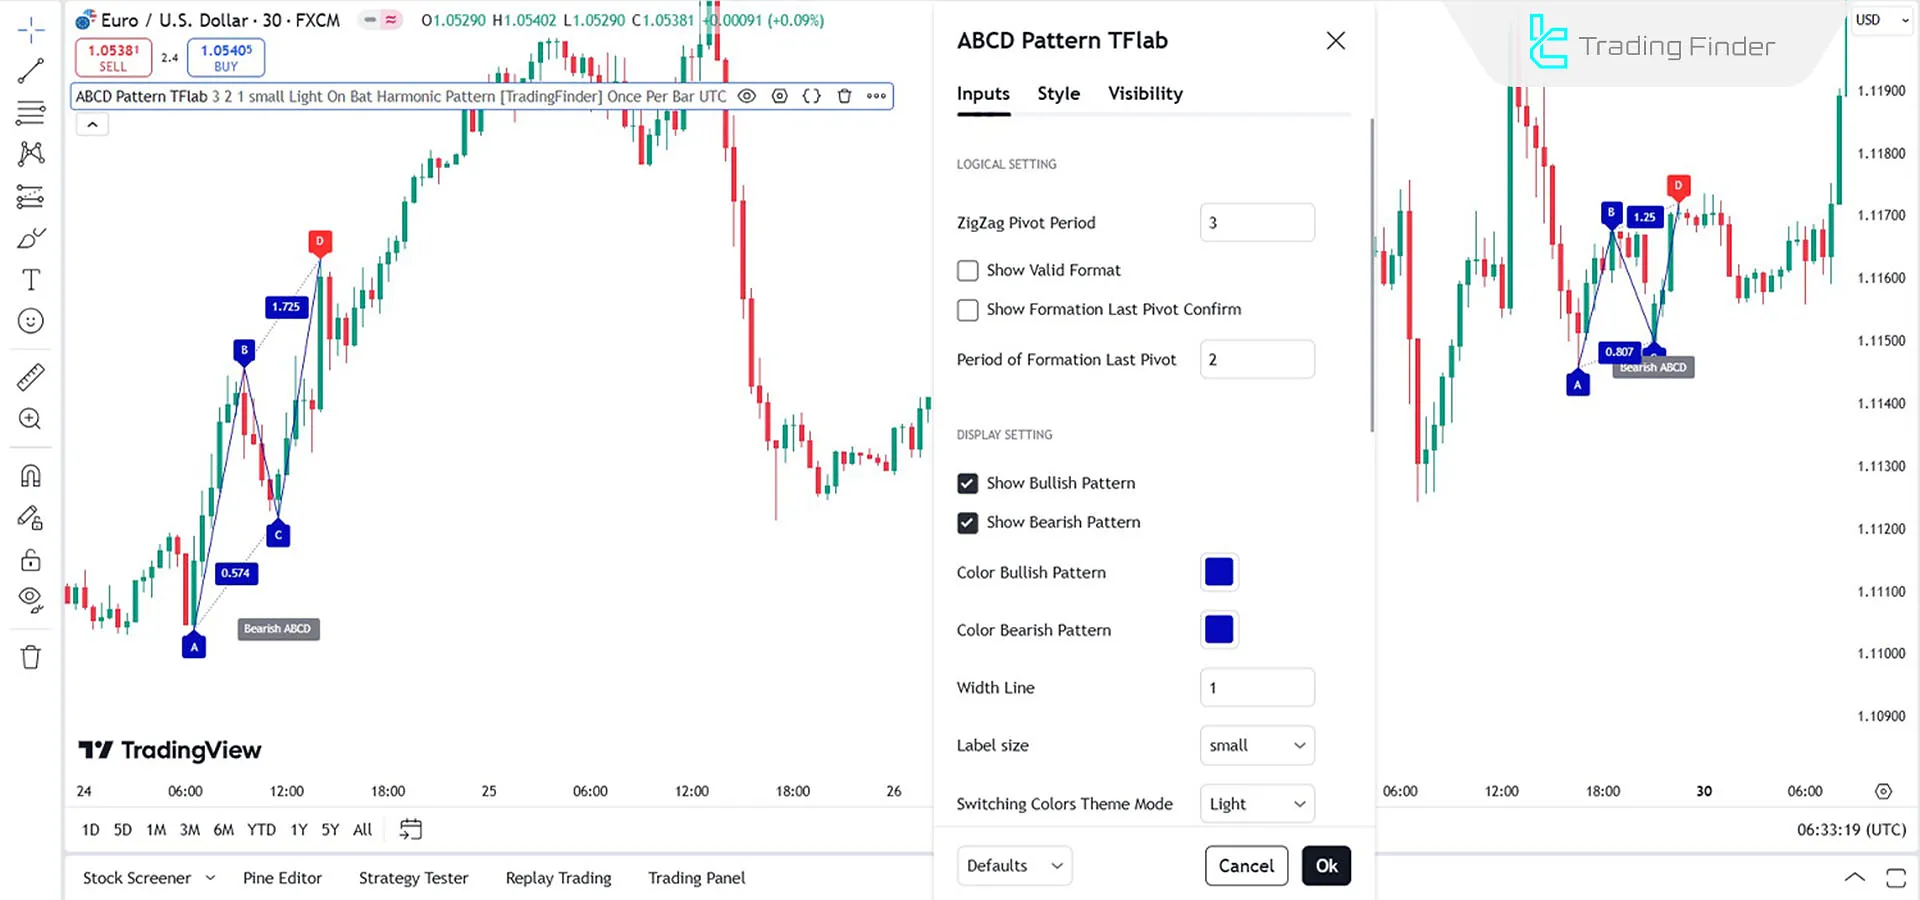
- ZigZag Pivot Period: The default pivot calculation period for ZigZag is set to 3
- Show Valid Format: Display only valid patterns
- Show Formation Last Pivot Confirm: Show confirmation of the last pivot formation
- Period of Formation Last Pivot: The default value for the last pivot formation is
- Show Bullish Pattern: Display a bullish pattern
- Show Bearish Pattern: Display bearish pattern
- Color Bullish Pattern: The default bullish pattern color is blue
- Color Bearish Pattern: The default bearish pattern color is red
- Width Line: Default line thickness is 1
- Label Size: Text label size
- Switching Colors Theme Mode: Chart background theme
- Alert: Alert notification when a pattern forms
- Alert Name: Name of the alert
- Message Frequency: Custom message content
- Show Alert Time by Time Zone: Display alert time based on the time zone
Conclusion
The ABCD Harmonic Pattern Indicator, one of the harmonic pattern indicators in TradingView, is an advanced tool designed to automatically detect ABCD harmonic patterns and identify potential reversal zones (PRZ).
This indicator uses Fibonacci ratios for high-accuracy identification of bullish and bearish patterns.
It also allows customization of colors, line thickness, and label sizes for better visualization. Traders can use this tool to analyze reversal points and make informed trading decisions.
ABCD Harmonic Pattern indicator TradingView PDF
ABCD Harmonic Pattern indicator TradingView PDF
Click to download ABCD Harmonic Pattern indicator TradingView PDFWhat is the ABCD Harmonic Pattern Indicator?
It is an indicator that automatically identifies harmonic ABCD patterns and displays potential price reversal zones (PRZ) on the chart.
How does this indicator provide entry or exit signals?
Bullish signals are displayed with a green arrow, indicating the right time for a Buy entry. Bearish signals are displayed with a red arrow suitable for a Sell entry.


