TradingView
MetaTrader4
MetaTrader5
The Pattern Alternative Shark Harmonic Indicator is one of the efficient tools in TradingView Indicators. This indicator allows traders to automatically identify harmonic patterns and the well-known Shark pattern on the price chart.
Due to the complexity of the Shark harmonic patterns and the difficulty of manually identifying them precisely, this indicator serves as a valuable tool for both professional and beginner traders.

Focusing on the Shark Pattern, this indicator uses key Fibonacci ratios, including 0.886, 1.13, and 1.618, to precisely identify patterns.
Indicator Table
Indicator Categories: | Signal & Forecast Tradingview Indicators Harmonic Tradingview Indicators Chart & Classic Tradingview indicators |
Platforms: | Trading View Indicators |
Trading Skills: | Intermediate |
Indicator Types: | Reversal Tradingview Indicators |
Timeframe: | Multi-Timeframe Tradingview Indicators |
Trading Style: | Intraday Tradingview Indicators |
Trading Instruments: | TradingView Indicators in the Forex Market Cryptocurrency Tradingview Indicators Forward Tradingview Indicators Share Stocks Tradingview Indicators |
Overview of the Indicator
The Alternative Shark Harmonic Pattern consists of five key points defining the pattern's structure. The movement begins at point X, with the price moving from point X to point A, marking the end of the first wave of the pattern.
After this wave, the price enters a corrective phase and reaches point B. This correction is usually between 0.382 and 0.618 of the XA wavelength.
Next, the price moves from point B to point C, an extension wave that typically measures between 1.13 and 1.618 of the AB wavelength.
This wave plays a crucial role in forming the overall structure of the pattern. Finally, the price reaches point D, the Potential Reversal Zone (PRZ).
Indicator in an Uptrend
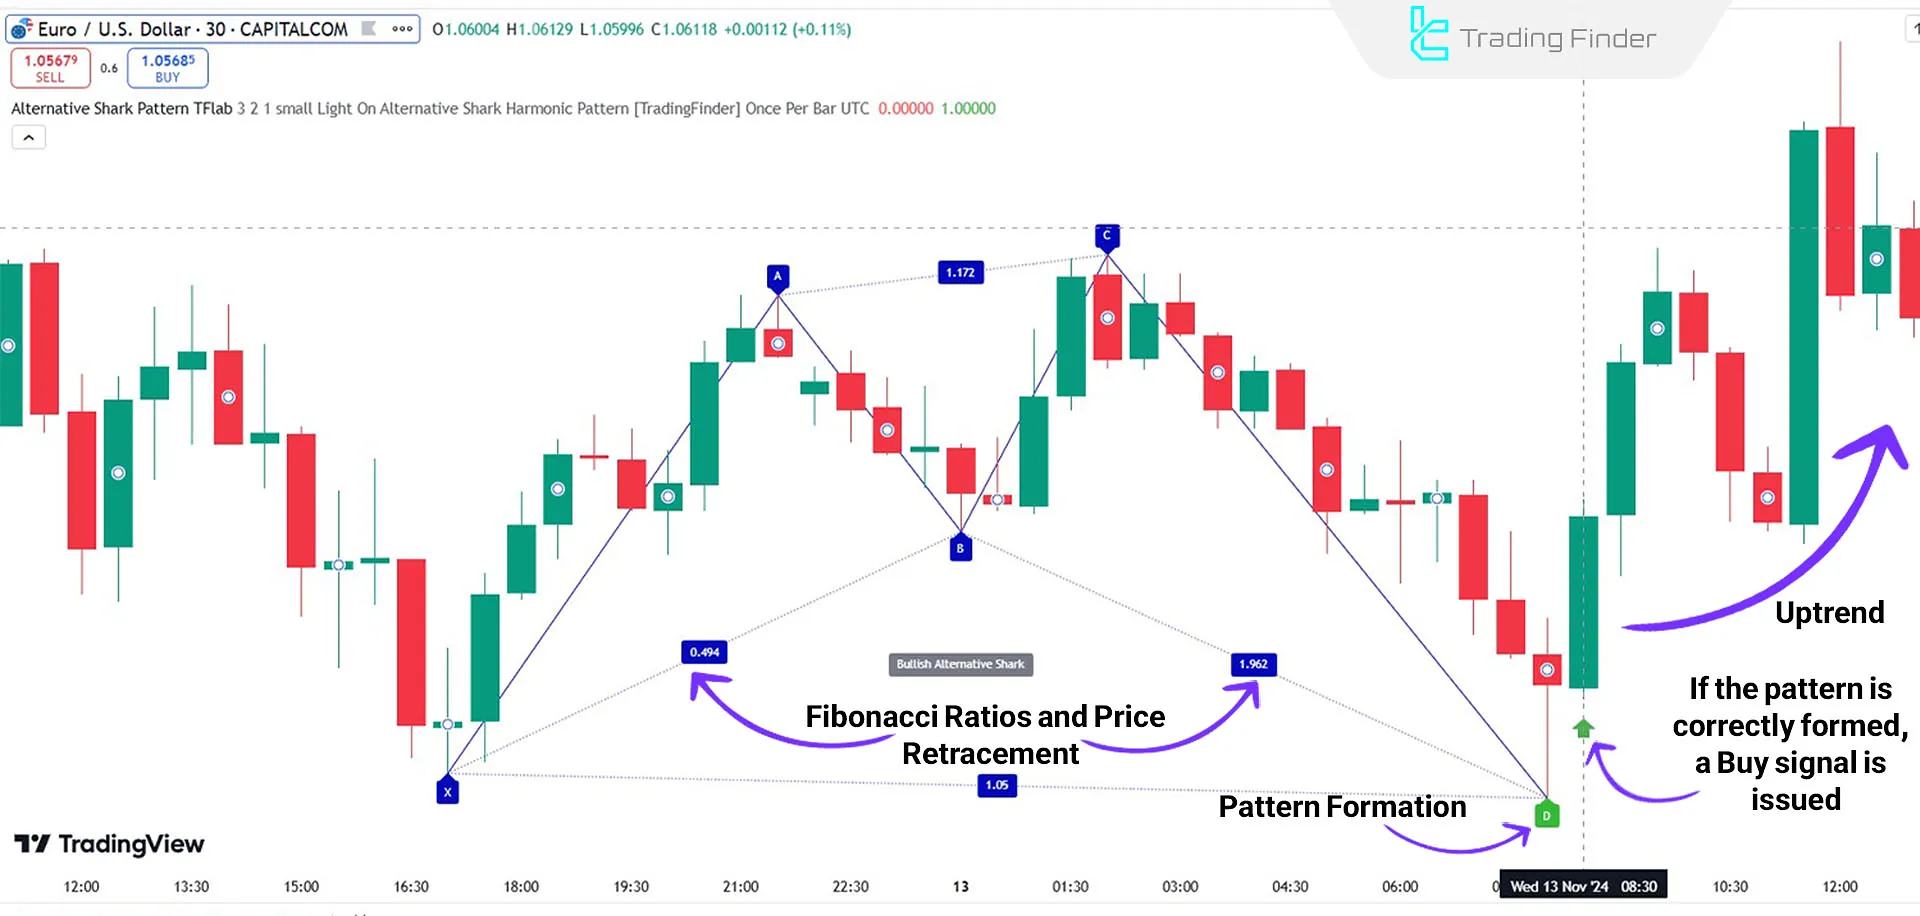
The price chart of the EUR/USD currency pair in the 30-minute timeframe illustrates the formation of the Shark Harmonic Pattern at the end of a downtrend.
Upon completion at point D and confirmation, this pattern serves as a strong signal for a trend reversal.
After the pattern is fully formed, the price reverses from the downtrend, and a buy signal (green arrow) is issued for entry into a long trade.

Indicator in a Downtrend
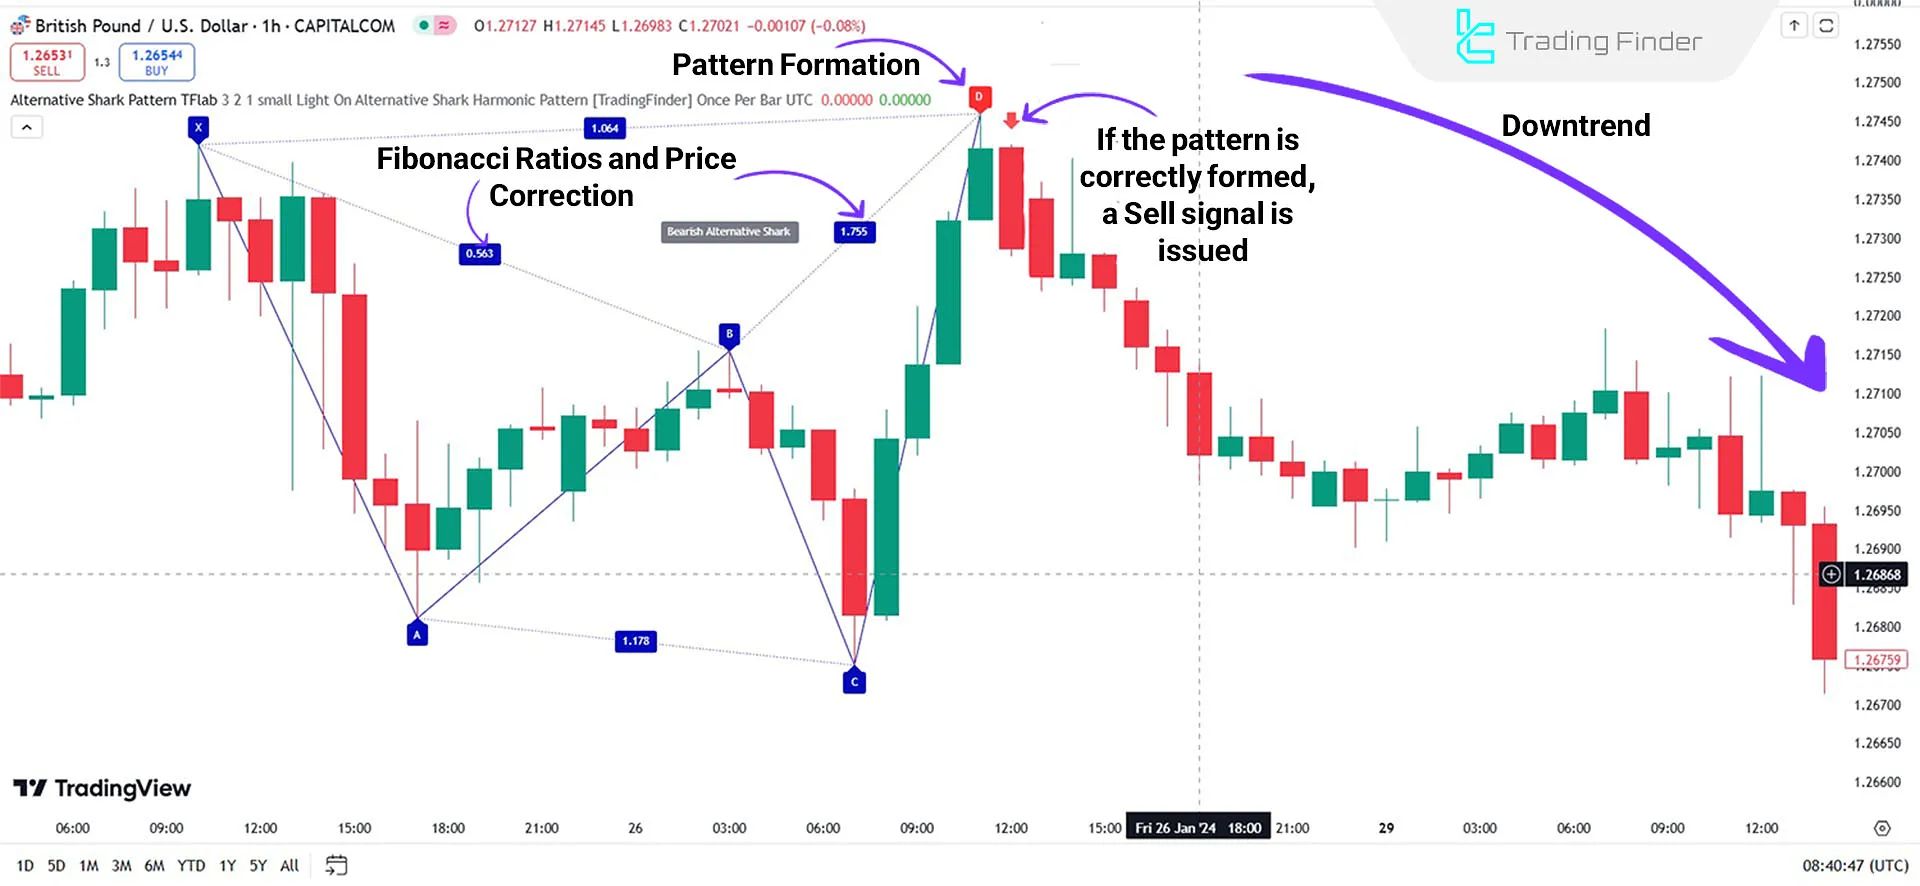
The price chart of the GBP/USD currency pair in the 1-hour timeframe shows the formation of the Shark Harmonic Pattern after the end of an uptrend.
Upon completion of the pattern, it acts as a key reversal point. When the price returns to point D, the reversal is confirmed, and the indicator issues a sell signal (red arrow) for entering a short trade.

Indicator Settings

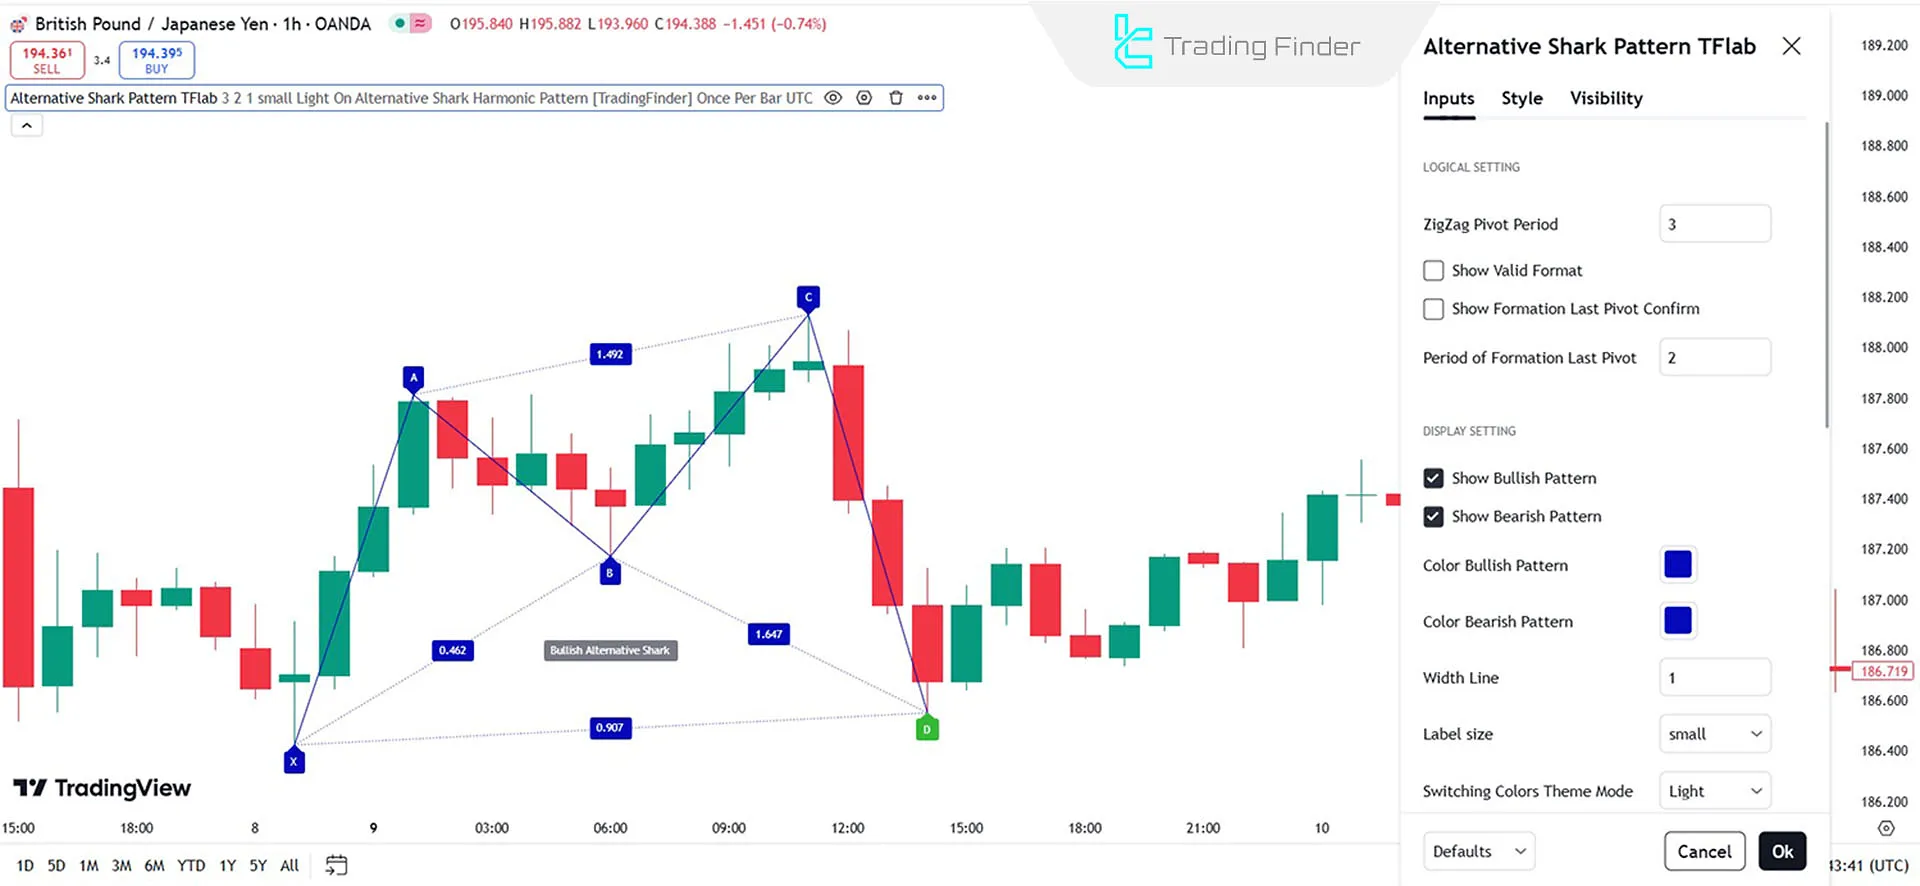
- ZigZag Pivot Period: The period for calculating pivot points (default set to 3);
- Show Valid Format: Enable/disable the display of valid patterns;
- Show Formation Last Pivot Confirm: Enable/disable the display of the last pivot confirmation;
- Period of Formation Last Pivot: Period for calculating the last pivot confirmation;
- Show Bullish Pattern: Enable the display of bullish patterns;
- Show Bearish Pattern: Enable the display of bearish patterns;
- Color Bullish Pattern: Set the color for bullish patterns;
- Color Bearish Pattern: Set the color for bearish patterns;
- Width Line: Thickness of pattern lines (default set to 1);
- Label Size: Size of text labels on the chart;
- Switching Colors Theme Mode: Toggle color mode;
- Alert: Issue an alert upon pattern formation;
- Alert Name: Custom name for alerts;
- Message Frequency: Send a message upon pattern formation;
- Show Alert Time by Time Zone: Display alert time based on time zone.
Conclusion
The Alternative Shark Harmonic Pattern Indicator falls under the category of Harmonic Pattern Indicators and is used to identify the Alternative Shark Harmonic Pattern and price reversal zones in financial markets.
Utilizing Fibonacci ratios, this indicator pinpoints key levels where the probability of trend reversal or trend continuation is higher.
By graphically displaying harmonic patterns on the chart, traders can utilize the indicator's signals to profit.
Alternative Shark Harmonic Pattern TradingView PDF
Alternative Shark Harmonic Pattern TradingView PDF
Click to download Alternative Shark Harmonic Pattern TradingView PDFWhat is the Shark Harmonic Pattern Indicator?
The Shark Harmonic Pattern Indicator is an advanced technical analysis tool that accurately identifies pattern points and calculates Fibonacci ratios to determine potential reversal zones (PRZ) for trade entry or exit.
How does the Shark Pattern work?
This pattern identifies price reversal zones using key Fibonacci ratios (such as 0.886, 1.13, and 1.618). A trend reversal signal is issued when the price reaches point D and the pattern is confirmed.


