


TradingView
MetaTrader4
MetaTrader5
The Auto AI Trendlines Indicator is an advanced technical analysis tool in TradingView that uses specialized algorithms to identify market trends.
This indicator plots uptrends with green lines and downtrends with red lines, helping traders gauge market direction.
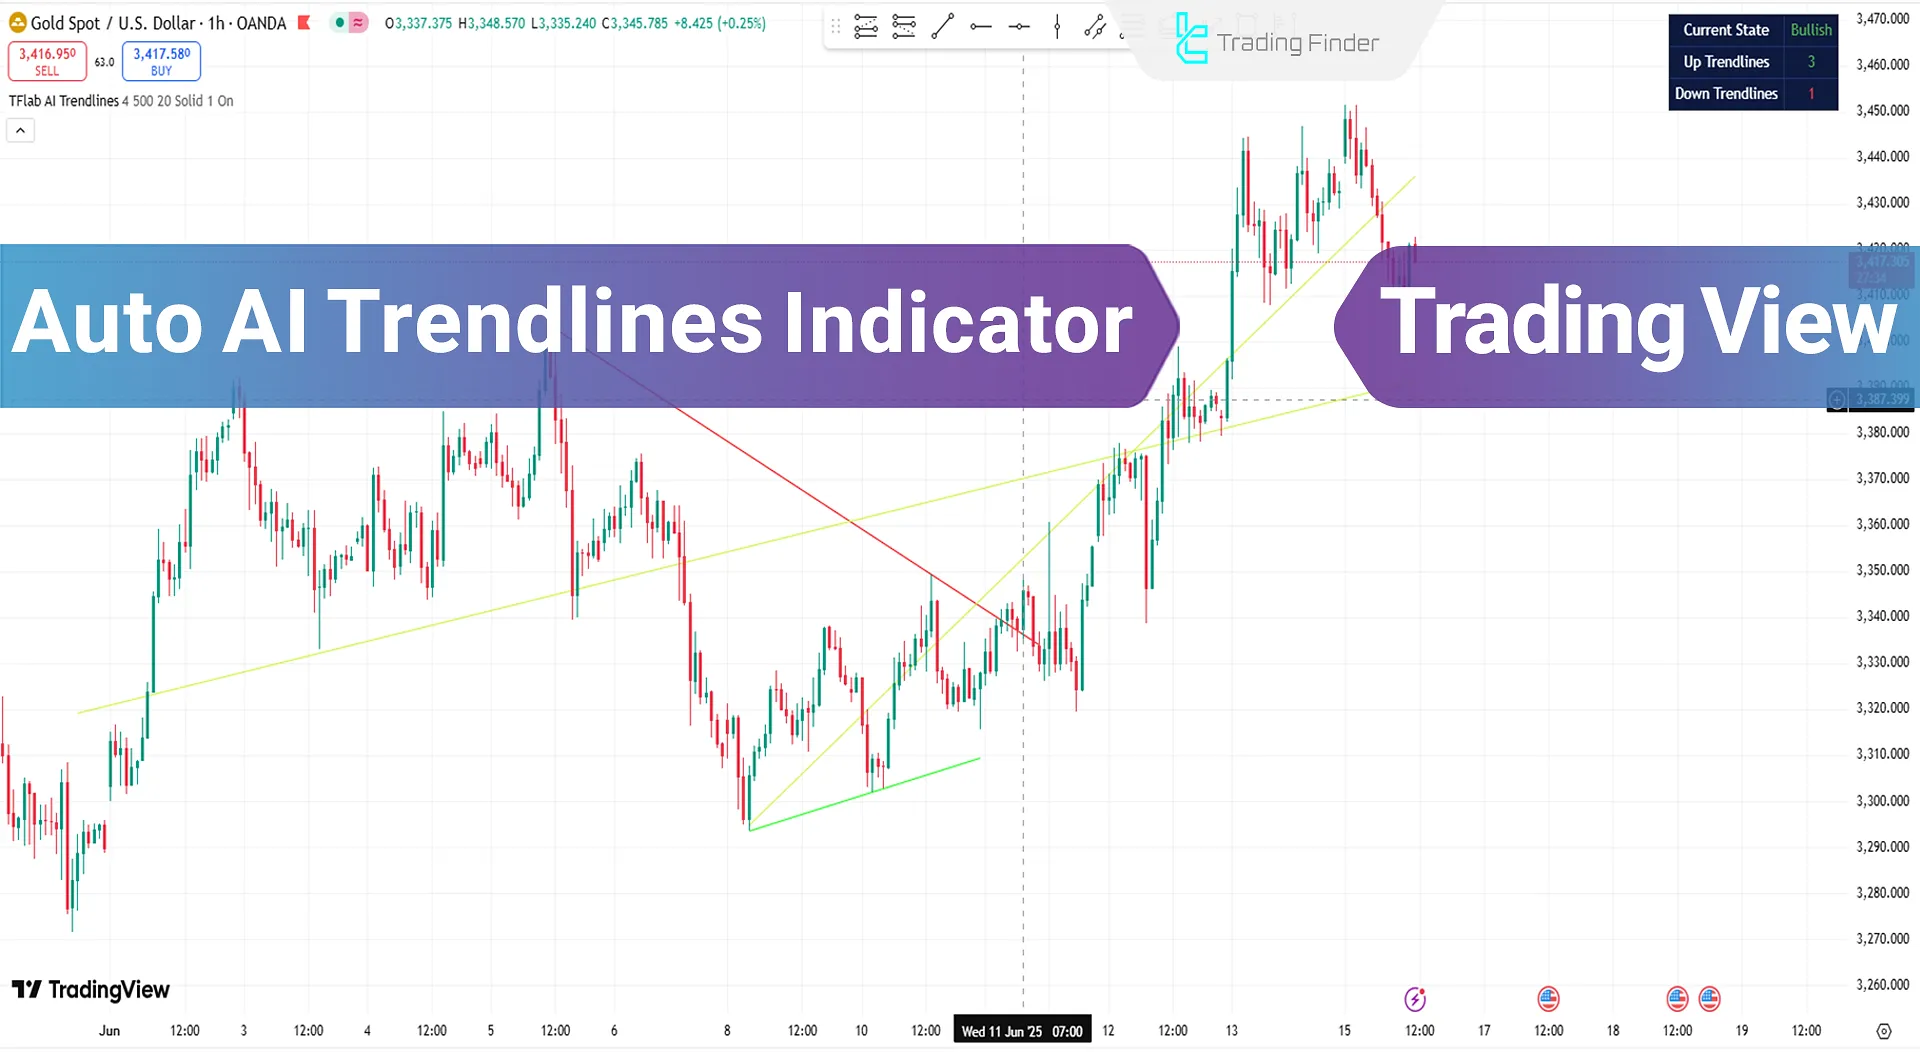
Traders can use the market status panel to enter buy positions during uptrends or sell positions during downtrends.
Auto AI Trendlines Indicator Overview Table
Below are the key specifications of the indicator:
Indicator Categories: | Price Action Tradingview Indicators Support & Resistance Tradingview Indicators Trading Assist Tradingview Indicators |
Platforms: | Trading View Indicators |
Trading Skills: | Intermediate |
Indicator Types: | Leading Tradingview Indicators Entry & Exit TradingView Indicators |
Timeframe: | Multi-Timeframe Tradingview Indicators |
Trading Style: | Intraday Tradingview Indicators Day Trading Tradingview Indicators Scalper Tradingview Indicators |
Trading Instruments: | TradingView Indicators in the Forex Market Stock Tradingview Indicators Indices Tradingview Indicators Share Stocks Tradingview Indicators |
Indicator at a Glance
The Auto AI Trendlines Indicator provides four analytical trendlines (two for uptrends and two for downtrends), enabling deeper market analysis. Its smart algorithms predict bullish and bearish trends.
Traders can use the dedicated info panel to assess real-time market direction:
- Uptrends: Green lines indicate dynamic support and price growth channels;
- Downtrends: Red lines reflect moving resistance and price decline channels.
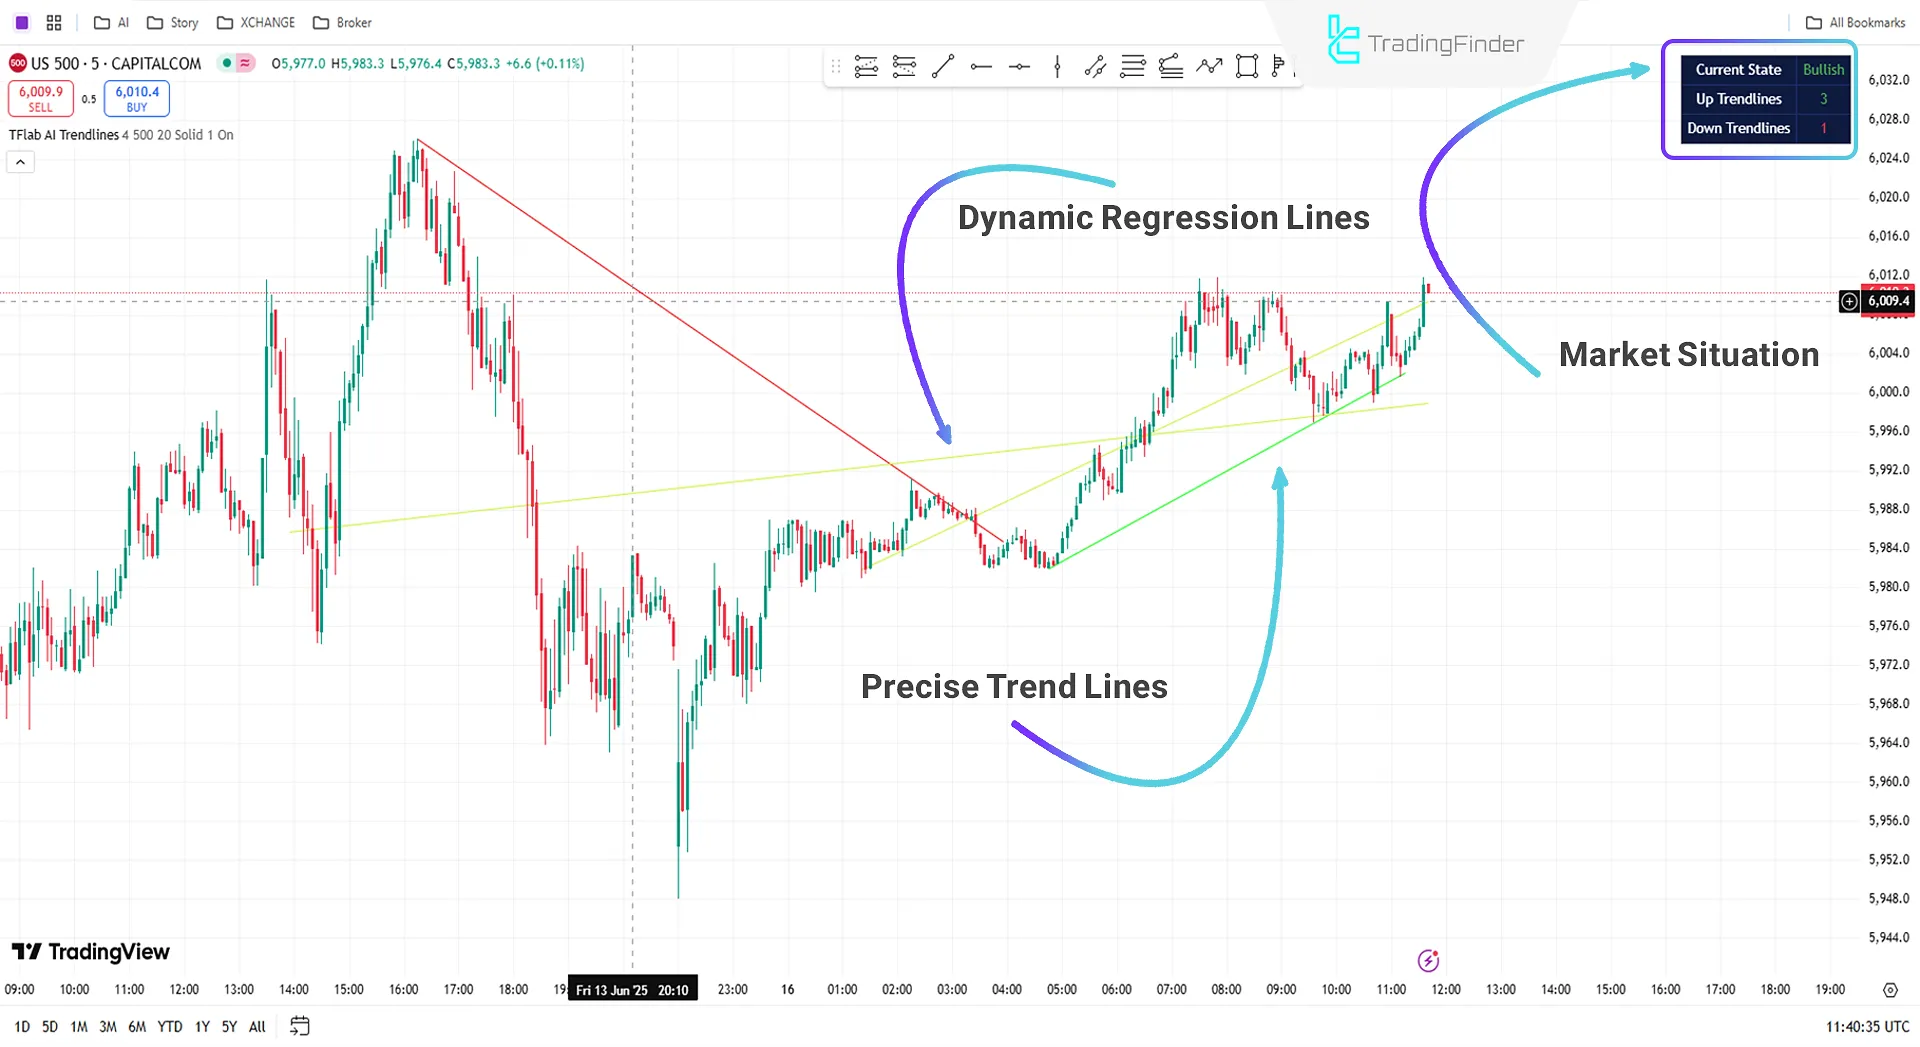
Uptrend Example
On the 5-minute chart of S&P 500, the indicator automatically draws two uptrend lines, signaling a stable bullish trend.
Traders can monitor the top-right info panel for real-time trend analysis and combine it with other technical factors to enter buy positions.
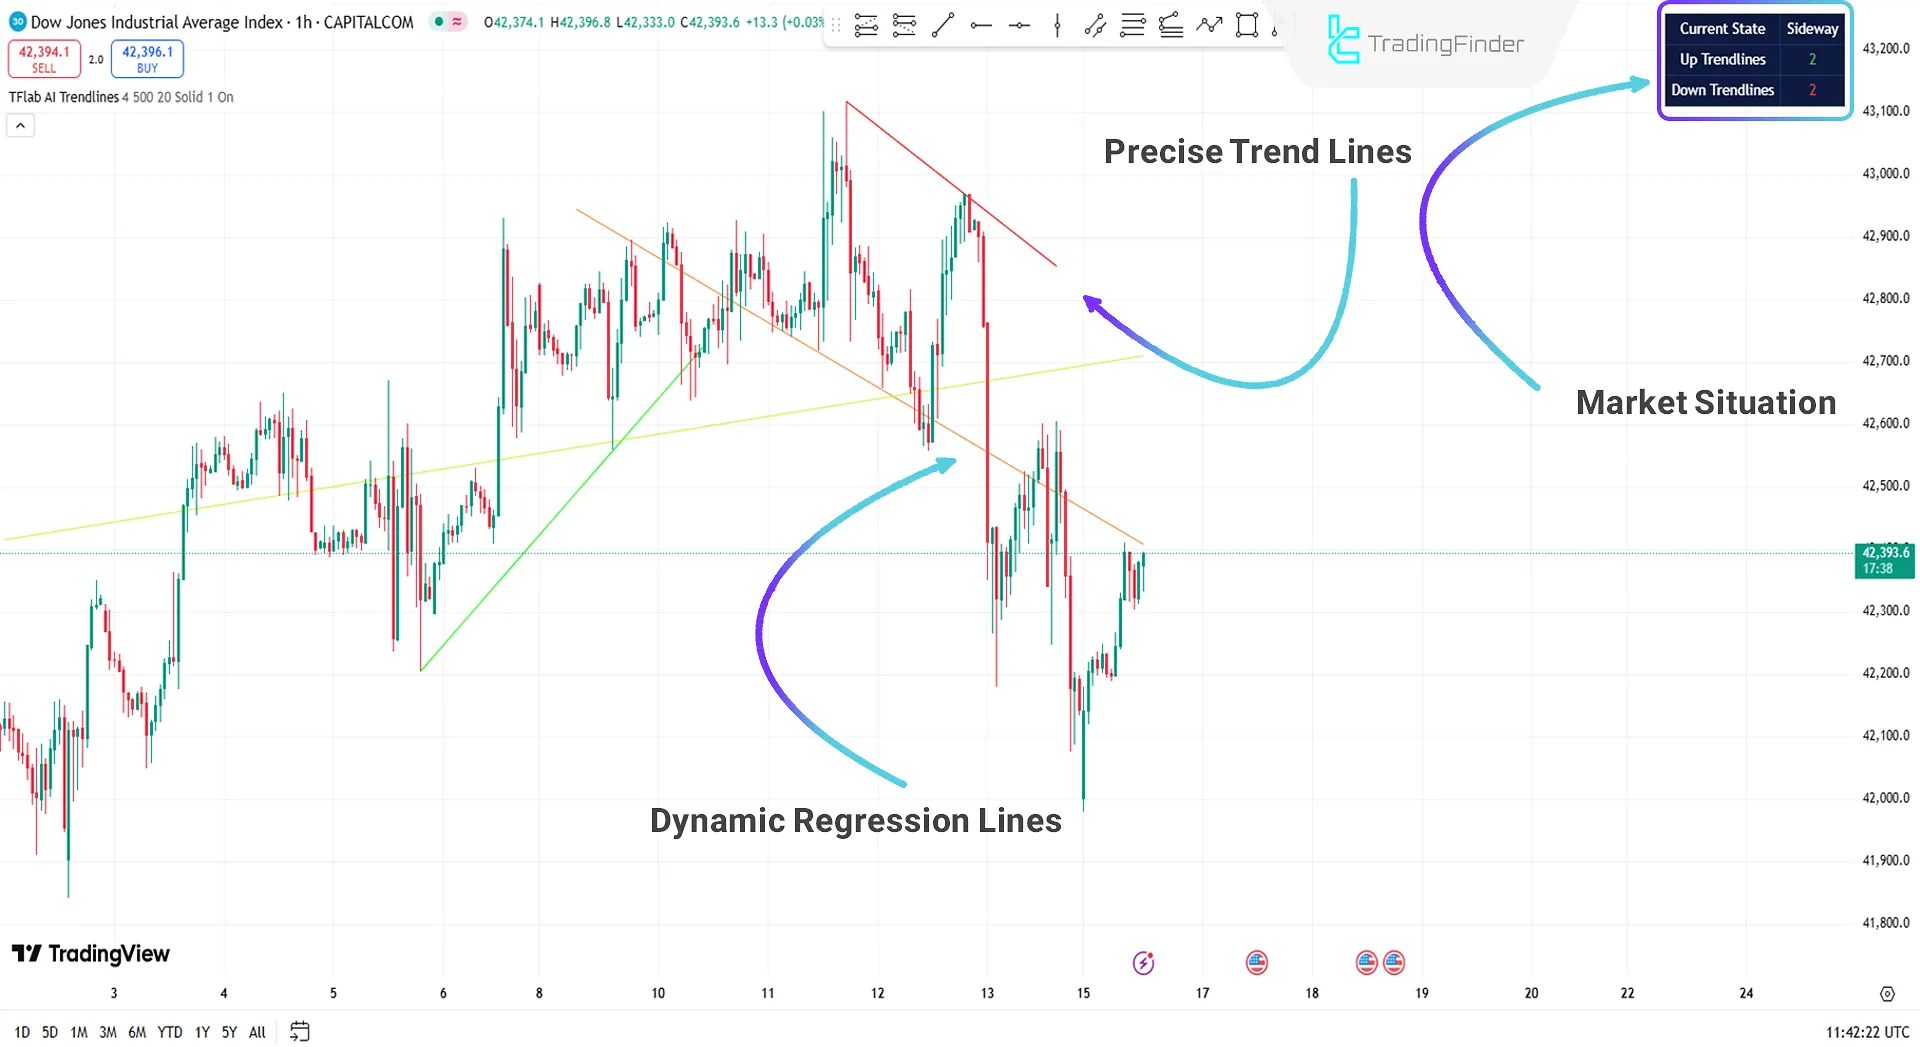
Downtrend Example
On the 1-hour chart of Dow Jones, the indicator identifies a downtrend and plots two distinct lines:
- Exact Trendlines: Based on pivot points and key levels;
- Dynamic Regression Lines: Adapt to price movements.
With confirmed bearish momentum, traders can confidently consider sell positions. The dual-line system helps track both market structure and short-term fluctuations.
Auto AI Trendlines Indicator Settings
The following section contains the settings for the AI automatic trend lines indicator:
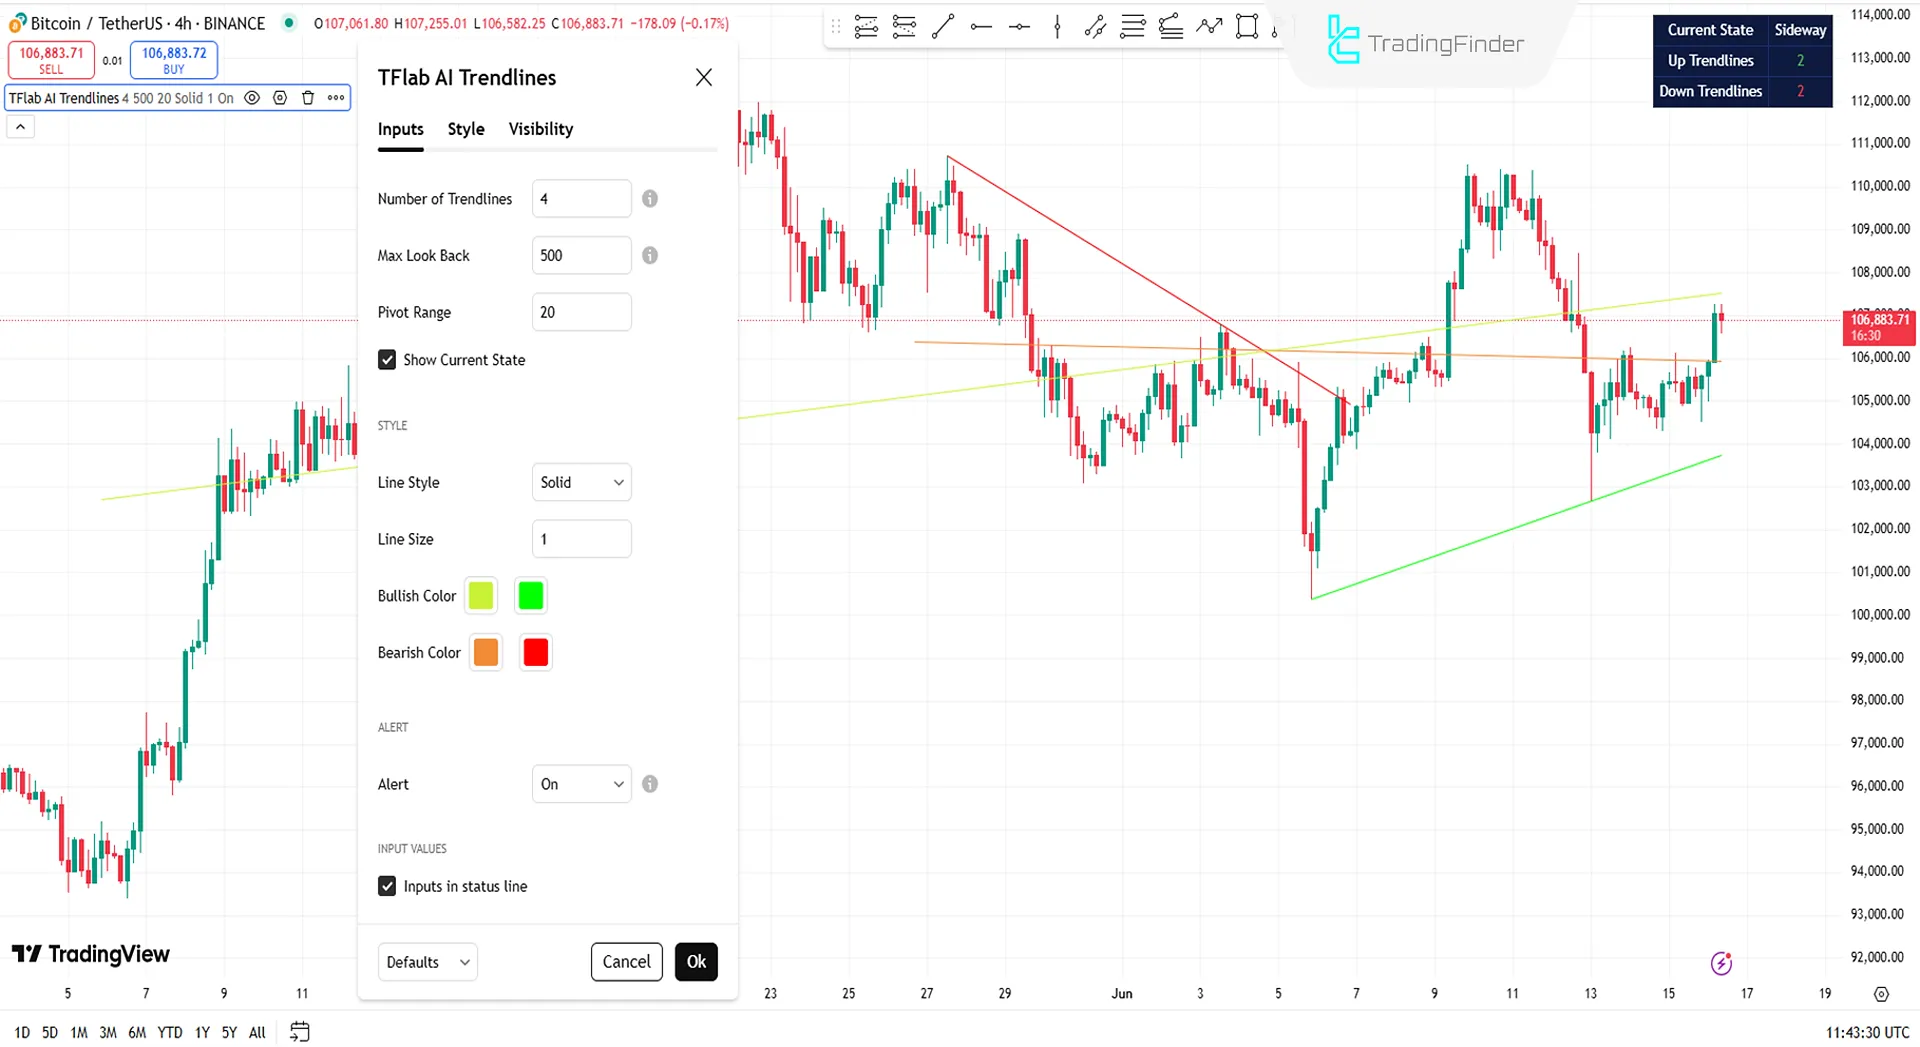
Core Settings
- Number of Trendlines: Adjusts how many lines are drawn;
- Max Look Back: Sets the candle range for trend analysis;
- Pivot Range: Defines pivot calculation scope;
- Show Current State: Toggles the market status panel.
Style & Alerts
- Line Style: Customizes line appearance;
- Line Size: Adjusts line thickness;
- Bullish Color: Sets uptrend line color (default: green);
- Bearish Color: Sets downtrend line color (default: red);
- Alert: Enables/disables notifications;
- Inputs in Status Line: Shows/hides input values.
Conclusion
The Auto AI Trendlines Indicator combines smart algorithms and dynamic market analysis to detect trends. It plots:
- Dynamic Lines: Update with price fluctuations;
- Static Lines: Highlight key support/resistance levels.
Traders can use the green (bullish) or red (bearish) lines to make informed decisions. The tool also facilitates advanced trading strategies by offering multi-layered price analysis.
With real-time insights, traders can predict market reactions and capitalize on trend opportunities, making it indispensable for professionals.
Adding The Auto AI Trendlines TradingView PDF
Adding The Auto AI Trendlines TradingView PDF
Click to download Adding The Auto AI Trendlines TradingView PDFWhat does the Auto AI Trendlines Indicator do?
Automatically detects and plots trends using special algorithms:
- Uptrend: Green lines
- Downtrend: Red lines
What types of trendlines does it draw?
- Dynamic Lines: Adjust with price movements (e.g., growth/decline channels);
- Static Lines: Mark key support/resistance levels.
Is there a way we can have this for MT5?

Hello, your feedback will be forwarded to the development team. Meanwhile, you can use the popular indicators available on the site, which includes some of the best TradingView indicators.


