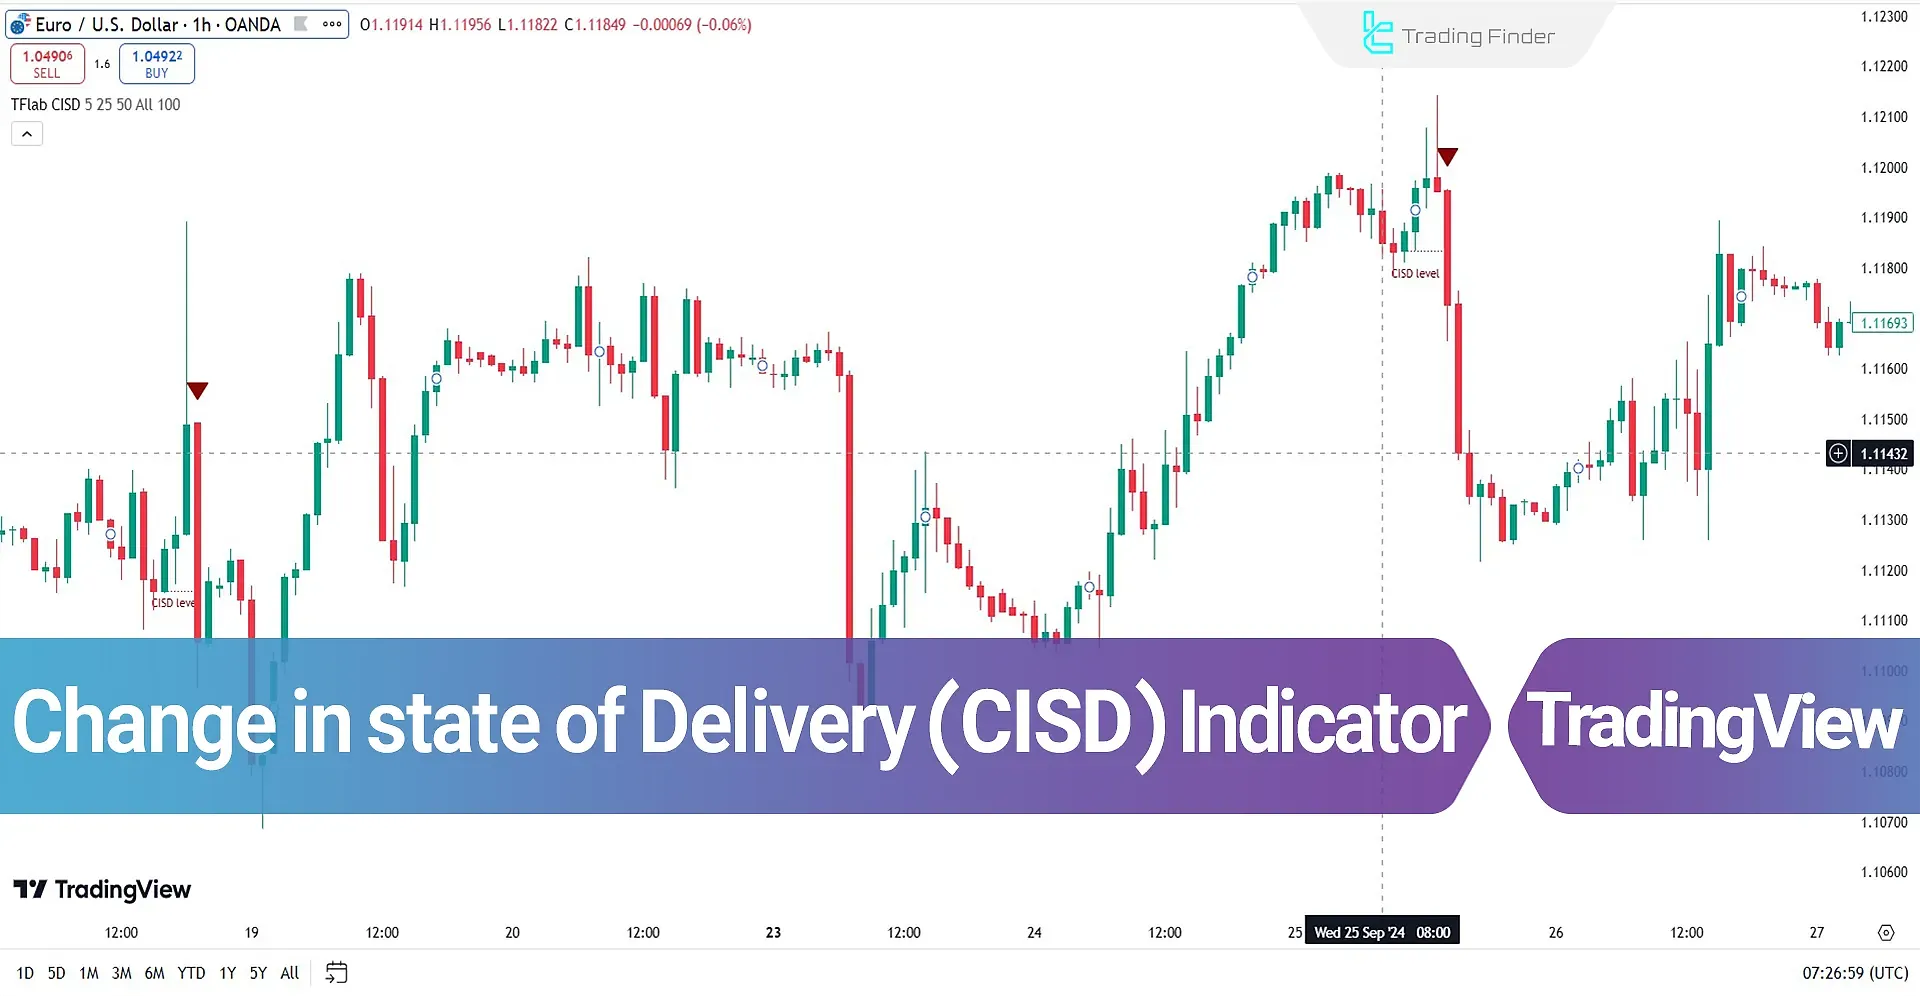
The Change in State of Delivery (CISD) indicator has been developed on TradingView indicators based on price action analysis and market structure changes.
This indicator, similar to concepts like Change of Character & Market Structure Shift (MSS & CHoCH), is applied using the ICT and Smart Money trading styles.

Upon a CISD breakout, the indicator provides buy (green arrow) or sell (red arrow) signals.
Indicator Specifications
Below is a summary of the indicator's specifications:
Indicator Categories: | ICT Tradingview Indicators Smart Money Tradingview Indicators Signal & Forecast Tradingview Indicators |
Platforms: | Trading View Indicators |
Trading Skills: | Advanced |
Indicator Types: | Reversal Tradingview Indicators |
Timeframe: | Multi-Timeframe Tradingview Indicators |
Trading Style: | Intraday Tradingview Indicators |
Trading Instruments: | TradingView Indicators in the Forex Market Cryptocurrency Tradingview Indicators Forward Tradingview Indicators |
Overview
The CISD indicator is a hybrid tool that utilizes the SFP (Swing Failure Pattern) to identify liquidity zones and price reversals.
This indicator examines the last four candlesticks, which led to a price swing and liquidity grab. Afterward, the price reverses due to liquidity absorption, marking CISD zones for traders.
CISD in Uptrend
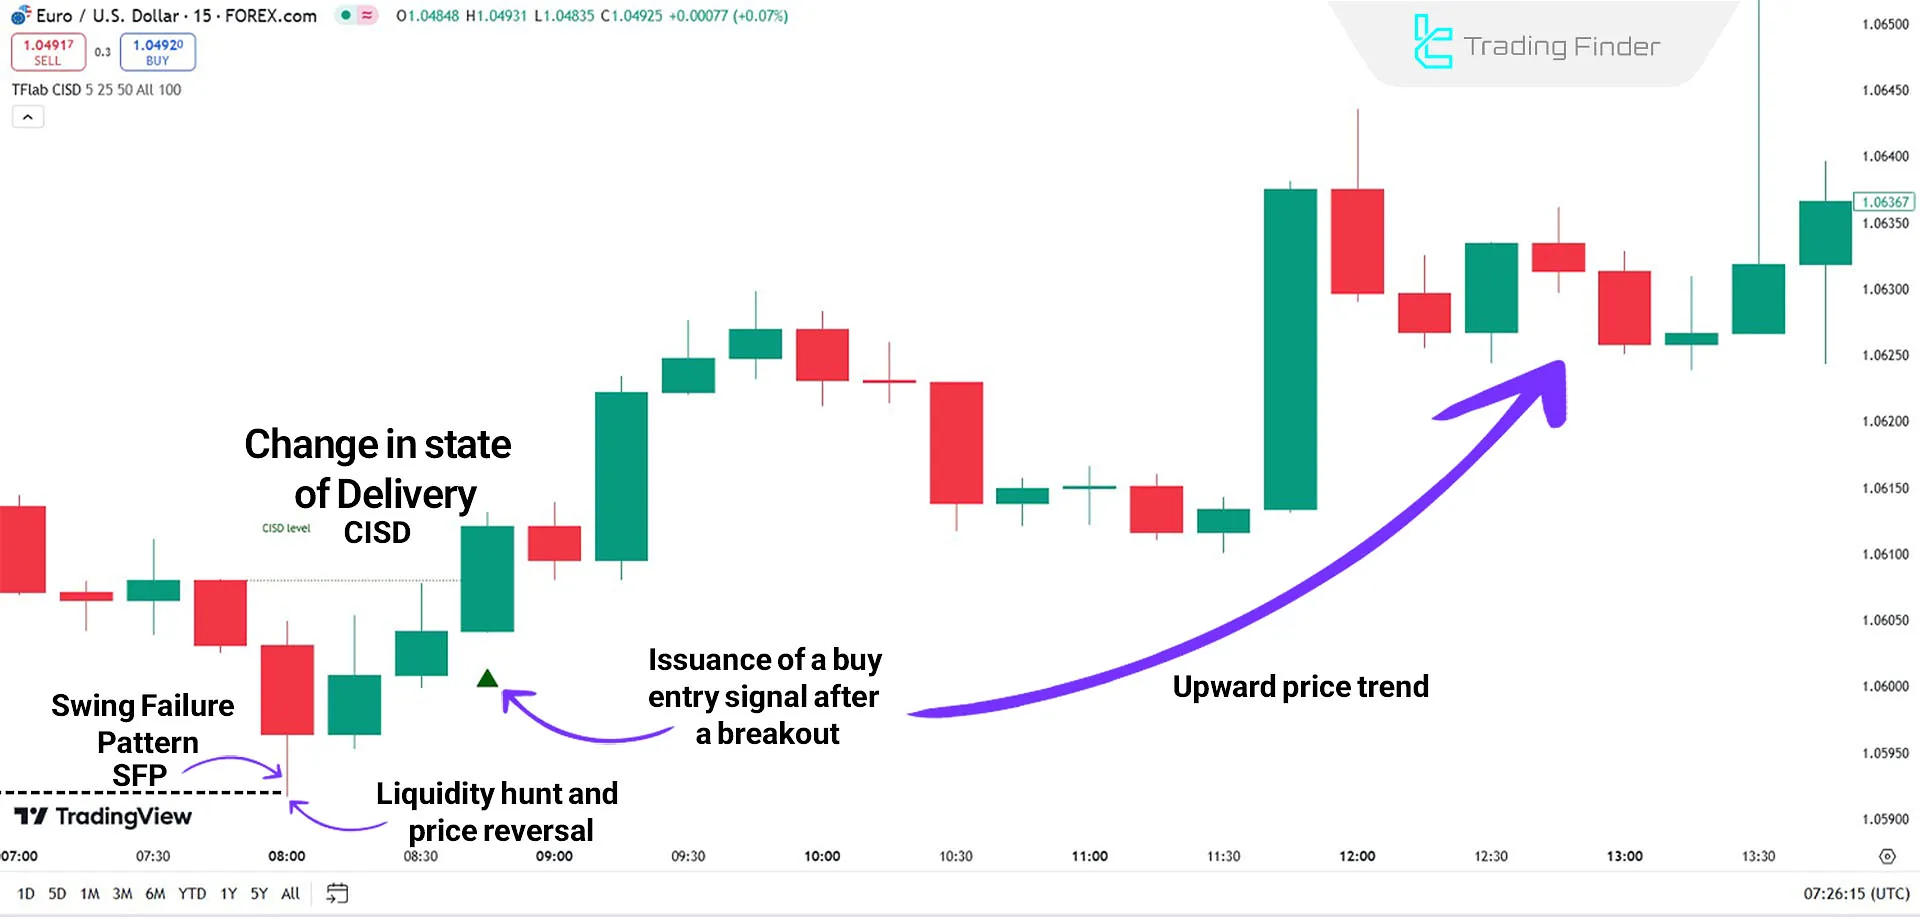
The first step to identifying a bullish CISD is to locate liquidity zones. As shown in the price chart for EUR/USD, the price reaches a liquidity zone and captures it using aSwing Failure Pattern (SFP).
After absorbing liquidity, the price changes direction, leading to a CISD breakout. Subsequently, the indicator generates a buy signal.

CISD in Downtrend
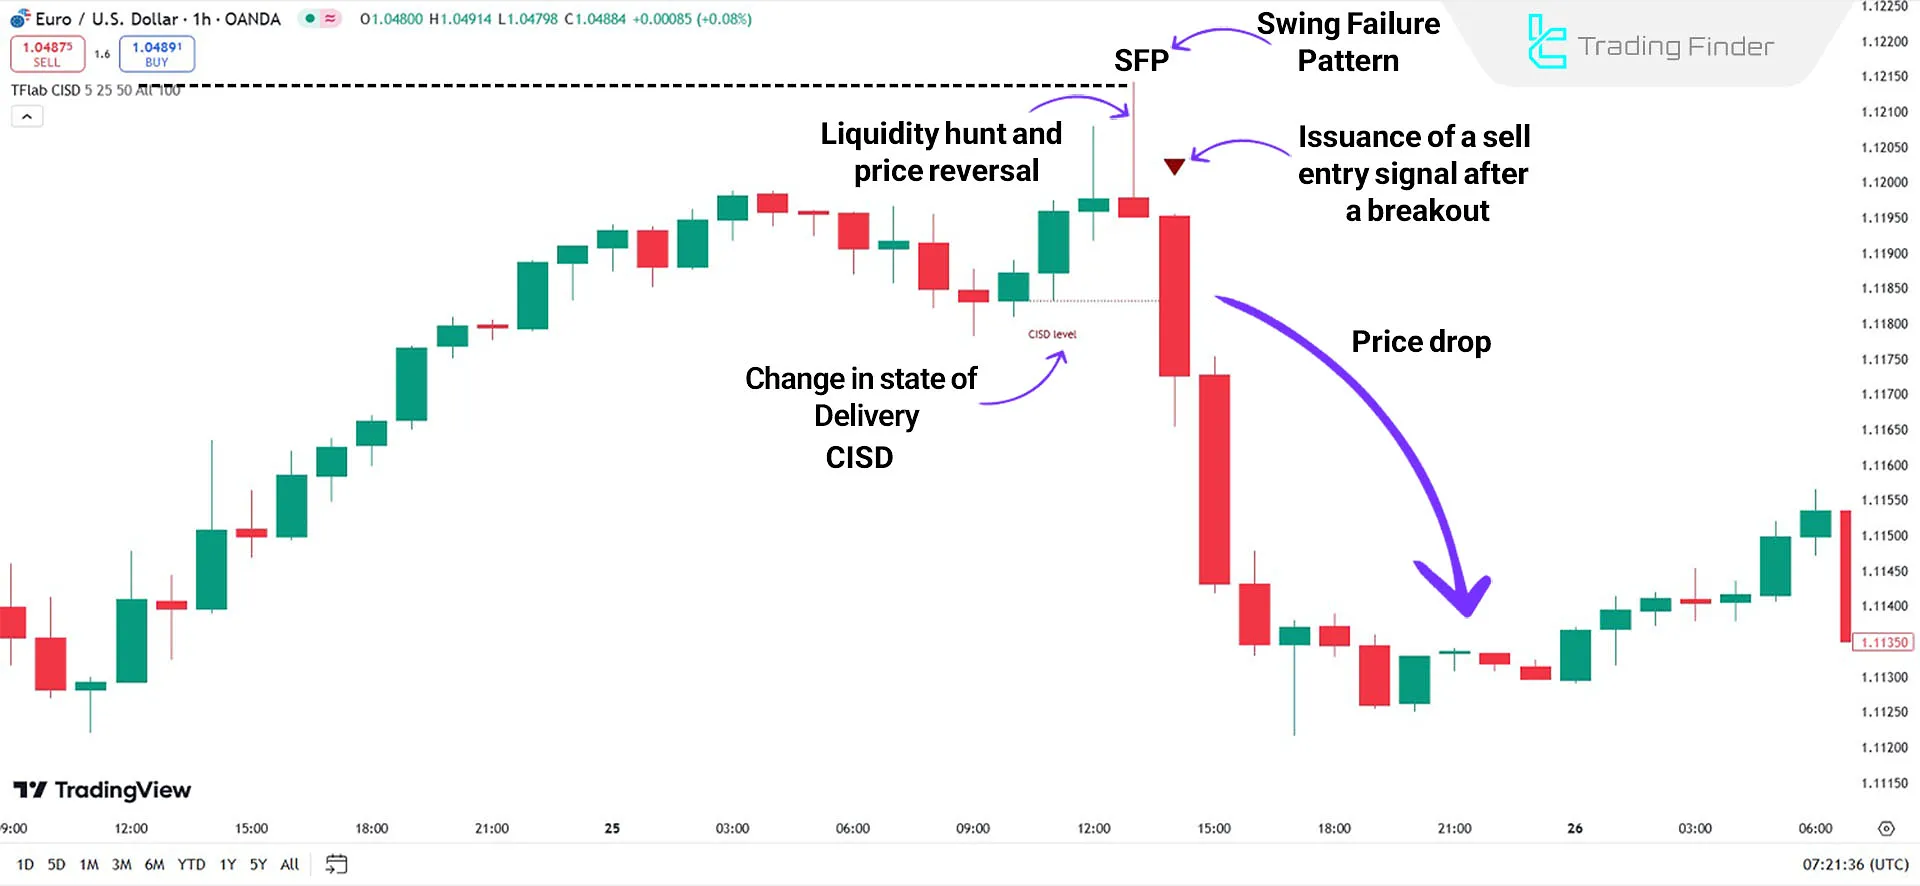
When the price reaches a liquidity zone, a trend reversal from uptrend to downtrend occurs. These zones are identified using patterns like SFP or similar structures that indicate market pressure.
The price reverses its direction due to this zone's false breakouts and liquidity grabs. Upon the first candle's CISD breakout, the indicator displays a sell signal (red arrow).

CISD Indicator Settings
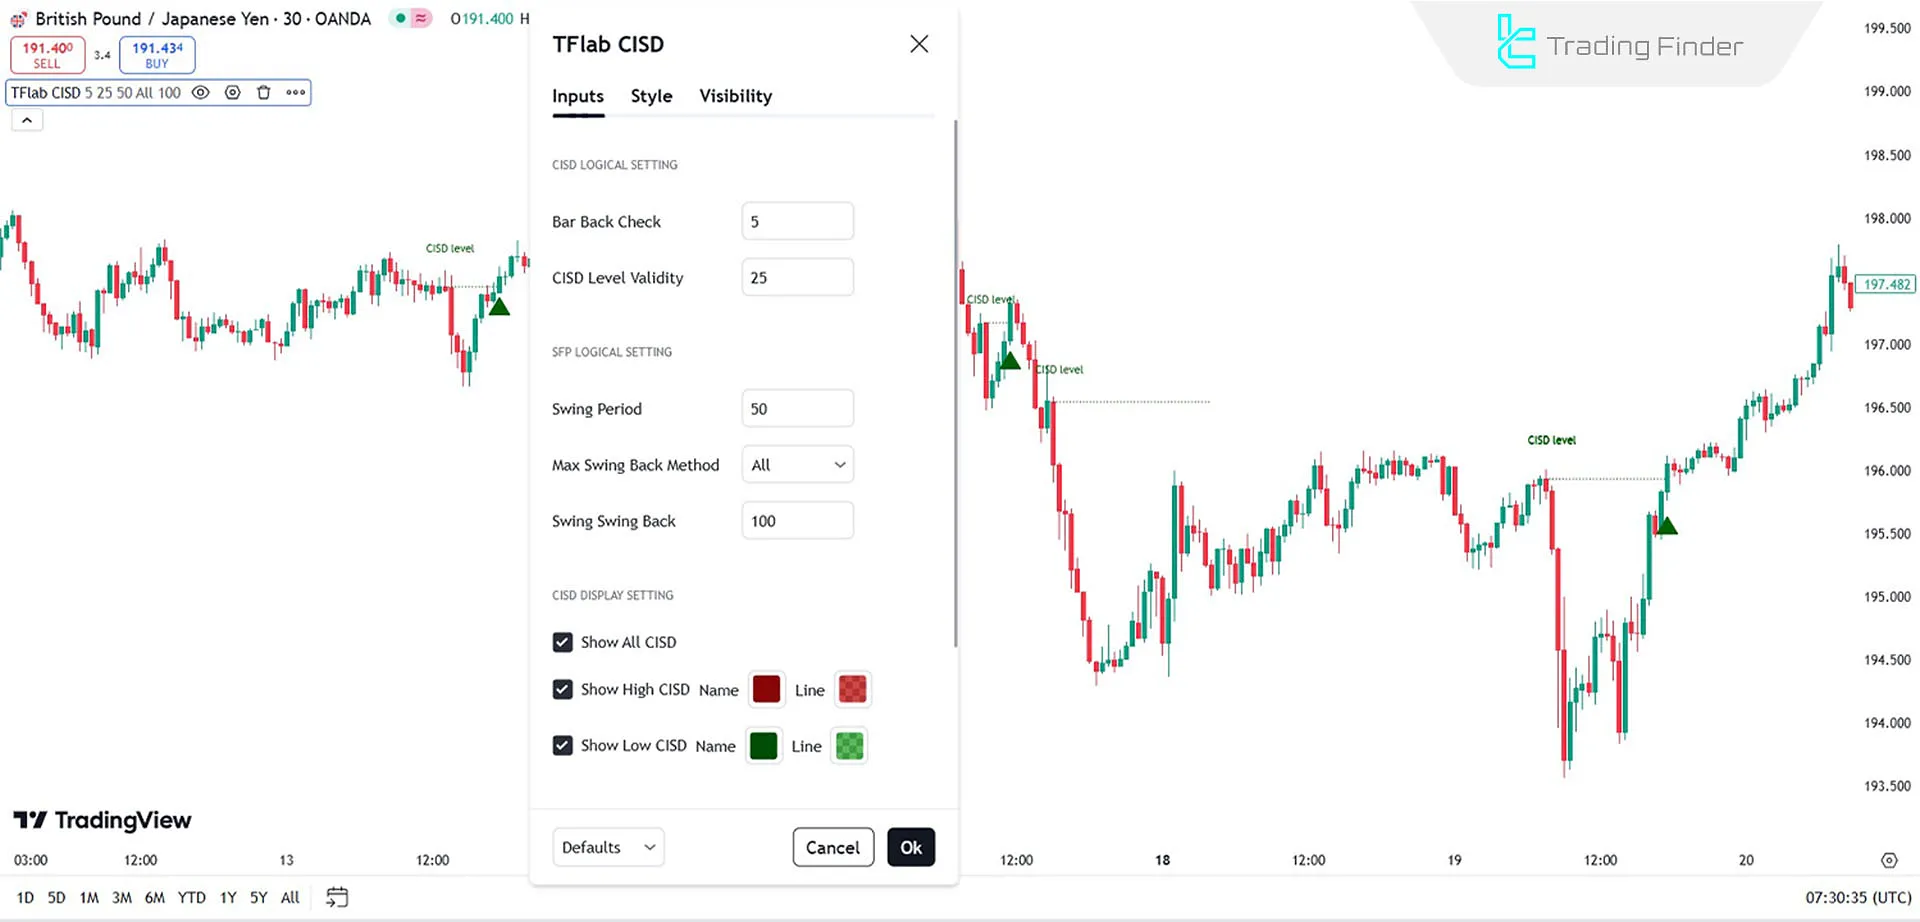
The image below showcases the comprehensive settings of this indicator, including CISD Logical Setting, SFP Logical Setting, CISD Display Setting, and more:

CISD Logical Setting
- Bar Back Check: Reviewing previous candlesticks to validate market conditions and identify valid patterns
- CISD Level Validity: Validating the CISD level to confirm the accuracy of signals
SFP Logical Setting
- Swing Period: Defined period for identifying price swings and trend changes
- Max Swing Back Method: Identifying maximum price retracements in swings to confirm the trend
CISD Display Setting
- Swing Back: Reviewing consecutive retracements to determine trend continuation or change
- Show All CISD: Displayingall CISD zones on the chart for comprehensive analysis
- Show High CISD Name: Highlighting upper CISD zones to identify bullish trends in green
- Show Low CISD Name: Highlight lower CISD zones in red to identify bearish trends
SFP Display Setting
- Show All SFP: Displaying all SFP patterns on the chart to identify reversal points (default: disabled)
- Show High SFP Name: Highlighting SFP patterns at higher price zones
- Show Low SFP Name: Highlight SFP patterns at lower price zones
Conclusion
The CISD indicator is an advanced tool in ICT strategies that identifies entry points by analyzing market structure changes and simulating liquidity zones.
This tool allows traders to recognize market turning points and control their strategies based on price movements.
Change State Delivery CISD TradingView PDF
Change State Delivery CISD TradingView PDF
Click to download Change State Delivery CISD TradingView PDFWhat is the CISD indicator?
CISD is an indicator based on price action analysis and market structure changes that identify liquidity zones and false breakouts, generating buy and sell signals.
How does CISD generate buy and sell signals?
When the price enters these zones and begins to reverse direction, the indicator issues a buy (green arrow) or sell (red arrow) signal.
Hello, your CISD indicators ( TFlab CISD and TFlab One Shot One kill) are both excellence indicators, just wondering if you would please make alert settings available on TradingView?
Hello, thank you for your feedback. Alerts will soon be added to many of the indicators.


