


TradingView
MetaTrader4
MetaTrader5
The Correlation Heatmap Matrix Indicator is designed to display and analyze relationships between different assets on TradingView.

This trading tool uses a color matrix to show the degree of positive or negative correlation between assets through color changes, making decision-making for risk management and portfolio diversification easier.
Specification Table of the Correlation Heatmap Matrix Indicator
The specifications of the Correlation Heatmap Matrix Indicator are as follows.
Indicator Categories: | Trading Assist Tradingview Indicators Heatmap Indicators for TradingView |
Platforms: | Trading View Indicators |
Trading Skills: | Intermediate |
Timeframe: | Multi-Timeframe Tradingview Indicators |
Trading Style: | Day Trading Tradingview Indicators Scalper Tradingview Indicators Swing Trading Tradingview Indicators |
Trading Instruments: | Cryptocurrency MT4 Indicators TradingView Indicators in the Forex Market Stock Tradingview Indicators |
Correlation Heatmap Matrix Indicator at a Glance
The Correlation Heatmap and Matrix Indicator, by simplifying statistical data, allows traders to quickly analyze multiple assets simultaneously.
Traders can use this tool to identify assets moving in the same direction or in opposite directions.
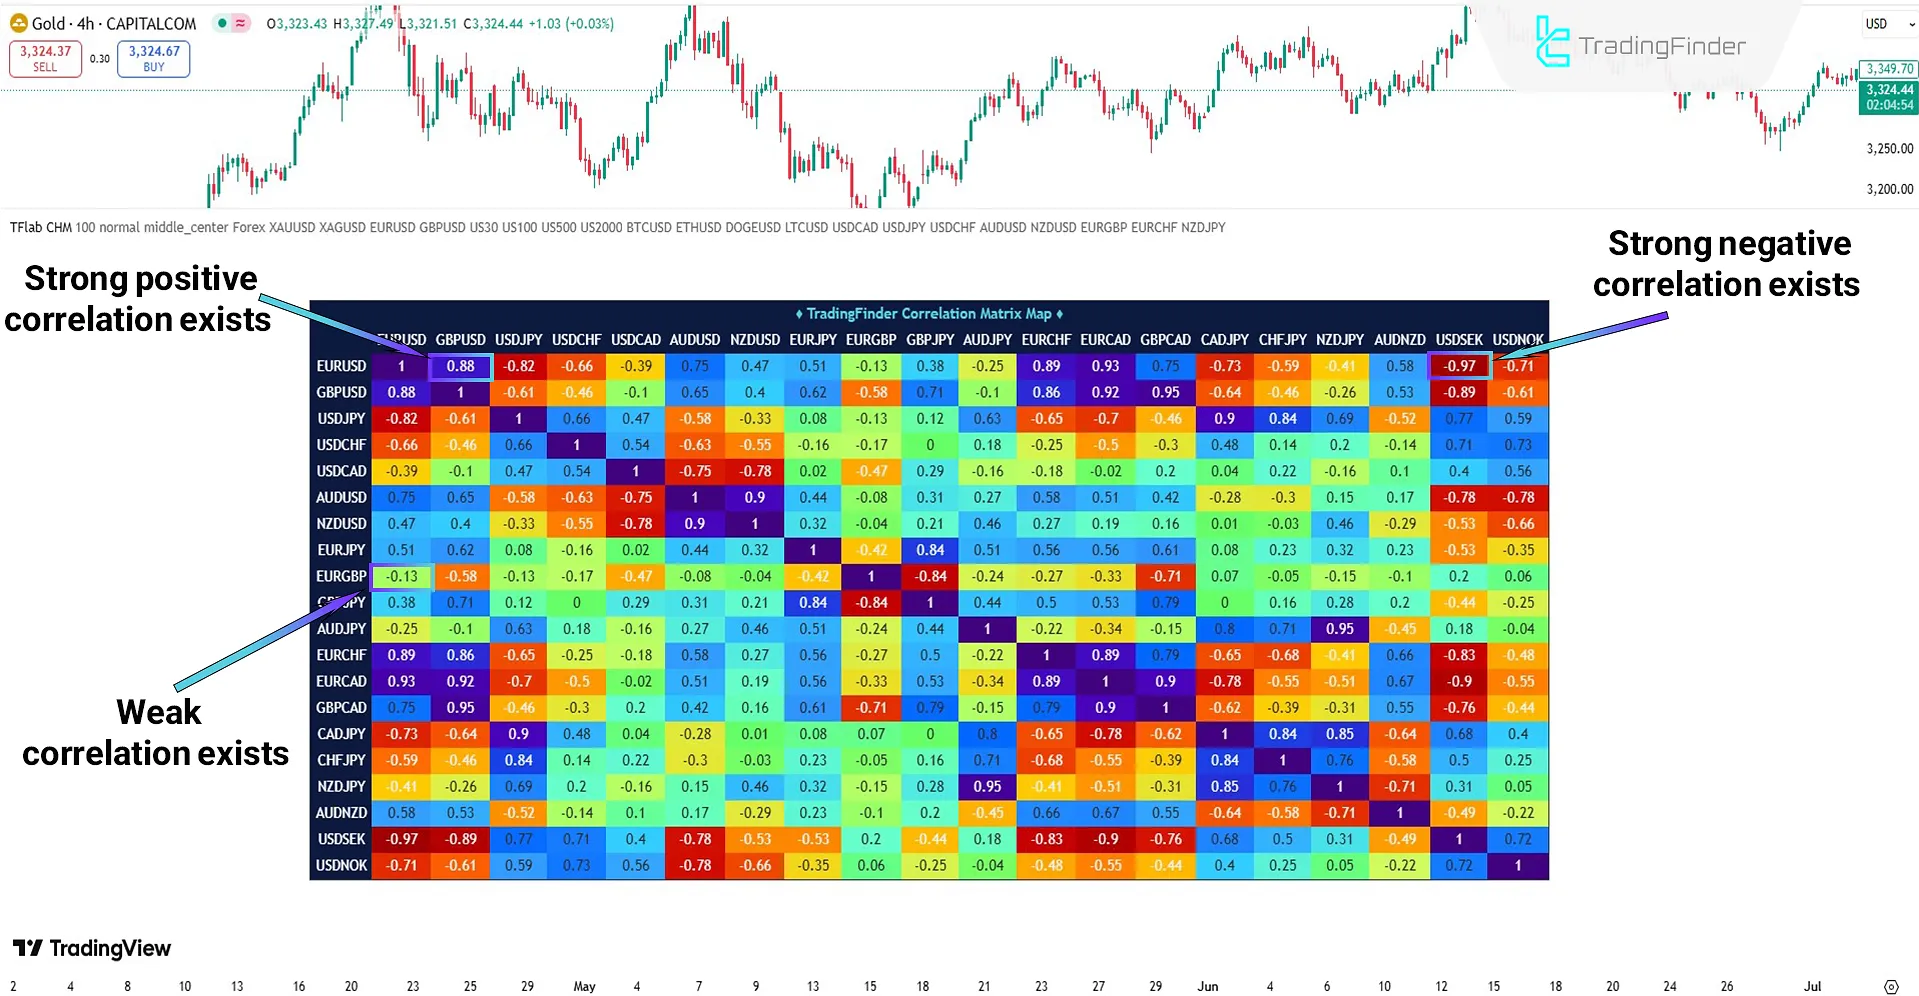
Identifying Positive and Negative Correlations
In the Correlation Heatmap Matrix Indicator, the type of correlation is determined solely by the color of each cell in the matrix. The matrix colors include:
- Blue and Purple: indicate a strong positive correlation, meaning the assets typically move together in the same direction;
- Red and Orange: indicate strong negative correlation; identifying assets that move opposite to each other;
- Green and Yellow: these two colors represent weak or near neutral correlations.
Settings of the Correlation Heatmap Matrix Indicator
The settings panel of the Correlation Heatmap Matrix Indicator is as follows:
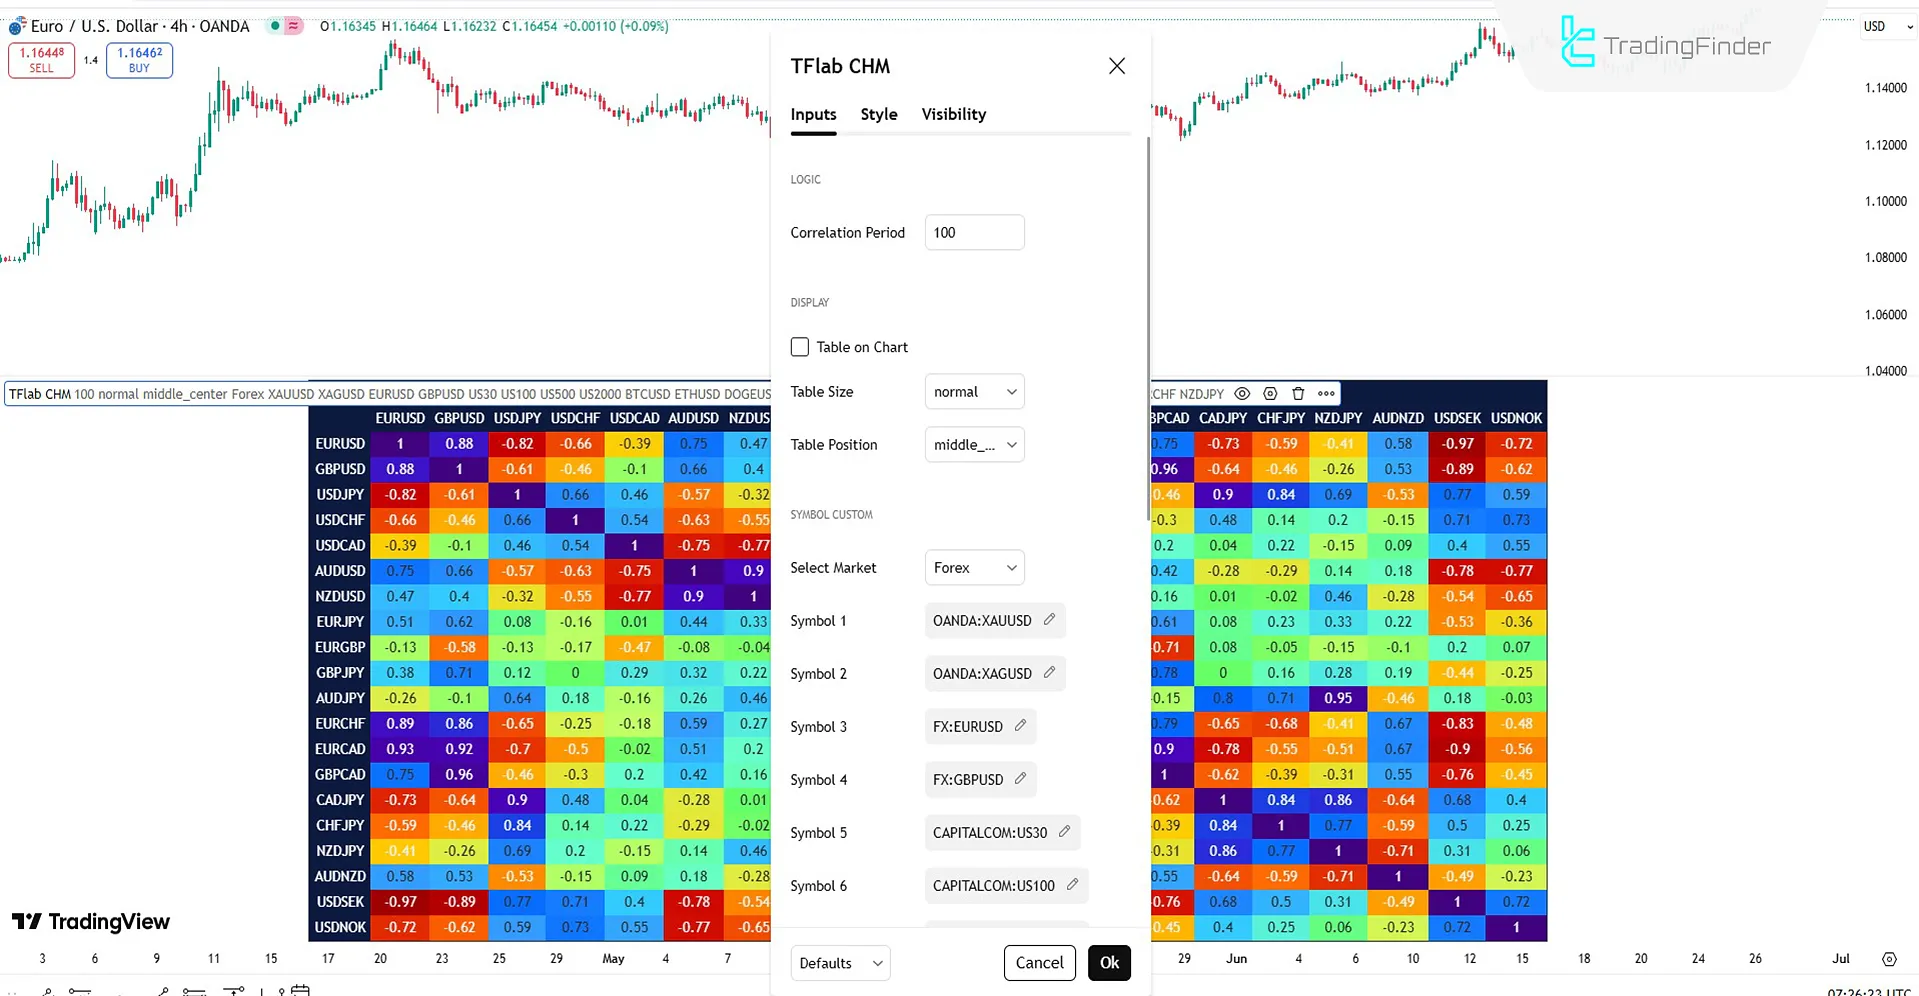
Logic
- Correlation Period: correlation calculation period
Display
- Table on Chart: enable or disable table display on the Chart
- Table Size: select table size
- Table Position: select the table position on the Chart
Symbol Custom
- Select Market: choose the desired Market
- Symbol 1 to 20: select up to 20 assets or symbols
Input Values
- Inputs in status line: show indicator input values in the Chart’s top status bar
Conclusion
The Correlation Heatmap Matrix Indicator is a visual tool for displaying the correlation of currency pairs, showing positive and negative relationships in a color-coded matrix.
By simplifying statistical data, this indicator makes it possible to analyze multiple assets simultaneously. It also helps prevent repetitive and high-risk trades while revealing new trading opportunities.
Correlation Heatmap Matrix Indicator TradingView PDF
Correlation Heatmap Matrix Indicator TradingView PDF
Click to download Correlation Heatmap Matrix Indicator TradingView PDFDoes this indicator generate entry and exit signals?
No, the Correlation Heatmap Matrix Indicator does not generate any buy or sell signals.
Is this indicator only suitable for the Forex market?
No, the Correlation Heatmap and Matrix Indicator can be used in all markets. Users can select their preferred Market and symbols through the settings panel.


