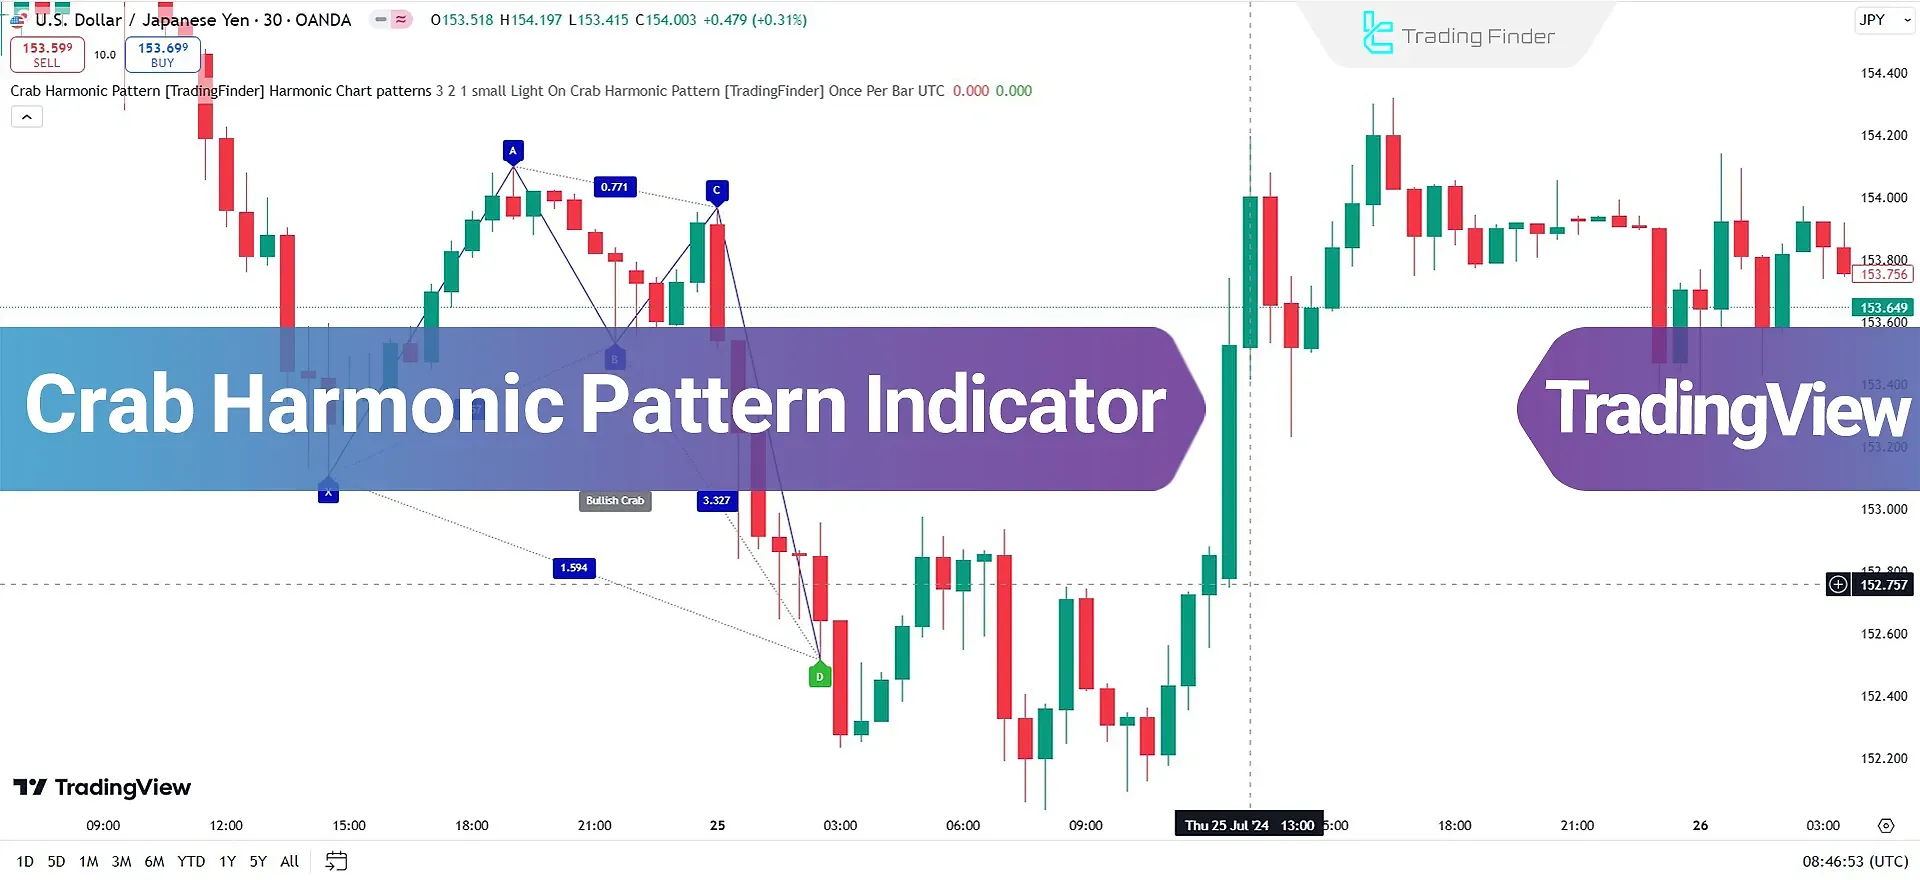
The Crab Harmonic Pattern Indicator is one of the TradingView Harmonic Pattern Indicators that uses Fibonacci Ratios to identify Potential Reversal Zones (PRZ) on the chart. The Crab Pattern can appear in Bullish (M shape) and Bearish (W shape) on the chart.

After forming the pattern, the Sell signal is shown with a red arrow, and the Buy signal is shown with a green arrow.
Specifications of the Crab Harmonic Indicator
The table below summarizes the features of this indicator:
Indicator Categories: | Signal & Forecast Tradingview Indicators Harmonic Tradingview Indicators Chart & Classic Tradingview indicators |
Platforms: | Trading View Indicators |
Trading Skills: | Intermediate |
Indicator Types: | Reversal Tradingview Indicators |
Timeframe: | Multi-Timeframe Tradingview Indicators |
Trading Style: | Intraday Tradingview Indicators |
Trading Instruments: | TradingView Indicators in the Forex Market Cryptocurrency Tradingview Indicators Stock Tradingview Indicators Forward Tradingview Indicators Share Stocks Tradingview Indicators |
Overview of the Indicator
The Crab Harmonic Pattern consists of 5 key points (X, A, B, C, D) formed based on Fibonacci levels. Point B is a retracement of XA, ranging between 38.2% to 61.8%, while point C is between 38.2% and 88.6% of AB.
Point D, which identifies the Potential Reversal Zone (PRZ), is typically at 161.8% of XA or higher. In the Bullish Pattern, this point acts as a Buy Zone; in the Bearish Pattern, it acts as a Sell Zone.
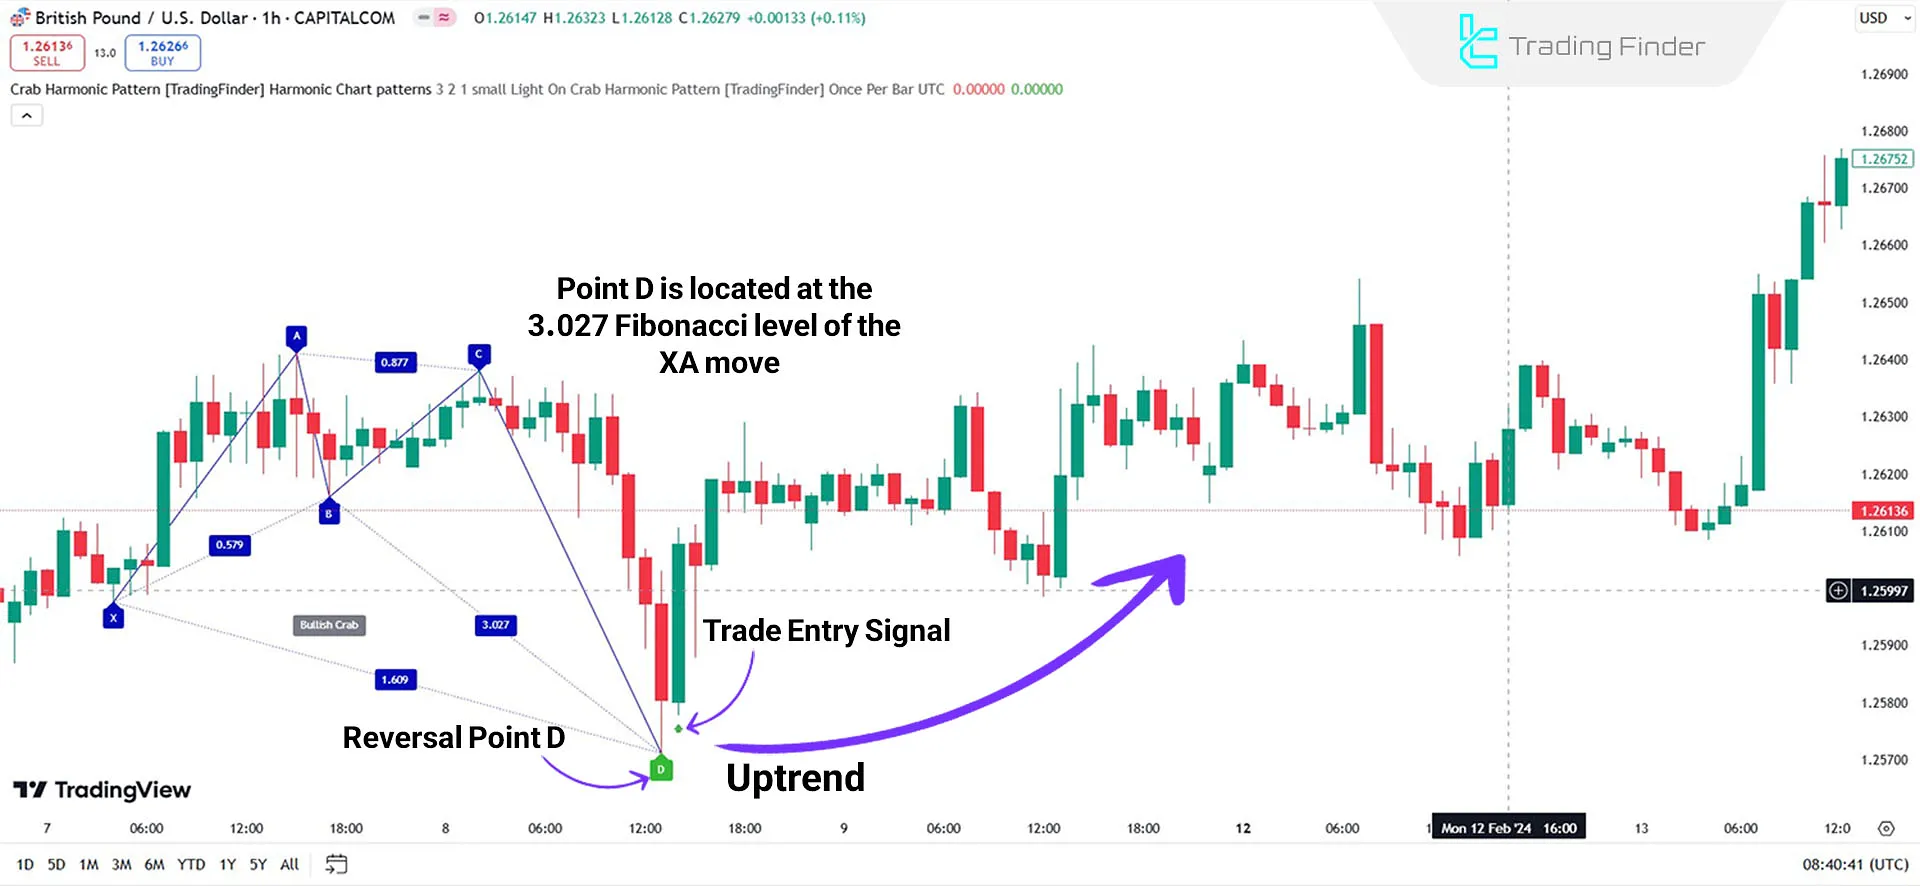
Indicator in an Uptrend
This pattern starts with an upward movement, followed by a price retracement. Subsequently, the price resumes its upward target.
Price retracements play a key role in this pattern, as Entry and Exit points are determined using Fibonacci Ratios at these stages.
After the pattern is completed and confirmation from the indicator is received, theBuy signal (green arrow) is displayed.

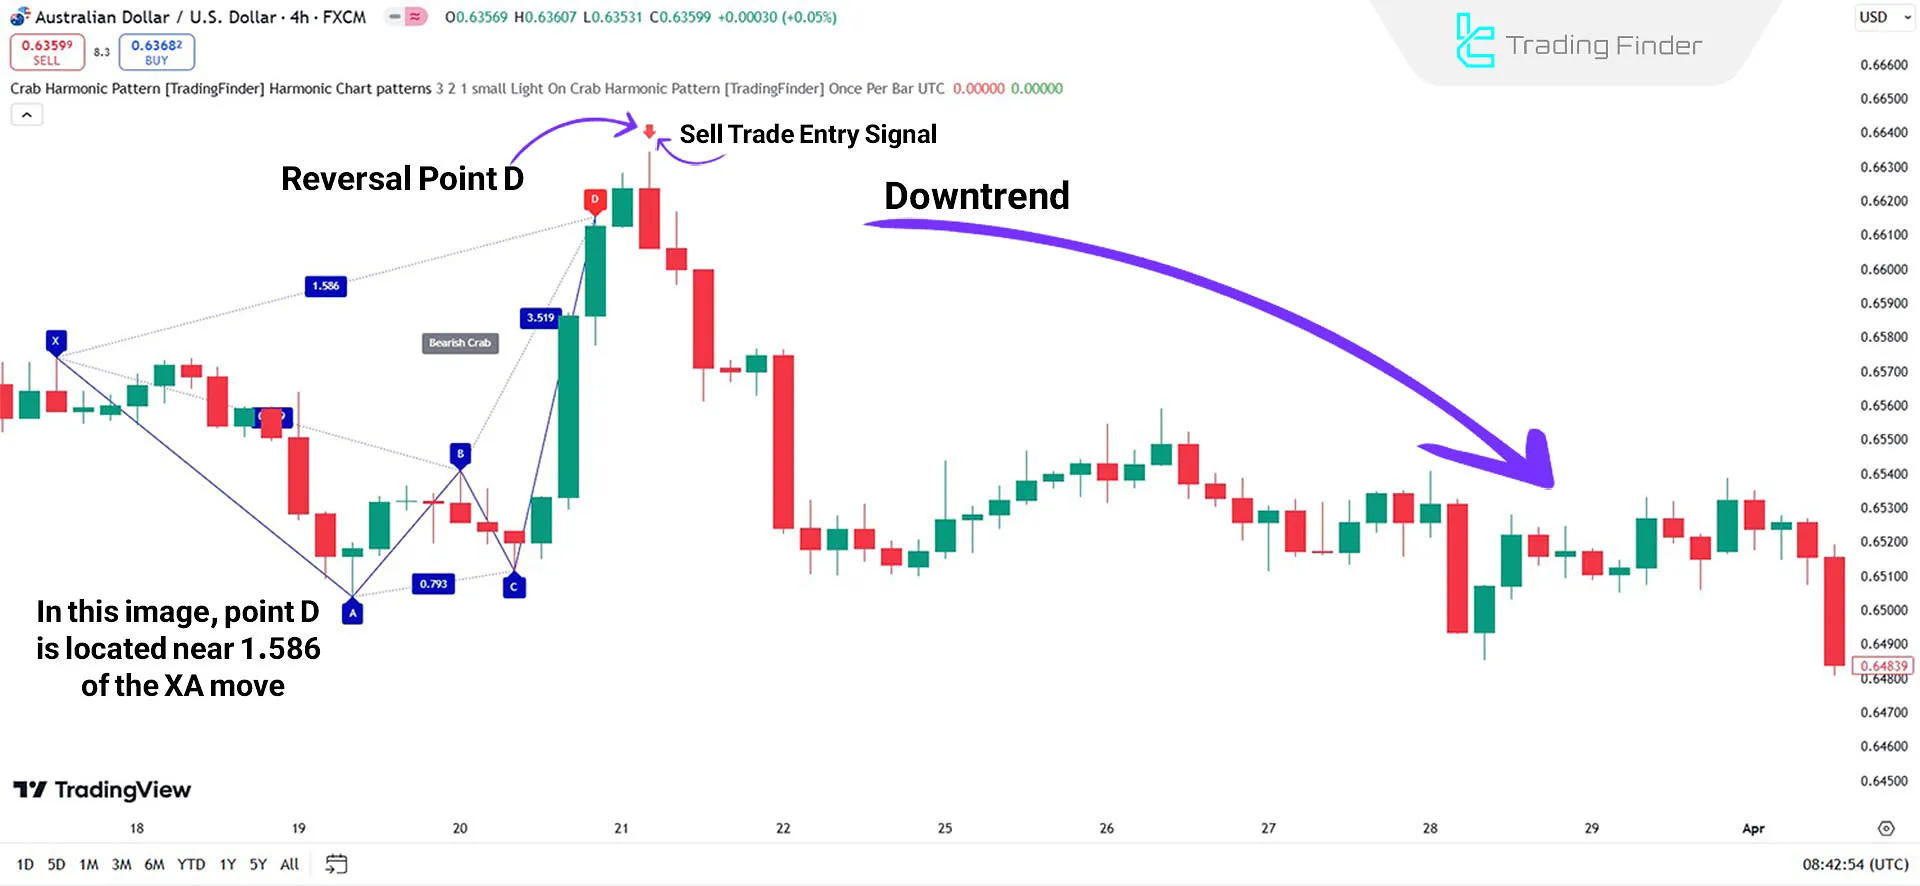
Indicator in a Downtrend
On the price chart of the AUD/USD pair, the Bearish Crab Pattern resembles the letter W. It usually starts with a corrective move in a downtrend.
After several price oscillations, the price reaches its peak, where the direction changes, and a sharp decline occurs. At this point, the indicator generates a Sell signal.

Indicator Settings
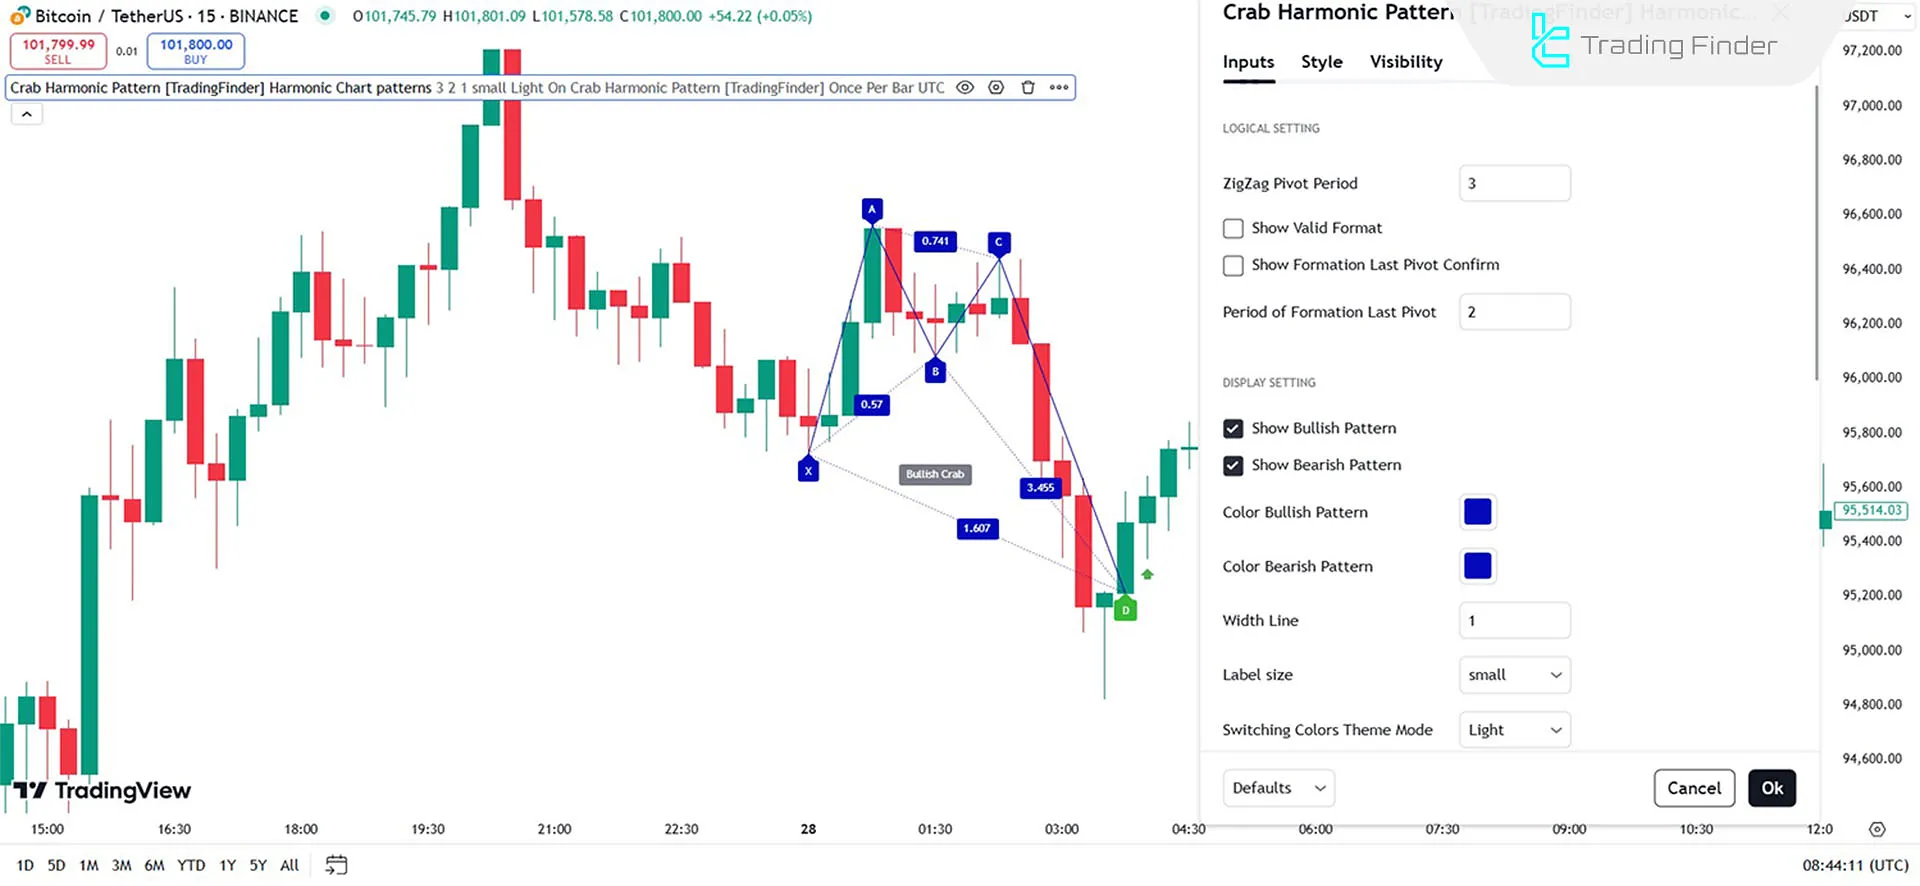
The image below shows the settings of the indicator and provides complete details of sections such as Logical Setting, Display Setting, and more:

Logical Setting
- ZigZag Pivot Period: Default calculation period for ZigZag pivots: 3;
- Show Valid Format: Display only valid patterns;
- Show Formation Last Pivot Confirm: Show confirmation of the last pivot;
- Period of Formation Pivot: Formation period for the last pivot - Default is 2.
Display Setting
- Show Bullish Pattern: Display Bullish Patterns;
- Show Bearish Pattern: Display Bearish Patterns;
- Color Bullish Pattern: Default color for Bullish Pattern: Blue;
- Color Bearish Pattern: Default color for Bearish Pattern: Blue;
- Width Line: Default line thickness: 1;
- Label Size: Text label size;
- Switching Colors Theme Mode: Chart background theme.
Alert
- Alert: Generate alerts for pattern creation;
- Alert Name: Name of the alert;
- Message Frequency: Customizable alert content;
- Show Alert Time By Time Zone: Display alert time based on time zone.
Conclusion
The Crab Harmonic Pattern Indicator is specifically designed for traders who use Chart & Classic indicators in their analyses.
This tool automatically identifies key points of harmonic patterns and determines Potential Reversal Zones (PRZ) to generate trade entry signals.
Crab Harmonic Pattern TradingView PDF
Crab Harmonic Pattern TradingView PDF
Click to download Crab Harmonic Pattern TradingView PDFWhat is the Crab Harmonic Pattern Indicator?
It is a tool for automatically identifying the Crab Pattern and its Potential Reversal Zones (PRZ) in technical analysis.
How does the Crab Harmonic Pattern Indicator issue signal?
After point D is formed, the indicator shows a Buy signal with a green arrow and a Sell signal with a red arrow.


