


TradingView
MetaTrader4
MetaTrader5
The Cumulative Volume Delta Divergence (CVD Divergence) Oscillator is an advanced tool for identifying price divergences on the TradingView platform.
This signal and forecast indicator analyzes the relationship between buy and sell volumes with price changes, providing reliable signals for entry and exit points in trades.
Indicator Specifications
Indicator Categories: | Oscillators Tradingview Indicators Signal & Forecast Tradingview Indicators Currency Strength Tradingview Indicators |
Platforms: | Trading View Indicators |
Trading Skills: | Intermediate |
Indicator Types: | Reversal Tradingview Indicators |
Timeframe: | Multi-Timeframe Tradingview Indicators |
Trading Style: | Intraday Tradingview Indicators |
Trading Instruments: | TradingView Indicators in the Forex Market Cryptocurrency Tradingview Indicators Stock Tradingview Indicators |
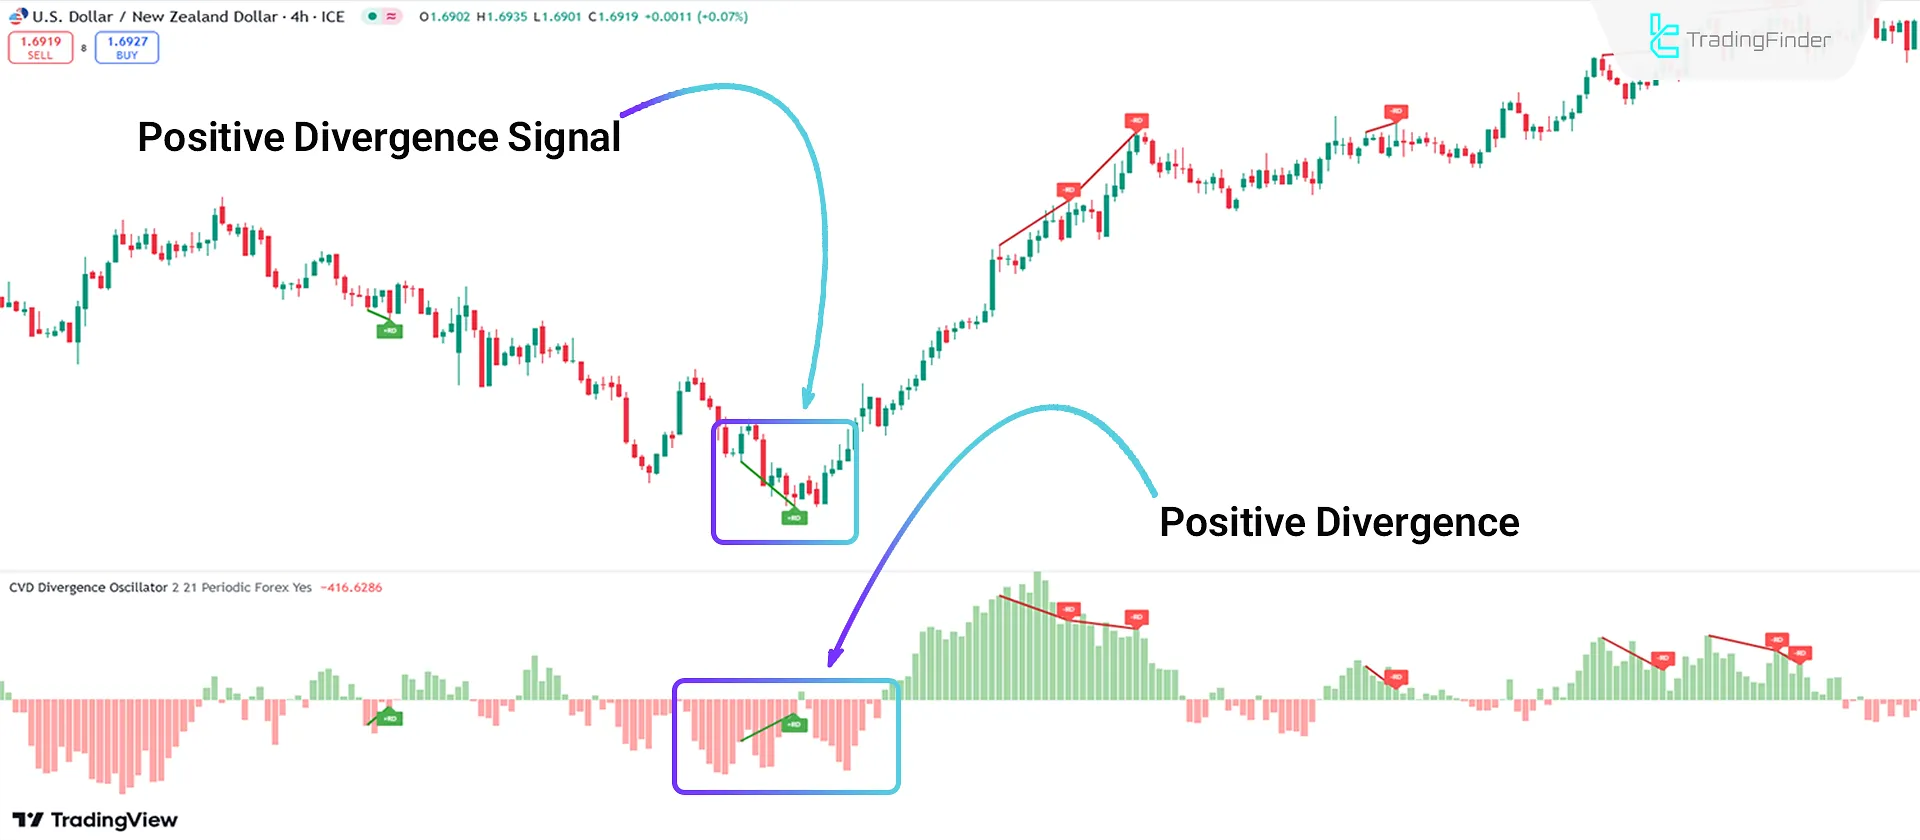
Bullish Trend Conditions
Based on the USD/NZD currency pair's 4-hour chart analysis, the price is forming lower lows.
Still, the oscillator's histogram, highlighted with a green line and marker, indicates a positive divergence.
Positive divergence suggests a trend reversal from bearish to bullish, offering a suitable opportunity to enter Buy trades.
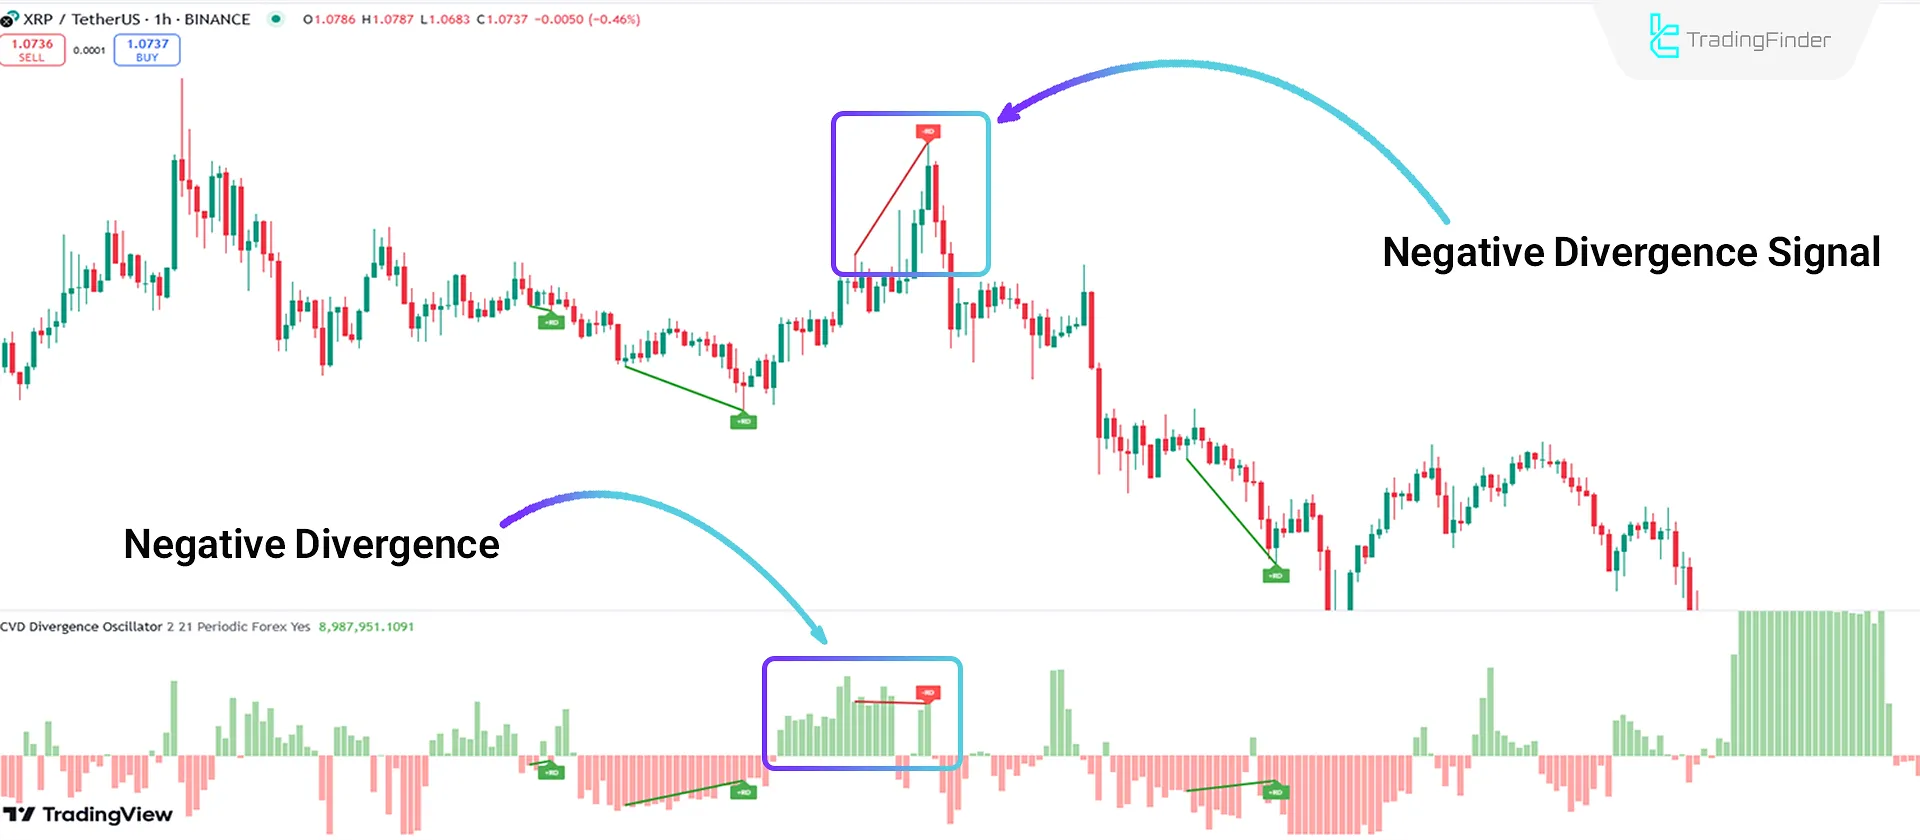
Bearish Trend Conditions
As shown in the 1-hour price chart of Ripple (XRP), the price is forming higher highs, but the oscillator's histogram, highlighted with a red line and marker, indicates a negative divergence.
Negative divergence signals a trend reversal from bullish to bearish, offering a suitable opportunity to enter Sell trades.
Indicator Settings
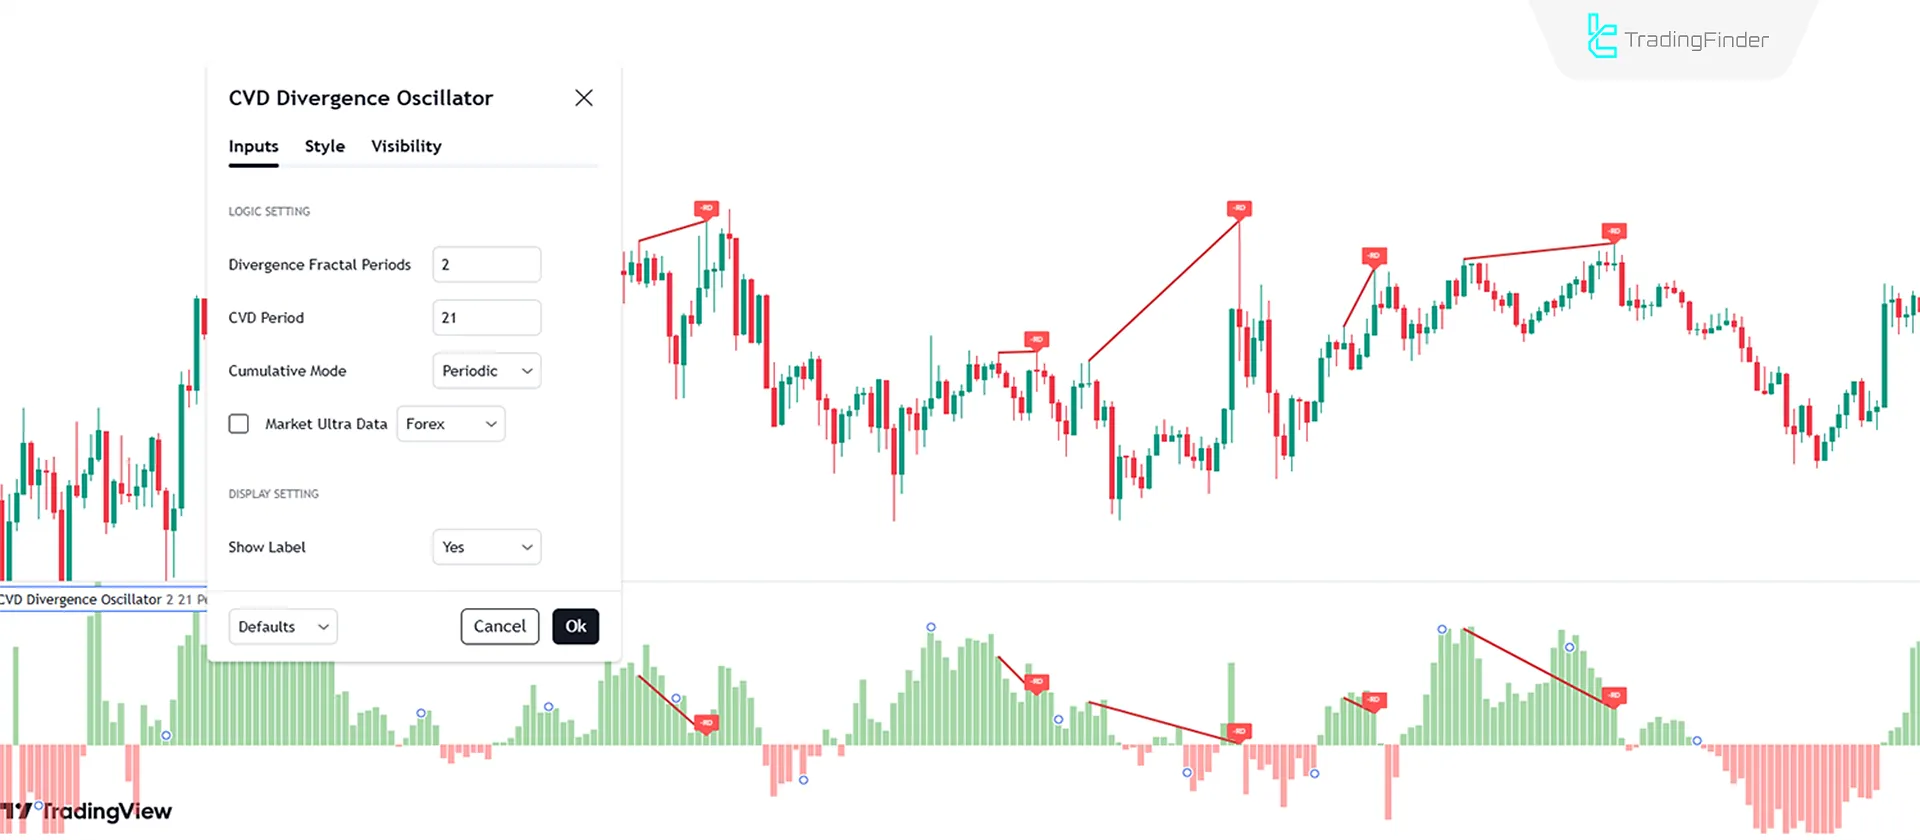
- Divergence Fractal Periods: The number of fractal periods for identifying divergences is set to 2;
- CVD Period: The period used for calculating Cumulative Volume Delta, set to 21;
- Cumulative Mode: Sets the mode for cumulative calculations;
- Market Ultra Data: Activates additional market data for greater accuracy;
- Show Label: Determines whether labels are displayed or hidden.
Conclusion
The Cumulative Volume Delta Divergence (CVD) Indicator is a powerful oscillator for detecting and displaying price divergences as entry signals.
By using this indicator, traders can effectively identify trend direction changes based on divergence.
The CVD Oscillator is suitable for use in short timeframes for day trading and scalping and in long timeframes for analyzing major market trends.
Cumulative Volume Delta Divergence TradingView PDF
Cumulative Volume Delta Divergence TradingView PDF
Click to download Cumulative Volume Delta Divergence TradingView PDFDoes the "CVD" indicator provide entry signals?
This indicator shows trends using divergence lines and issues entry signals with markers.
When does divergence occur?
Divergence occurs when the oscillator records movements opposite to the price trend.


