


TradingView
MetaTrader4
MetaTrader5
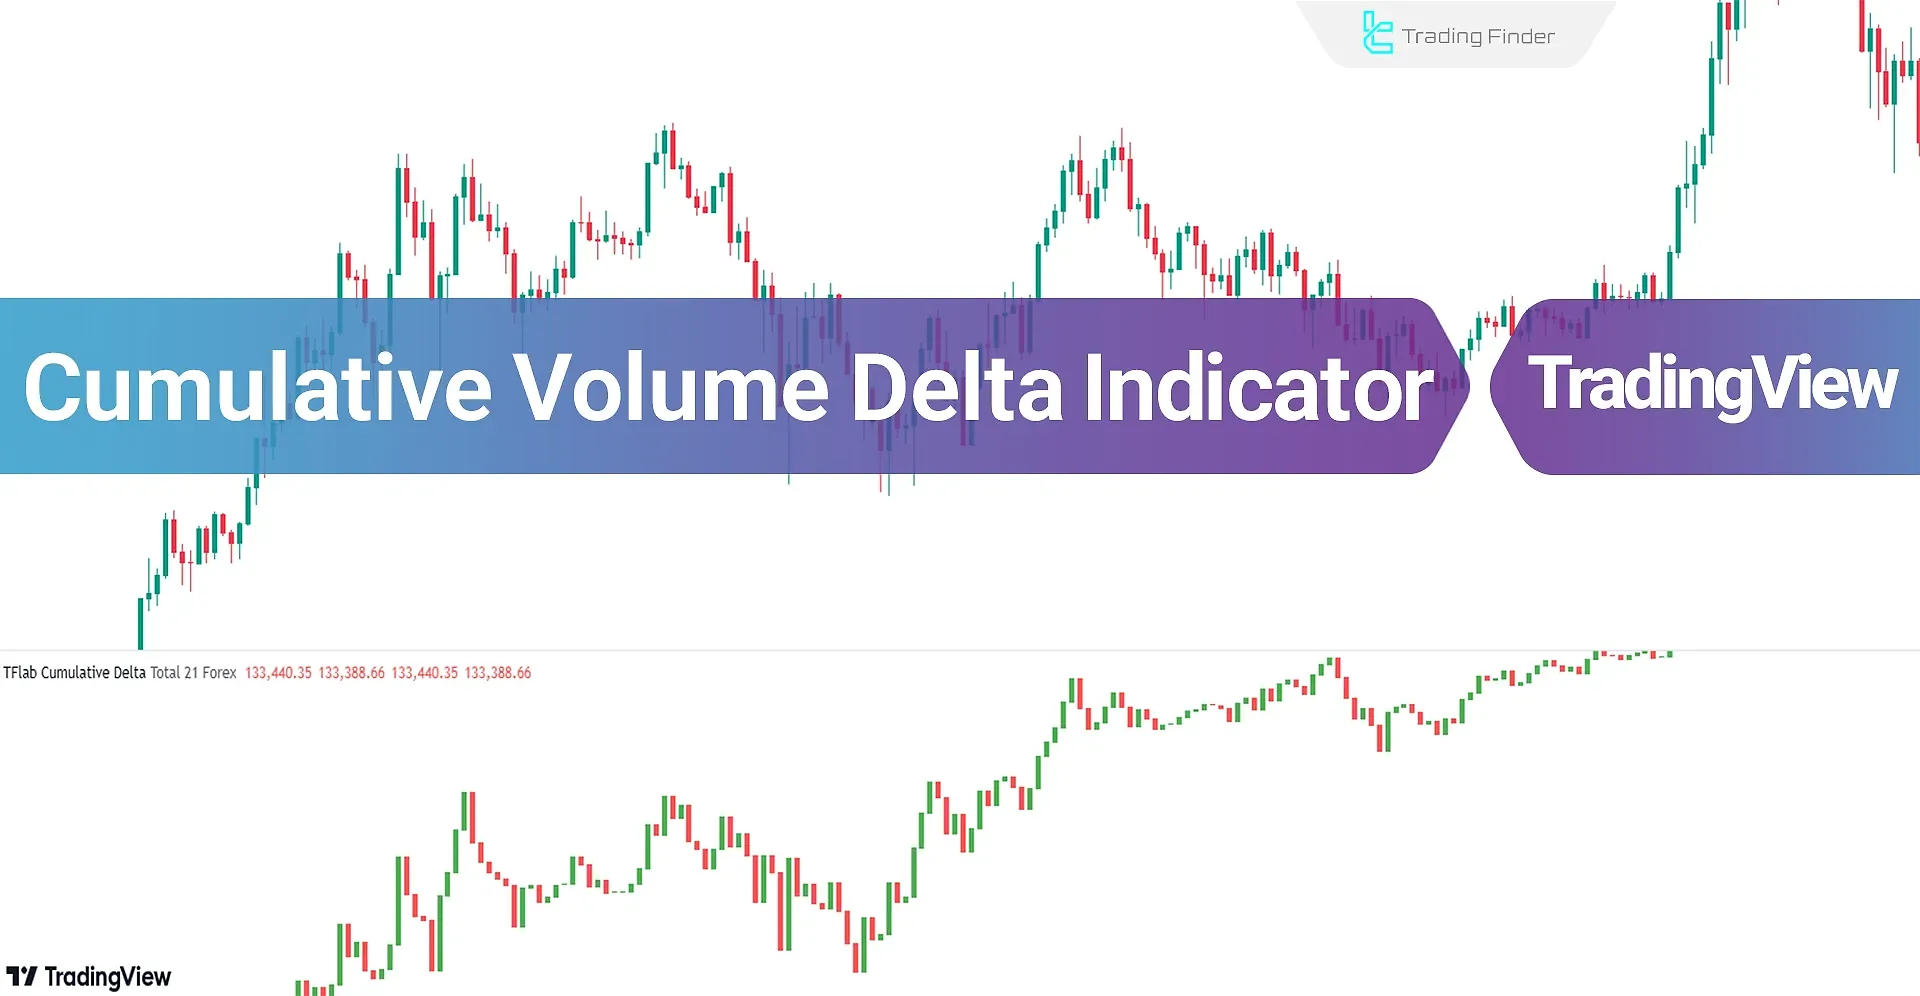
The Cumulative Volume Delta (CVD) indicator is part of the TradingView indicators, designed to measure the strength or weakness of trends.
This indicator analyzes buying and selling pressure by aggregating and combining the volume delta for each candlestick.
When the "CVD" moves upward, it indicates dominant buying pressure, and conversely, when the "CVD" moves downward, it reflects selling pressure.
Cumulative Volume Delta Indicator Specifications
Indicator Categories: | Oscillators Tradingview Indicators Volatility Tradingview Indicators Currency Strength Tradingview Indicators |
Platforms: | Trading View Indicators |
Trading Skills: | Intermediate |
Indicator Types: | Reversal Tradingview Indicators |
Timeframe: | Multi-Timeframe Tradingview Indicators |
Trading Style: | Intraday Tradingview Indicators |
Trading Instruments: | TradingView Indicators in the Forex Market Cryptocurrency Tradingview Indicators Stock Tradingview Indicators |
Indicator at a Glance
The Cumulative Volume Delta (CVD) indicator evaluates buying and selling pressure and helps traders identify divergences. For example, a potential trend reversal is likely if the "CVD" does not align with price movement.
This indicator significantly aids in pinpointing Entry and Exit points for trades.
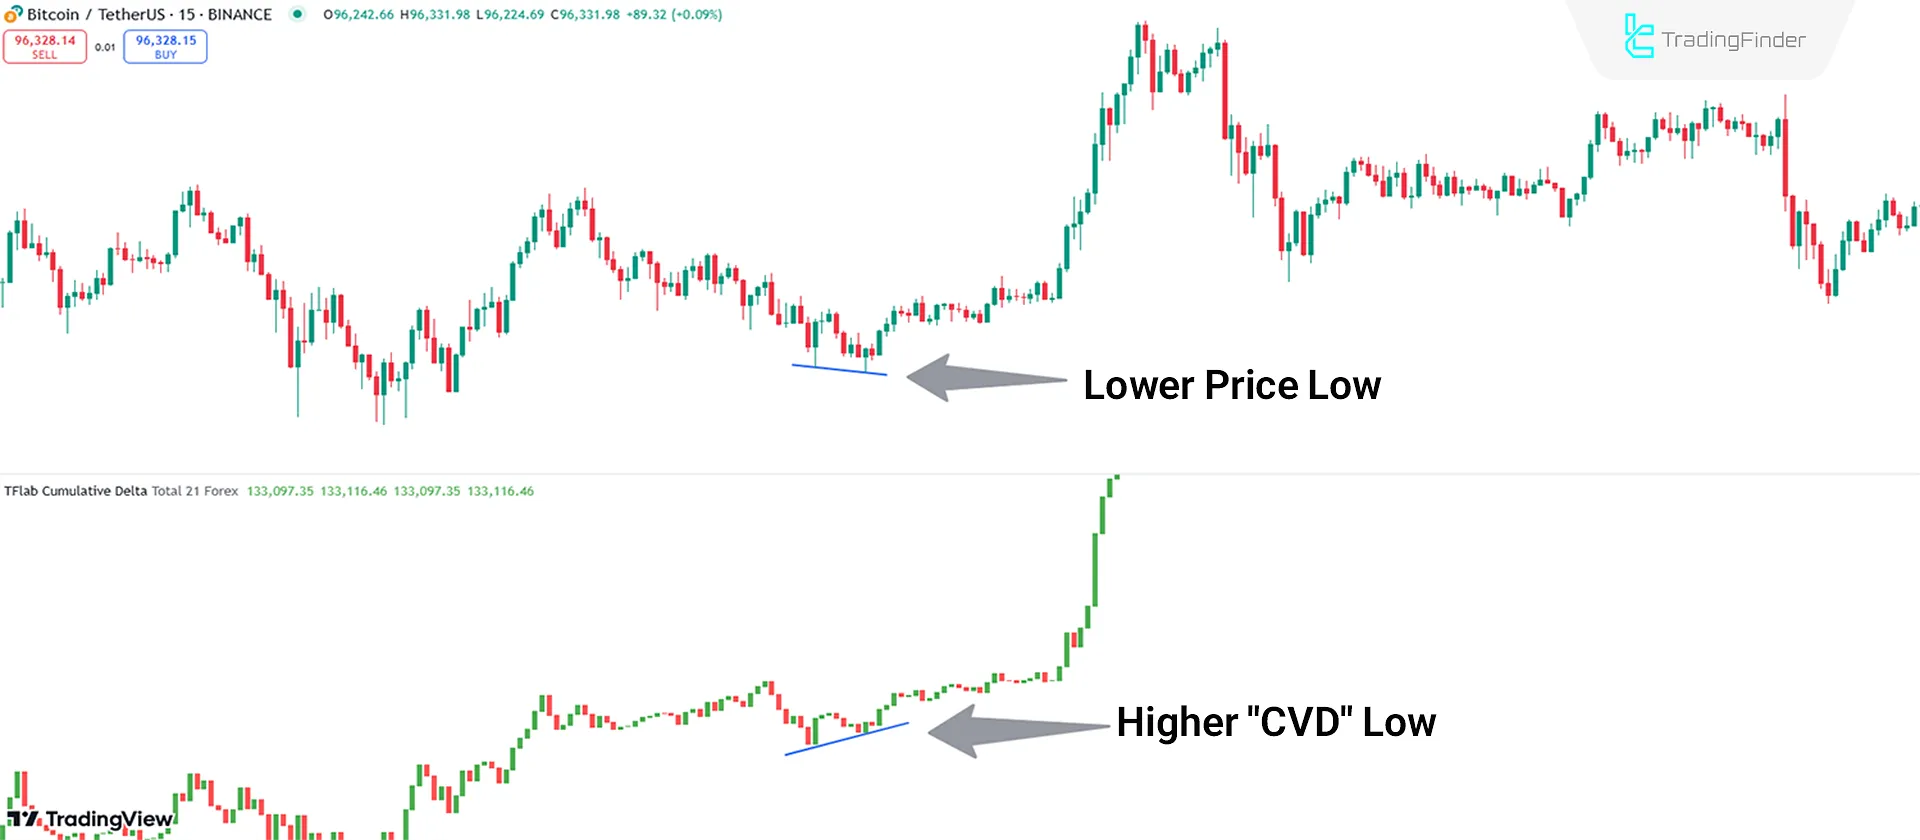
Bullish Trend Conditions
As illustrated in the Bitcoin (BTC) chart on a 15-minute time frame, the price forms a lower low, but the "CVD" chart forms a higher low. This phenomenon indicates a divergence between the price trend and the "CVD" indicator.
The upward movement of the indicator, coupled with observing bullish divergence, could signal an opportunity to enter Buy trades.
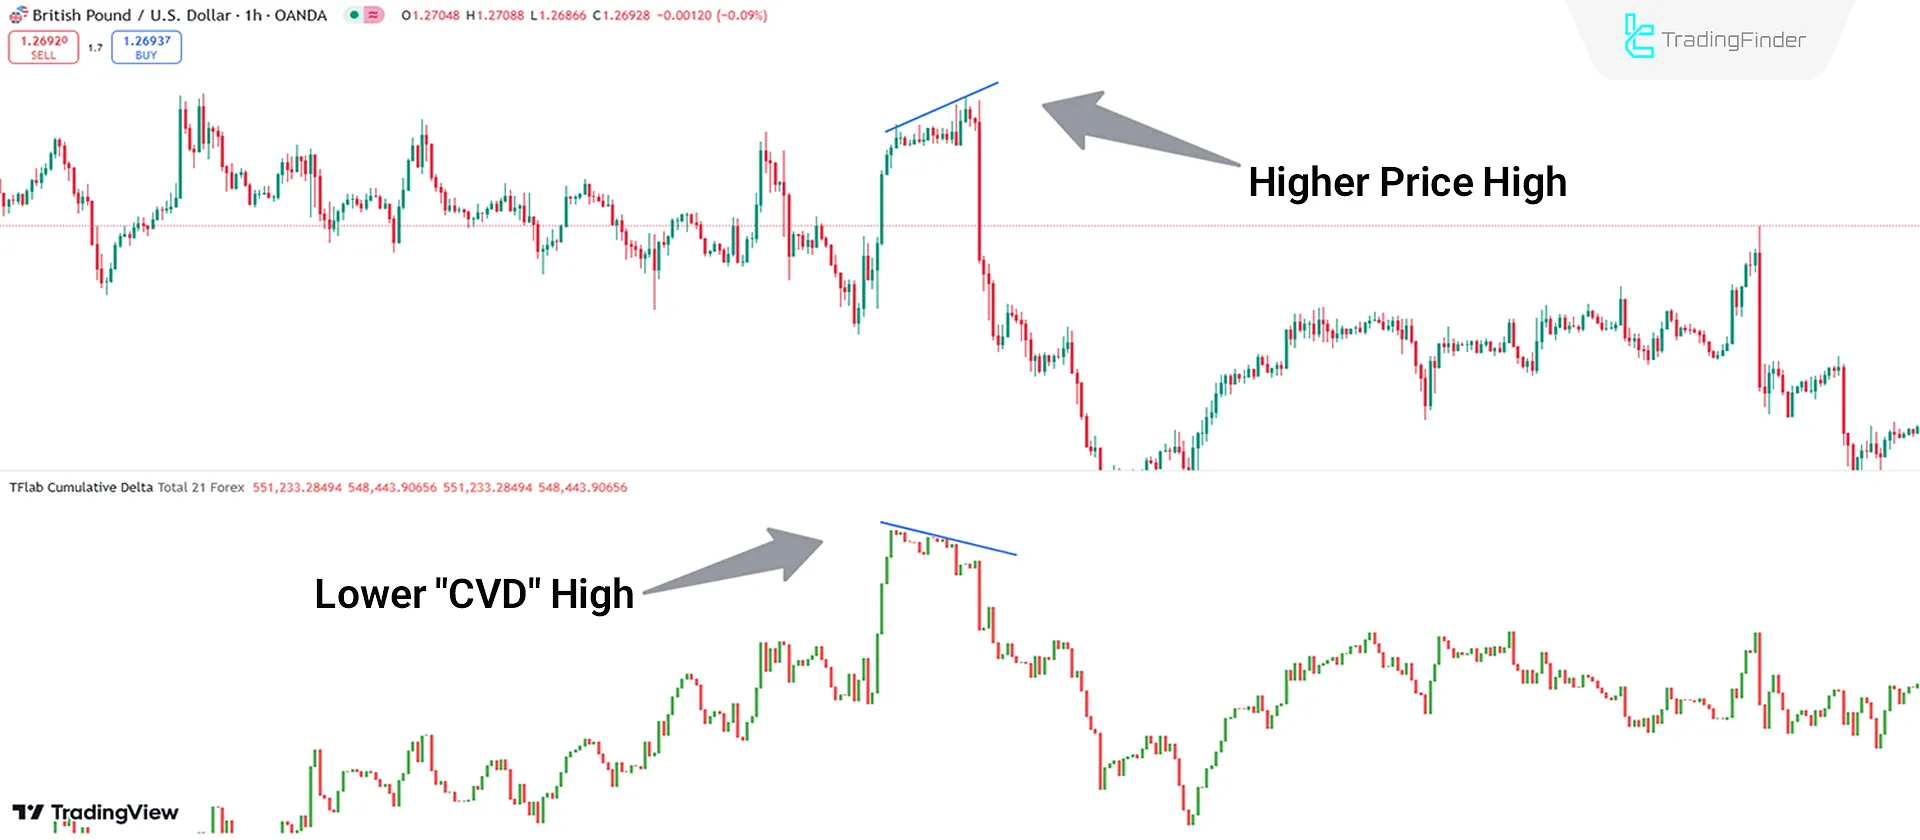
Bearish Trend Conditions
Based on the GBP/USD currency pair analysis on a 1-hour time frame, the price forms a higher high, but the "CVD" chart forms a lower high.
This event highlights the divergence between the price trend and the "CVD" indicator. The indicator's downward movement and observation of bearish divergence could signal an opportunity to enter sell trades.
Indicator Settings
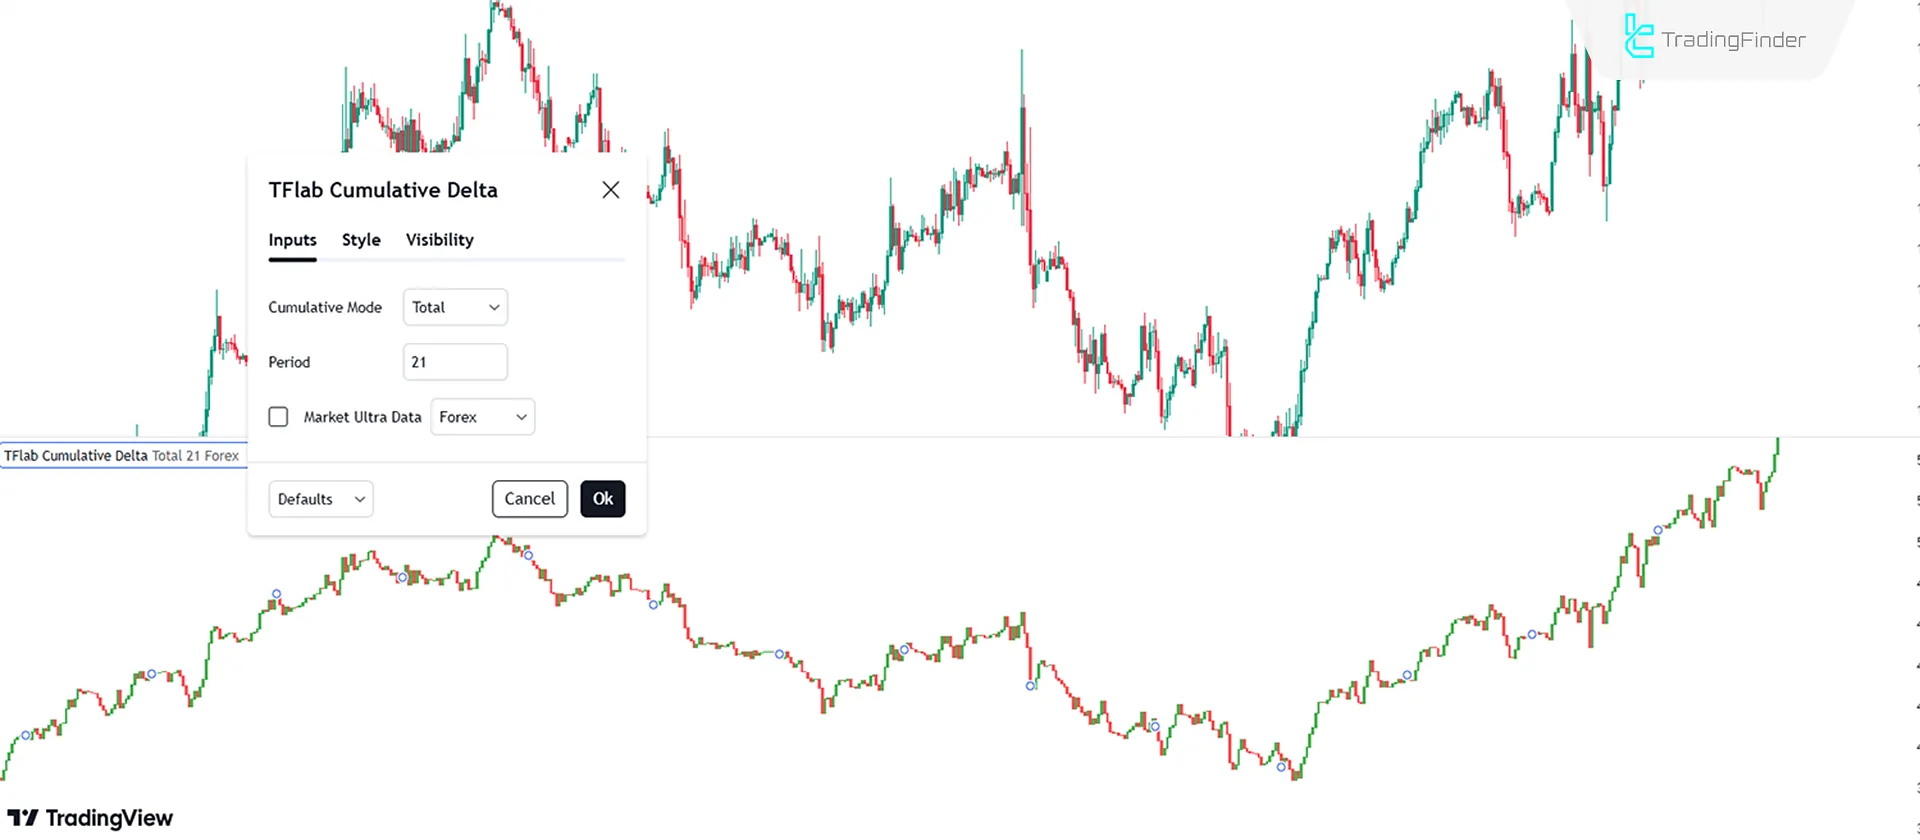
- Cumulative Mode: Calculates data aggressively;
- Period: The number of periods for the indicator's calculation is set to 21;
- Market Ultra Data: Defines the market used for calculations.
Conclusion
The Cumulative Volume Delta (CVD) indicator is a practical tool for analyzing buying and selling pressure and detecting divergence in TradingView Oscillators.
You can calculate data across various markets like crypto, forex, and stocks in the indicator settings. Observing divergences and the direction of the indicator can play a crucial role in trading decisions.
Cumulative Volume Delta TradingView PDF
Cumulative Volume Delta TradingView PDF
Click to download Cumulative Volume Delta TradingView PDFDoes this indicator generate trade entry signals?
No, this indicator does not provide any trade entry signals.
What does divergence mean in this indicator?
Divergence refers to the misalignment between the price movement and the indicator.


