


TradingView
MetaTrader4
MetaTrader5
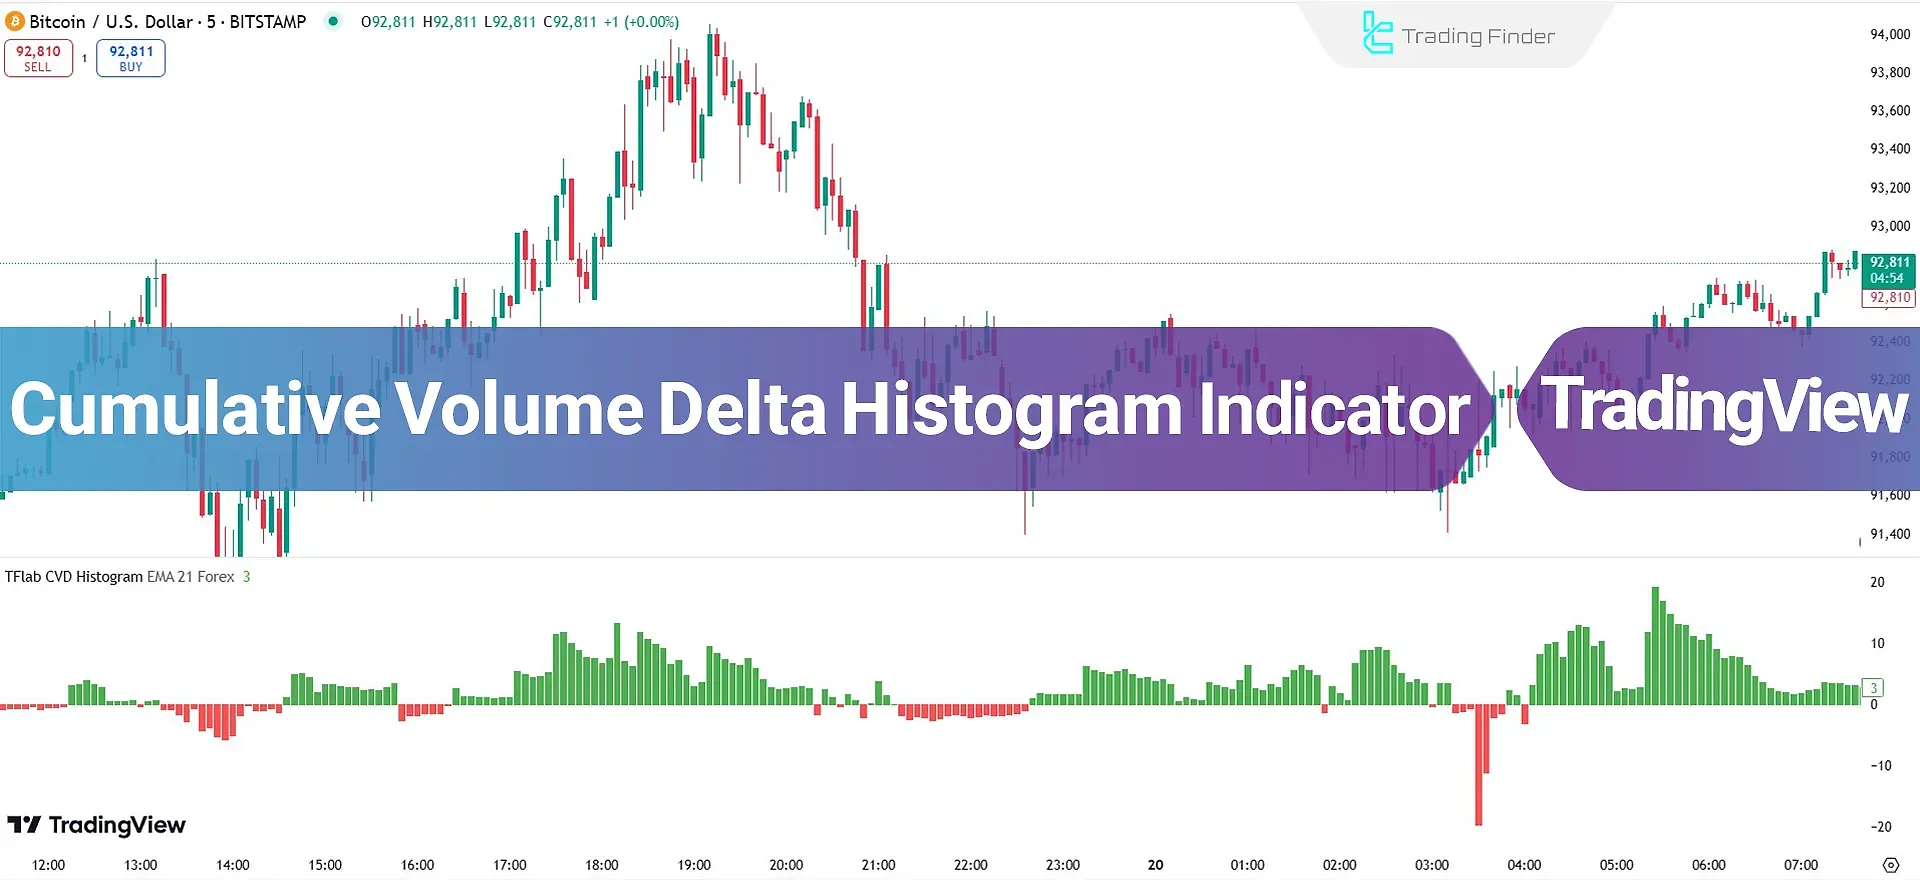
CVD Histogram Indicator, one of the advanced tools among TradingView oscillators, is used to measure the balance of power between buyers and sellers in the market.
This trading tool collects data such as the buy and sell trade volumes within each candlestick or time frame to precisely visualize market power dynamics.
The primary goal of this indicator is to identify Buy Pressure and Sell Pressure and their impact on prices.
The "CVD Histogram" indicator operates cumulatively, meaning that the difference in buy and sell volumes for each candlestick is calculated and sequentially added to the previous candlestick’s value.
Specifications Table for the Cumulative Volume Delta Histogram Indicator
Indicator Categories: | Oscillators Tradingview Indicators Currency Strength Tradingview Indicators Trading Assist Tradingview Indicators |
Platforms: | Trading View Indicators |
Trading Skills: | Intermediate |
Indicator Types: | Lagging Tradingview Indicators Leading Tradingview Indicators |
Timeframe: | Multi-Timeframe Tradingview Indicators |
Trading Style: | Day Trading Tradingview Indicators |
Trading Instruments: | TradingView Indicators in the Forex Market Cryptocurrency Tradingview Indicators Stock Tradingview Indicators |
Overview of the Indicator
The Cumulative Volume Delta Histogram (CVD Histogram) is a practical tool that appears as a bar chart (histogram) in a separate window below the main chart.
Green bars represent the dominance of buy volume over sell volume, with taller bars indicating stronger buyer power, while red bars signify the dominance of sell volume over buy volume, with taller bars reflecting increased selling pressure and greater seller strength.
This indicator functions cumulatively by calculating the difference between buy and sell volumes for each candlestick and sequentially adding it to the value of the previous candlestick, providing a continuous view of market power dynamics.
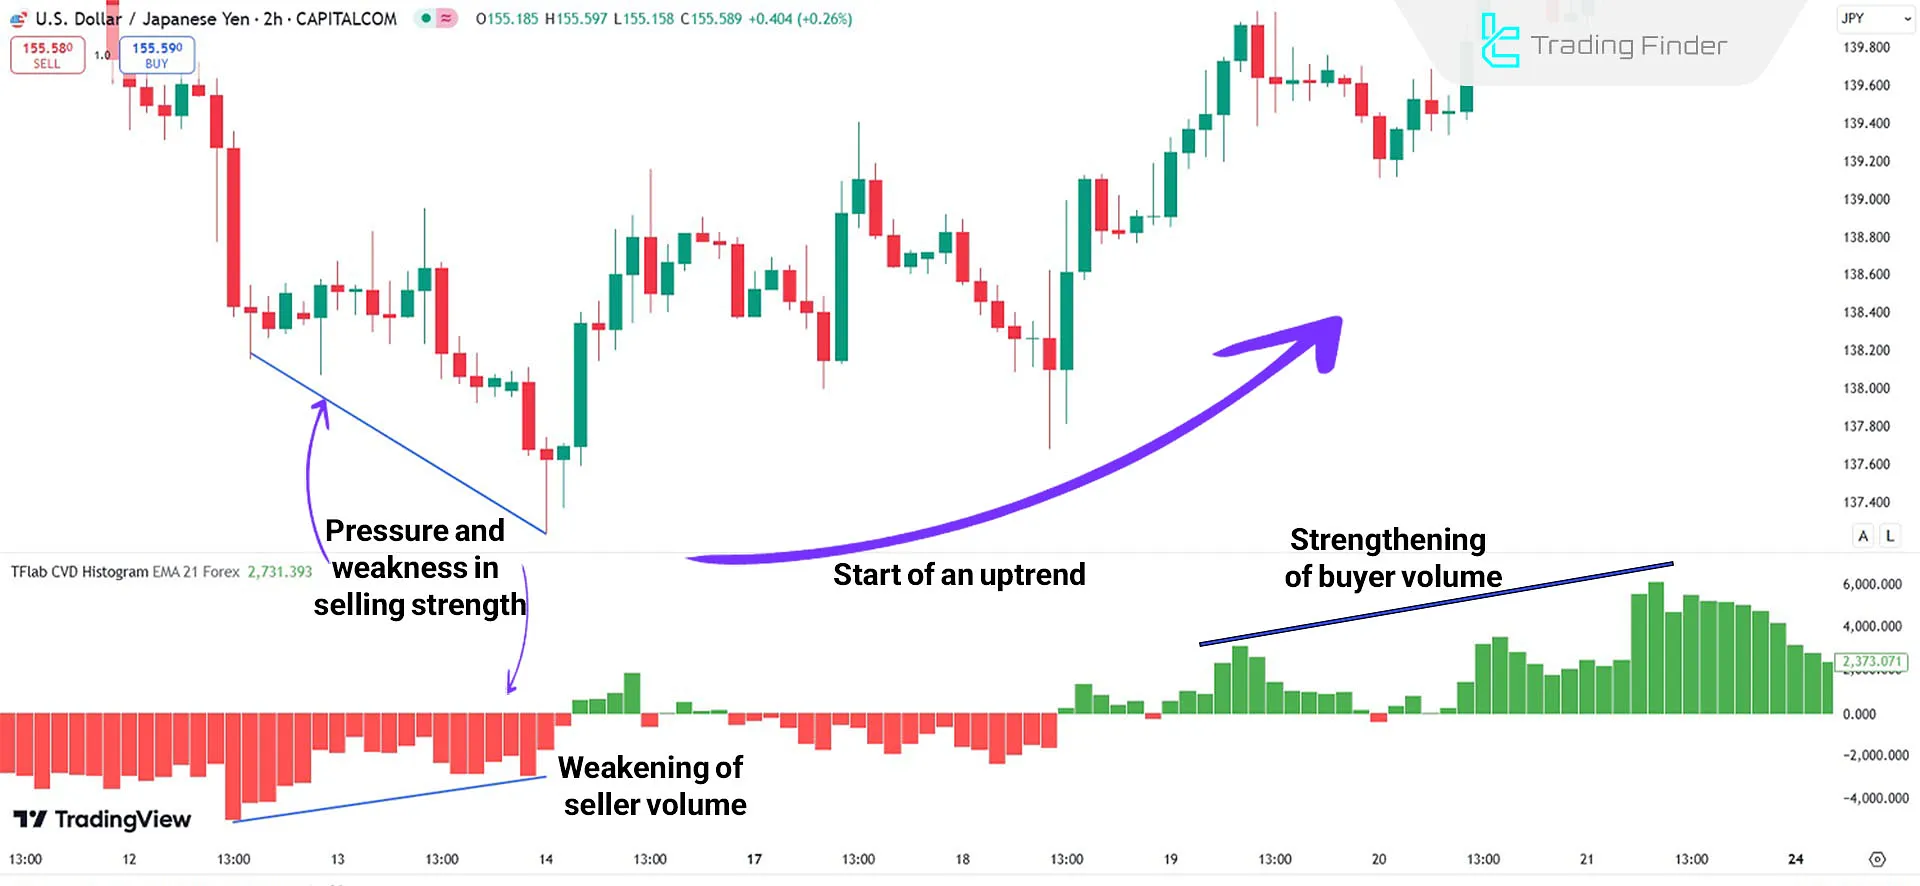
Indicators in Bullish Trends
In the USD/JPY price chart on a 2-hour time frame, the height of red bars in the Cumulative Volume Delta Histogram (CVD Histogram) decreases.
This decline in red bar height indicates a weakening of seller strength. As sellers lose dominance, buyers gradually take control of the market, halting the downward trend and initiating an upward movement, where buyers’ growing strength pushes the price higher.
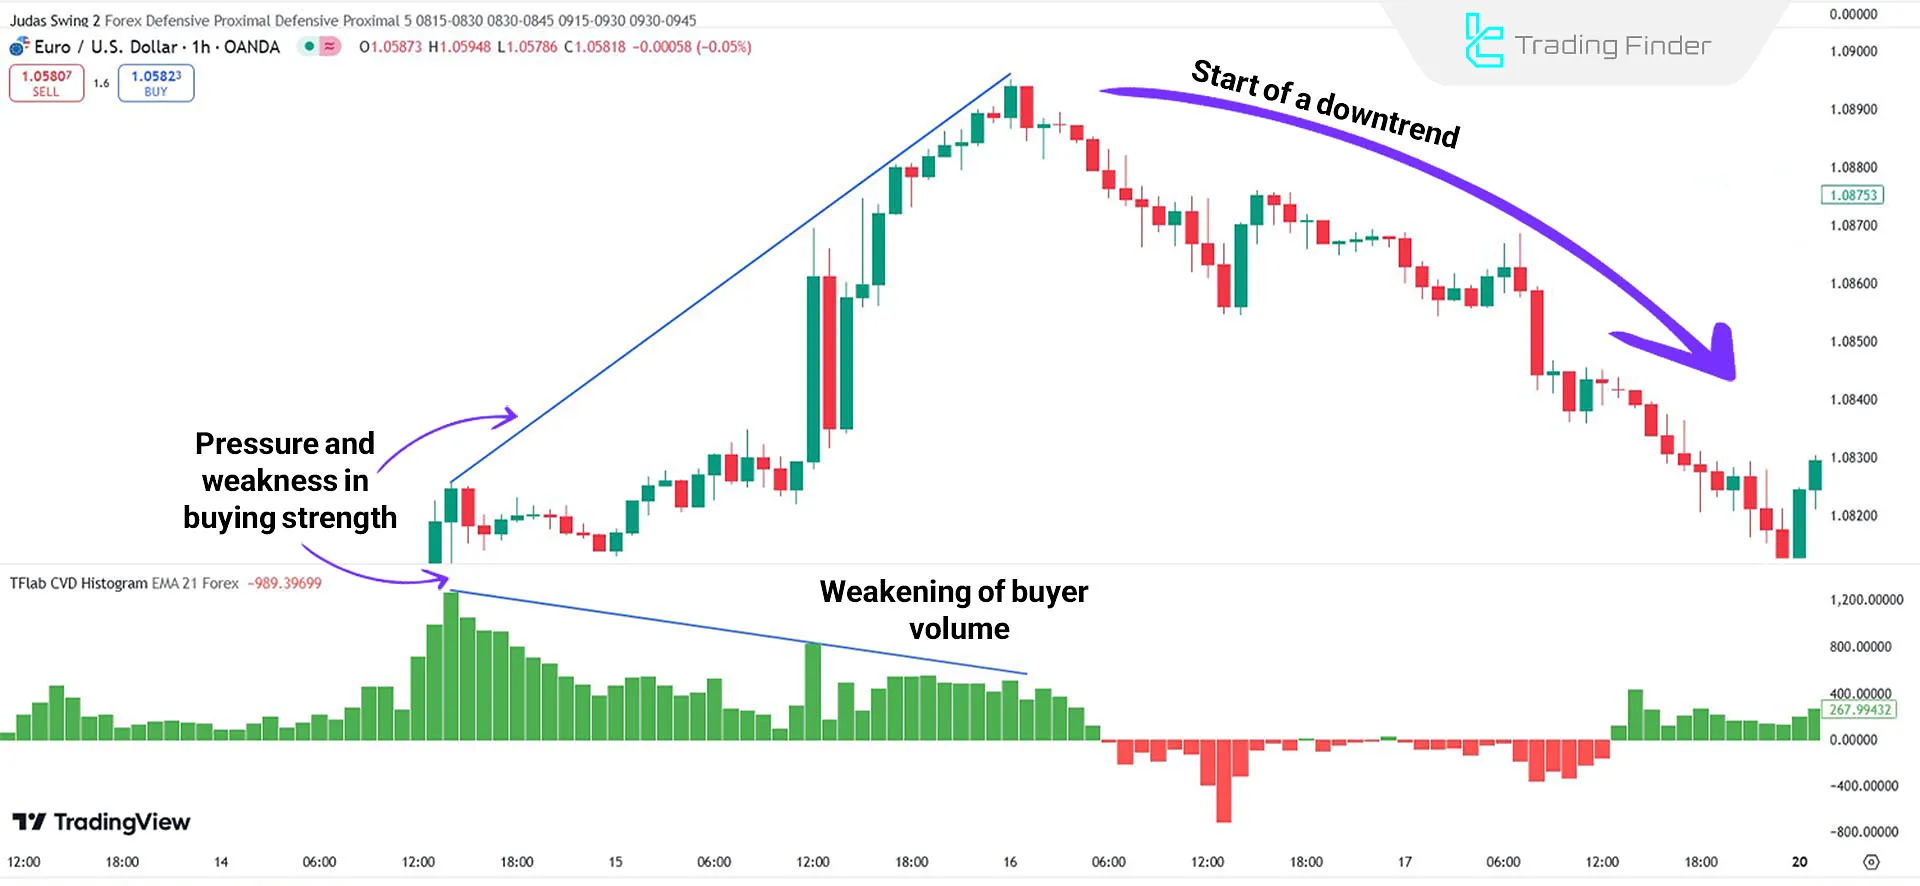
Indicators in Bearish Trends
In the EUR/USD price chart on a 1-hour time frame, the height of green bars in the Cumulative Volume Delta Histogram (CVD Histogram) gradually decreases.
This reduction signals a weakening of buyer strength and a drop in buy pressure in the market.
As buyers lose dominance, sellers take control of the market, halting the upward trend and forming a downward movement.
Indicator Settings
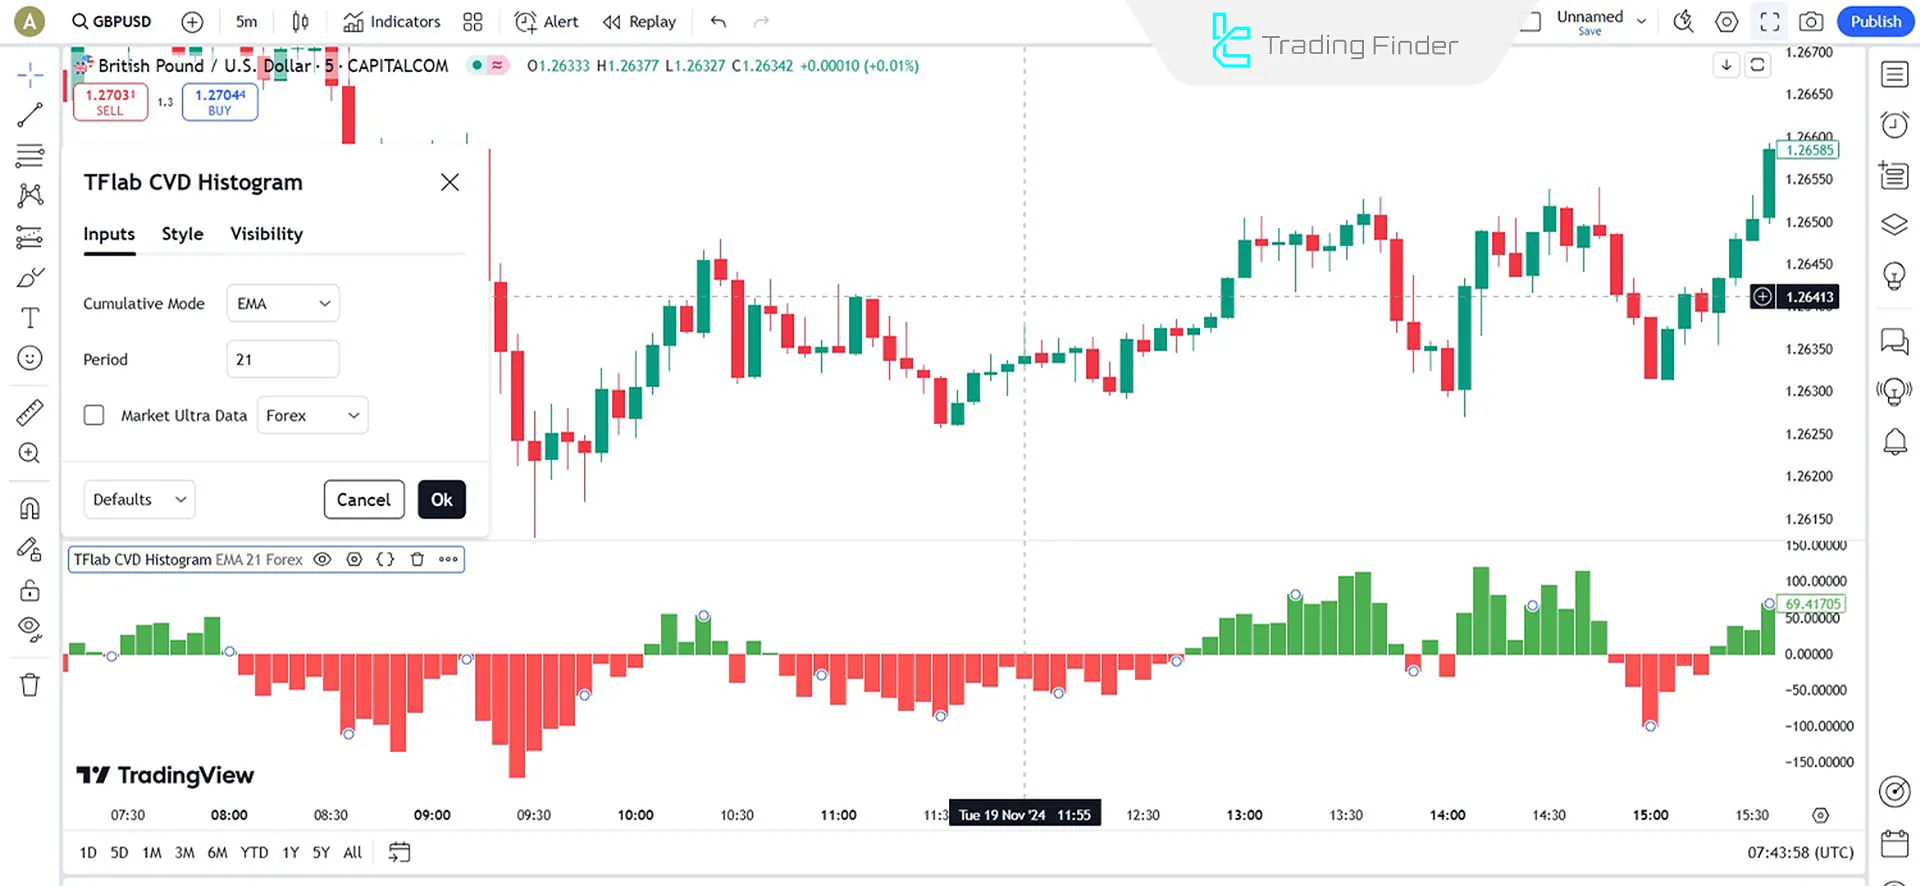
- Cumulative Mode: Displays data in cumulative form;
- Period: The period used to calculate the indicator’s data;
- Market Ultra Data: Advanced market data for more precise analysis.
Conclusion
The Cumulative Volume Delta Histogram (CVD Histogram) indicator is a powerful tool among TradingView indicators, used for analyzing trading volume and its impact on price movements.
This indicator helps traders more accurately identify trend reversal points and examine the strengths or weaknesses of buyers and sellers in the forex market.
Cumulative Volume Delta Histogram TradingView PDF
Cumulative Volume Delta Histogram TradingView PDF
Click to download Cumulative Volume Delta Histogram TradingView PDFWhat do the green and red bars in this indicator signify?
Green bars indicate the dominance of buy volume over sell volume and represent buyer strength.
Red bars signify the dominance of sell volume over buy volume and represent seller strength.
What is the CVD Histogram?
An indicator for analyzing the balance between buyers and sellers and examining buy and sell pressures.


