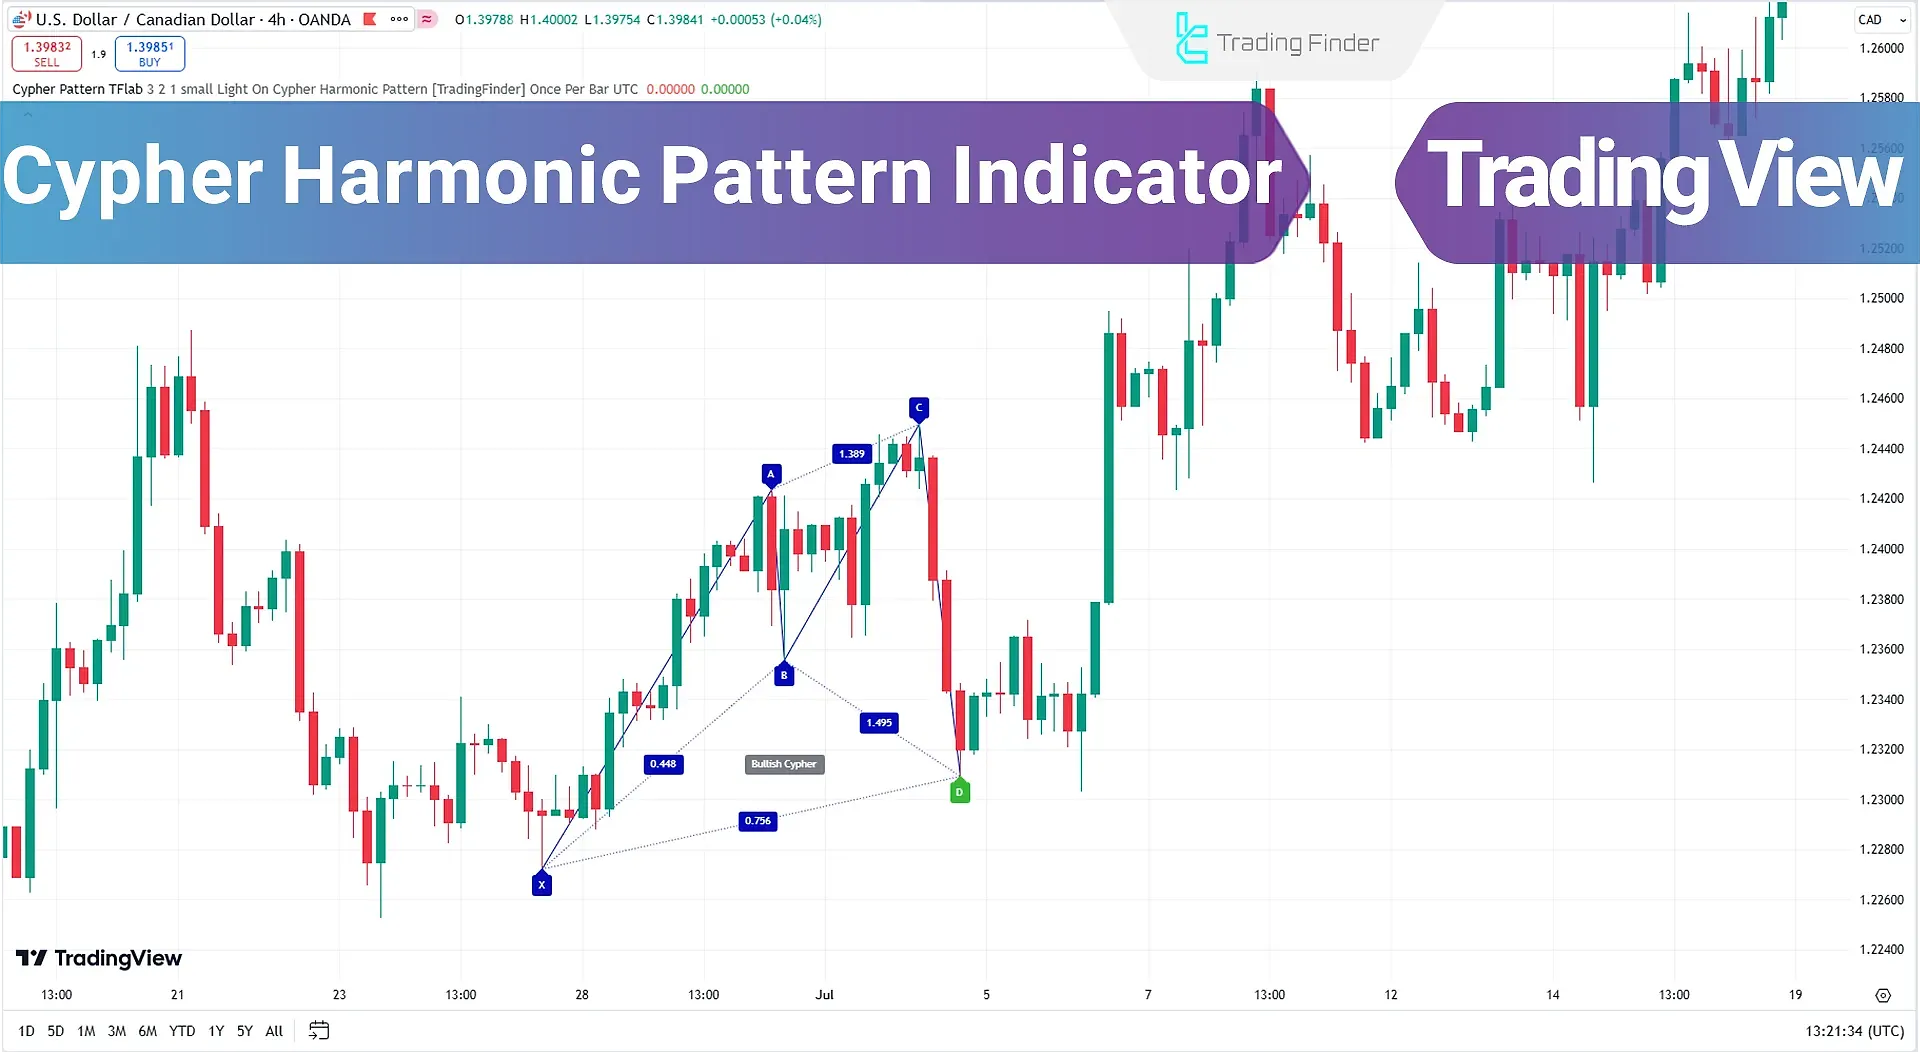
The Cypher Harmonic Pattern Indicator is a powerful and precise tool for identifying price reversals on the TradingView platform.
The Cypher pattern is one of the most advanced Trading view harmonic patterns Indicator, using Fibonacci ratios and geometric price analysis to pinpoint reversal points accurately.
The pattern consists of five points: X, A, B, C, and D, with the Potential Reversal Zone (PRZ) located between Fibonacci levels 0.768 and 0.886.
- Bullish Cypher: Indicates a return to an uptrend after a correction;
- Bearish Cypher: Predicts a price decline after a temporary rise.

Widely popular among professional traders, this pattern is used to determine precise entry and exit points.
Indicator Table
Indicator Categories: | Signal & Forecast Tradingview Indicators Trading Assist Tradingview Indicators Harmonic Tradingview Indicators |
Platforms: | Trading View Indicators |
Trading Skills: | Intermediate |
Indicator Types: | Reversal Tradingview Indicators Leading Tradingview Indicators Entry & Exit TradingView Indicators |
Timeframe: | M1-M5 Time Tradingview Indicators M30-M15 Time Tradingview Indicators |
Trading Style: | Intraday Tradingview Indicators Day Trading Tradingview Indicators Scalper Tradingview Indicators |
Trading Instruments: | TradingView Indicators in the Forex Market Cryptocurrency Tradingview Indicators Indices Tradingview Indicators |
Bullish Cypher Pattern

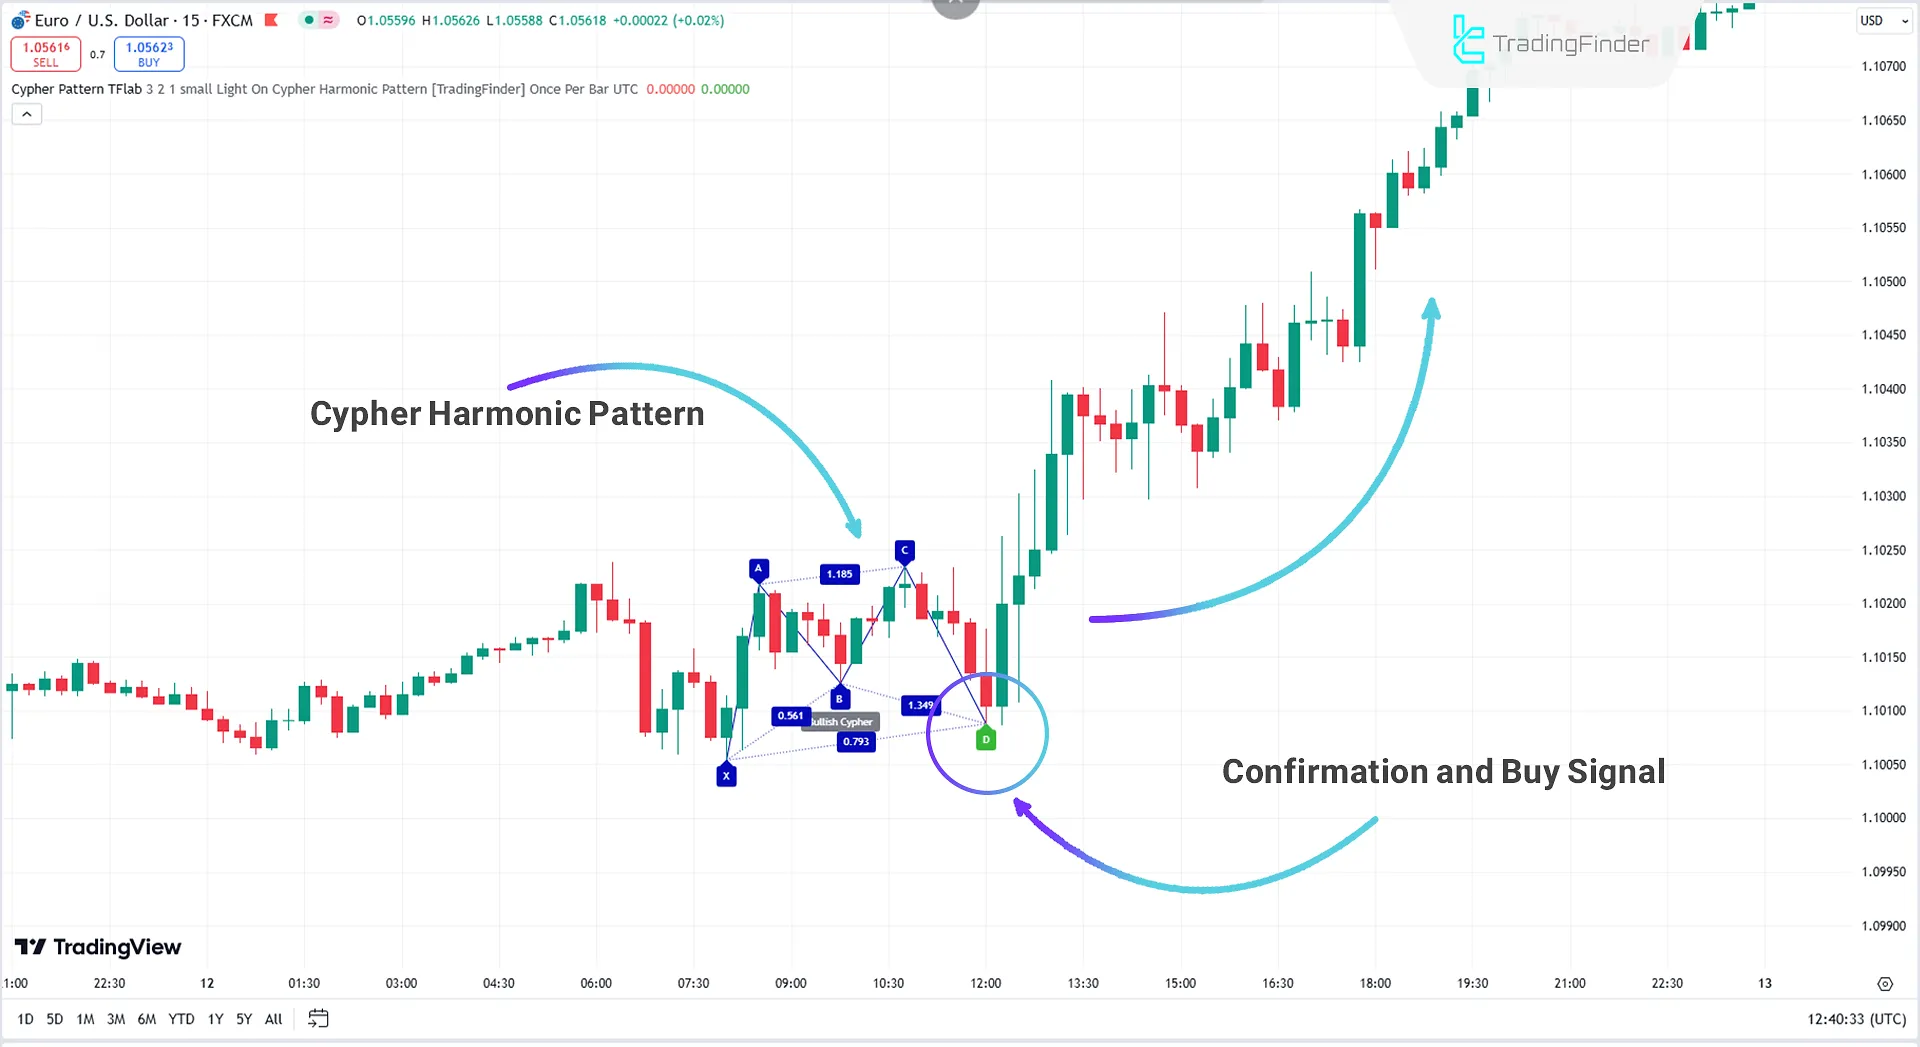
In the 15-minute EUR/USD chart, the Cypher Harmonic Pattern Indicator detects the pattern and plots the corresponding lines on the chart.
Upon completing the pattern, the TradingView indicator issues a buy signal. Traders can use this signal to enter a long position. After the green buy signal is generated, the price enters an uptrend, moving upward.
This tool assists traders in identifying potential trading opportunities promptly and benefiting from bullish market movements.
Bearish Cypher Pattern

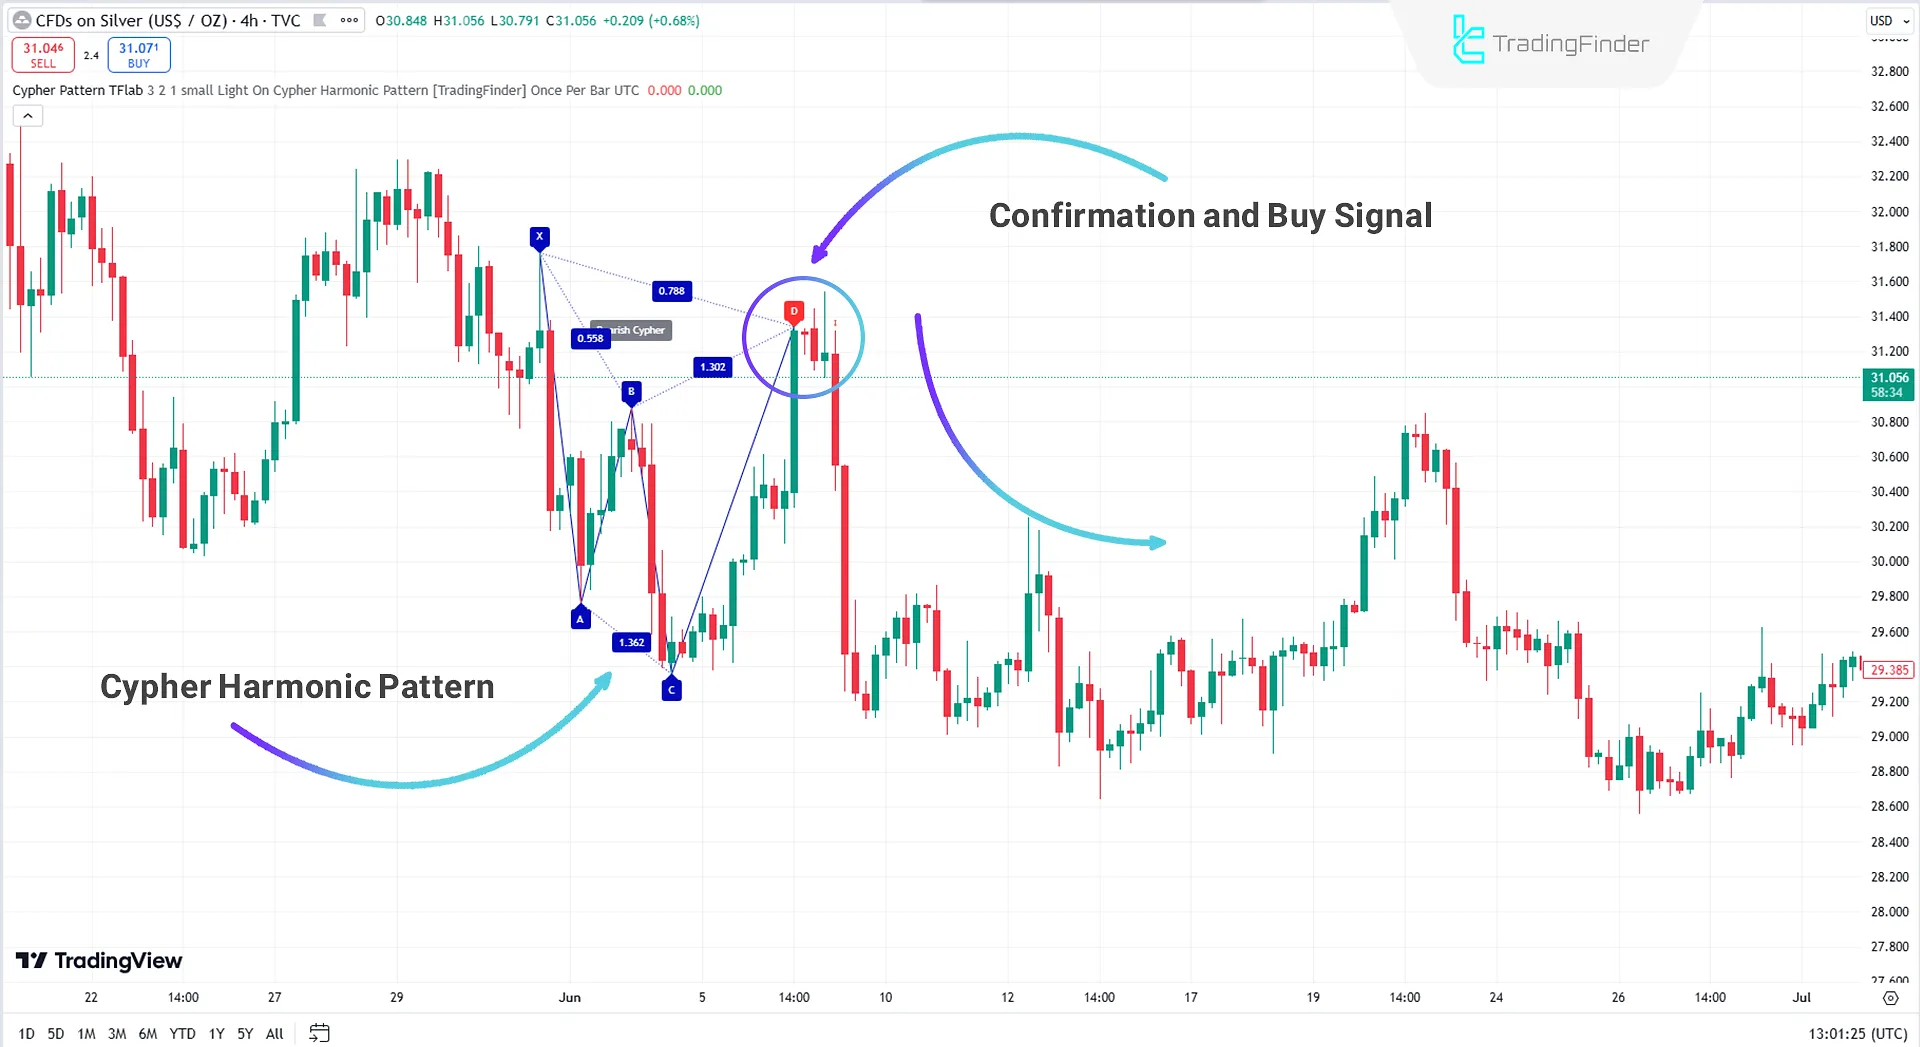
In the 4-hour SILVER chart, the Cypher Harmonic Pattern Indicator identifies a bearish Cypher pattern. Upon formation, the indicator issues a sell signal, allowing traders to enter short trades or exit existing positions.
In a bearish Cypher pattern, point D is the critical area for initiating sell positions, as prices are expected to decline after reaching this level.
To increase analysis confidence and reduce risk, traders can confirm the pattern using Technical analysis indicators such as RSI (Relative Strength Index) or MACD (Moving Average Convergence Divergence). Combining these tools can enhance the identification of entry and exit points.
Indicator Settings

Logical Settings:
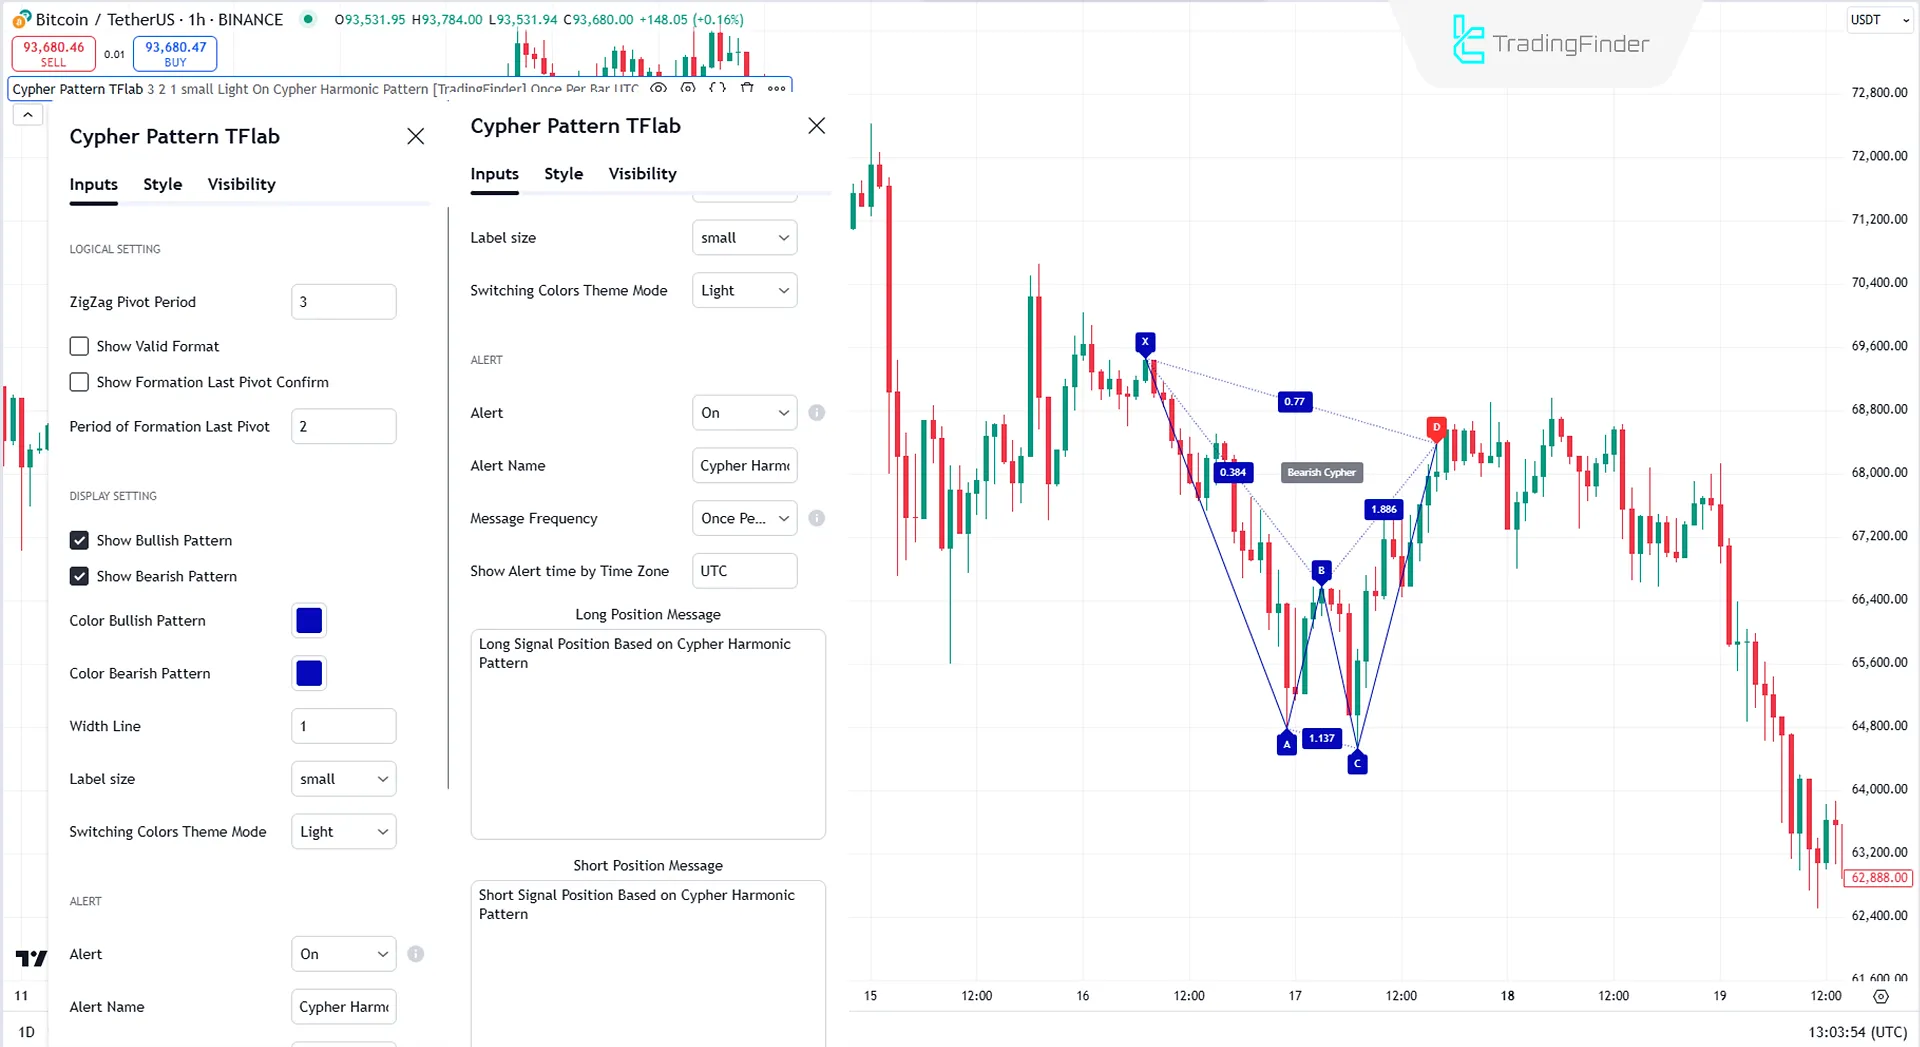
- ZigZag Pivot Period: Sets the number of candles for calculating ZigZag pivot points (default: 3);
- Show Valid Format: Displays only valid pattern formats;
- Show Formation Last Pivot Confirm: Enables confirmation for the last pivot point in the pattern;
- Period of Formation Last Pivot: Sets the number of candles to confirm the previous pivot point (default: 2).
Display Settings:
- Show Bullish Pattern: Displays bullish Cypher patterns;
- Show Bearish Pattern: Displays bearish Cypher patterns;
- Color Bullish Pattern: Sets the color for bullish patterns (default: blue);
- Color Bearish Pattern: Sets the color for bearish patterns (default: red);
- Width Line: Adjusts the thickness of pattern lines (default: 1);
- Label Size: Configures text size for labels (small, medium, large);
- Switching Colors Theme Mode: Select a light or dark theme.
Alert Settings:
- Alert: Activates alerts for detected patterns;
- Alert Name: Customizable alert name (default: Cypher Harmonic);
- Message Frequency: Defines alert frequency (Once Per Bar, Continuously);
- Show Alert Time by Time Zone: Displays alert time based on the selected time zone (default: UTC).
Position Messages:
- Long Position Message: Sends a message for bullish Cypher positions;
- Short Position Message: Sends a message for bearish Cypher positions.
Conclusion
TheCypher Harmonic Pattern Indicator is a powerful technical analysis tool that helps traders accurately identify trend reversal points. By detecting the Cypher pattern on the chart, the indicator provides buy or sell signals, allowing traders to optimize their strategies.
As one of the most precise harmonic patterns, the Cypher pattern is highly effective in identifying reversal points, particularly within the Potential Reversal Zone (PRZ). Its accuracy enables traders to pinpoint precise entry and exit points.
Cypher Harmonic Pattern TradingView PDF
Cypher Harmonic Pattern TradingView PDF
Click to download Cypher Harmonic Pattern TradingView PDFWhat is the Cypher Harmonic Pattern?
The Cypher Harmonic Pattern is an advanced technical analysis pattern that utilizes Fibonacci ratios and geometric structures to identify price reversal points. This pattern consists of five key points (X, A, B, C, D) and aids in identifying optimal entry and exit times in trading.
What are the two types of Cypher patterns?
The Cypher pattern is divided into two types:
- Bullish Cypher: Appears as an “M” on the chart and indicates a return to an uptrend after a correction.
- Bearish Cypher: Appears as a “W” on the chart and predicts a price decline following a temporary rise.


