TradingView
MetaTrader4
MetaTrader5
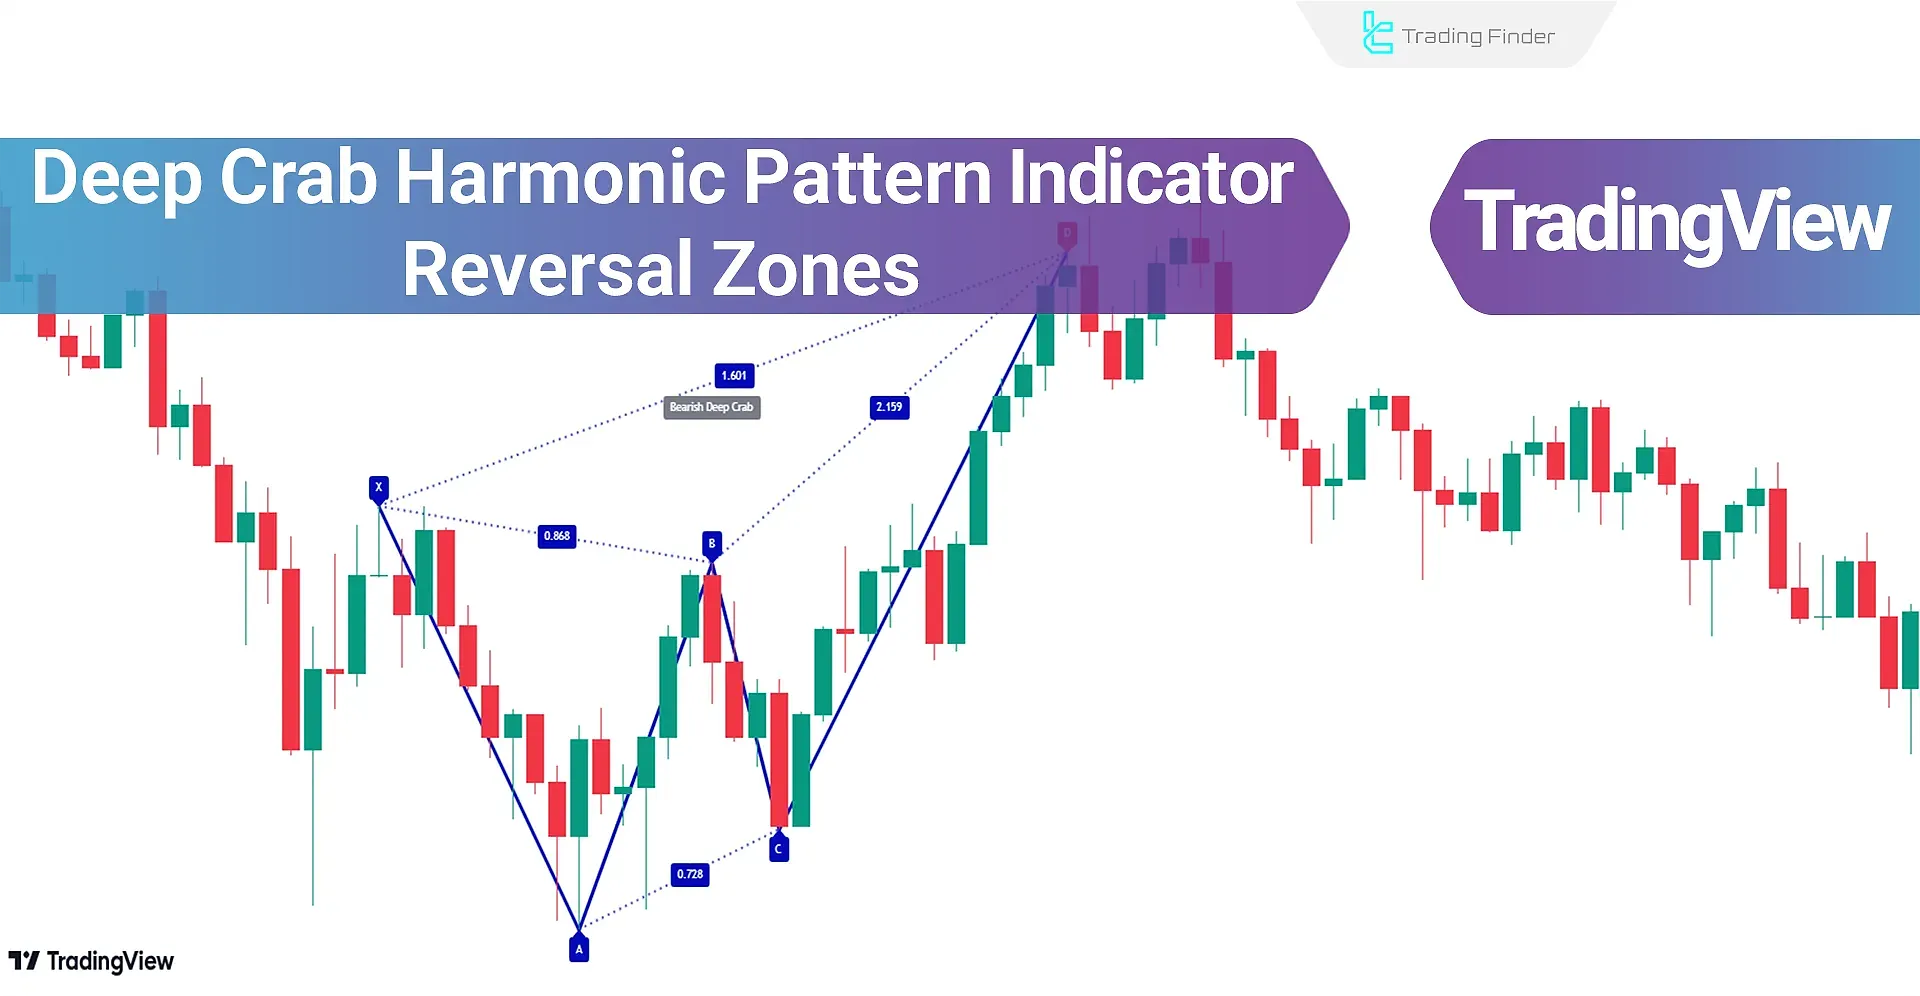
TheDeep Crab Harmonic Pattern Indicator is a practical tool with a five-point structure (X-A-B-C-D) available on the TradingView platform, used to identify market reversal points.

This harmonic indicator utilizes Fibonacci ratios to form the Deep Crab Pattern, serving as a guide for identifying entry and exit points in trades.
Specifications Table of the Deep Crab Harmonic Pattern Indicator
Indicator Categories: | Signal & Forecast Tradingview Indicators Harmonic Tradingview Indicators Chart & Classic Tradingview indicators |
Platforms: | Trading View Indicators |
Trading Skills: | Intermediate |
Indicator Types: | Reversal Tradingview Indicators |
Timeframe: | Multi-Timeframe Tradingview Indicators |
Trading Style: | Intraday Tradingview Indicators |
Trading Instruments: | TradingView Indicators in the Forex Market Cryptocurrency Tradingview Indicators Stock Tradingview Indicators Commodity Tradingview Indicators Share Stocks Tradingview Indicators |
Overview of the Deep Crab Harmonic Indicator
The Deep Crab Pattern is a five-point harmonic structure (X-A-B-C-D). Its key feature is in point "B" which retraces 88.6% of the XA leg. Point "D" extends significantly beyond point "X" indicating a high probability of price reversal.
Bullish Trend Conditions
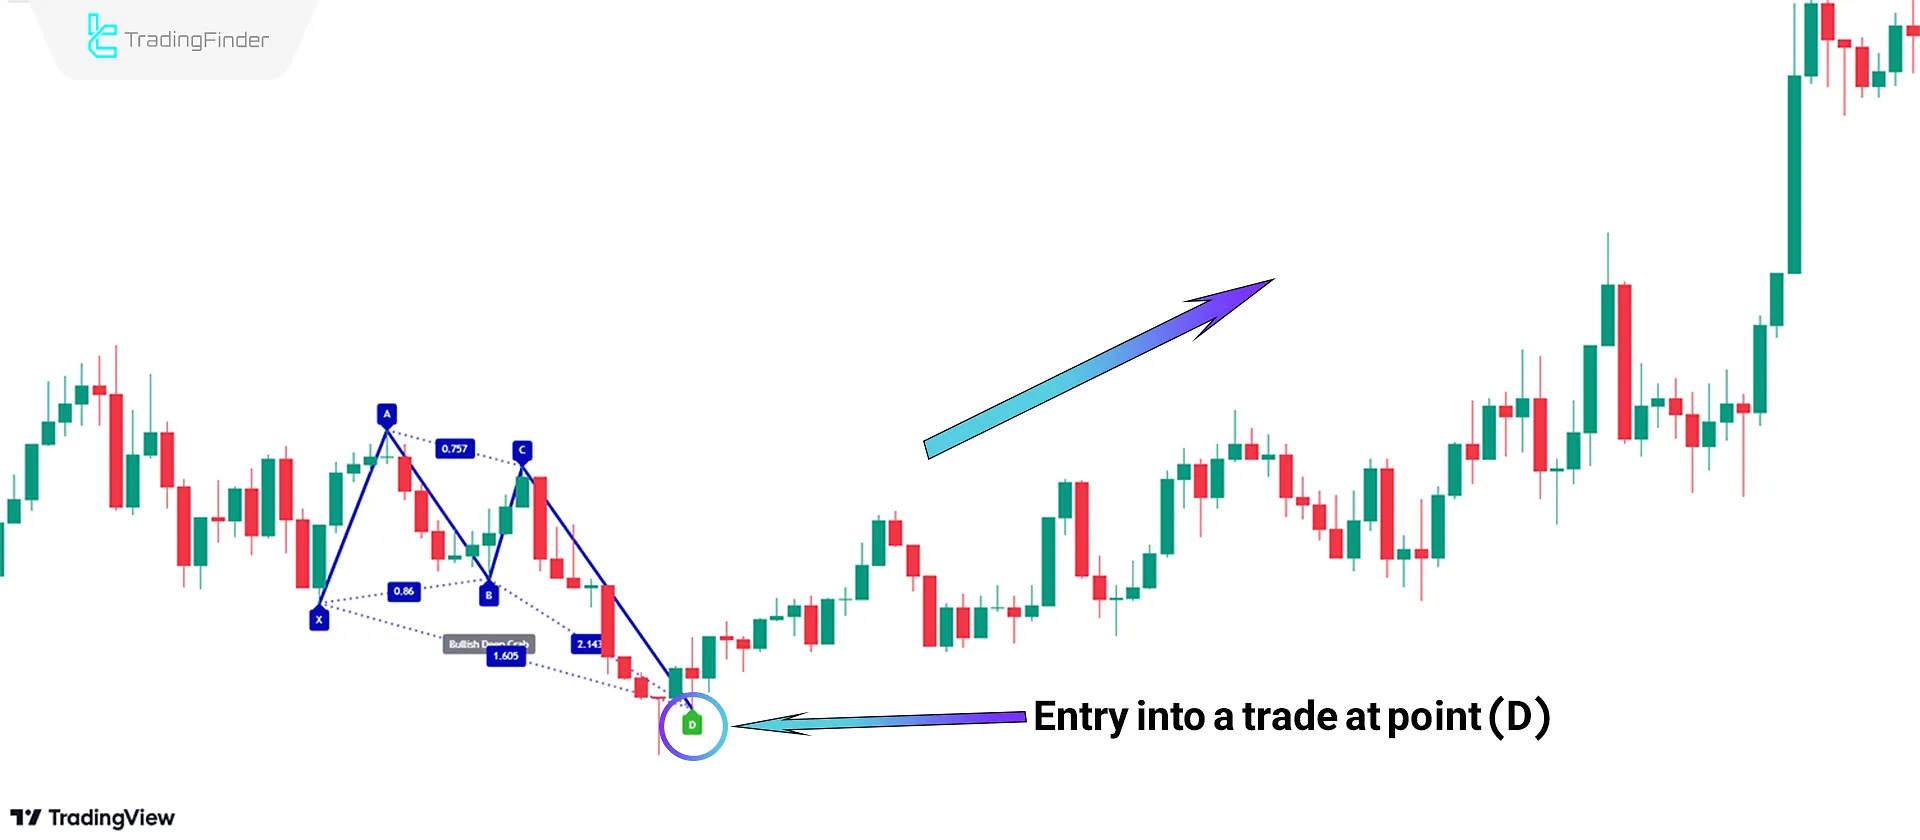
The price chart of Bitcoin (BTC) on a 15-minute timeframe demonstrates how the indicator operates under bullish trend conditions.
As shown in the image, the price decreases to point D and enters the PRZ (Potential Reversal Zone), signaling the end of the downtrend and the beginning of an uptrend.
In such conditions, traders can consider point D (marked in green) as a signal to enter long (buy) trades.

Bearish Trend Conditions
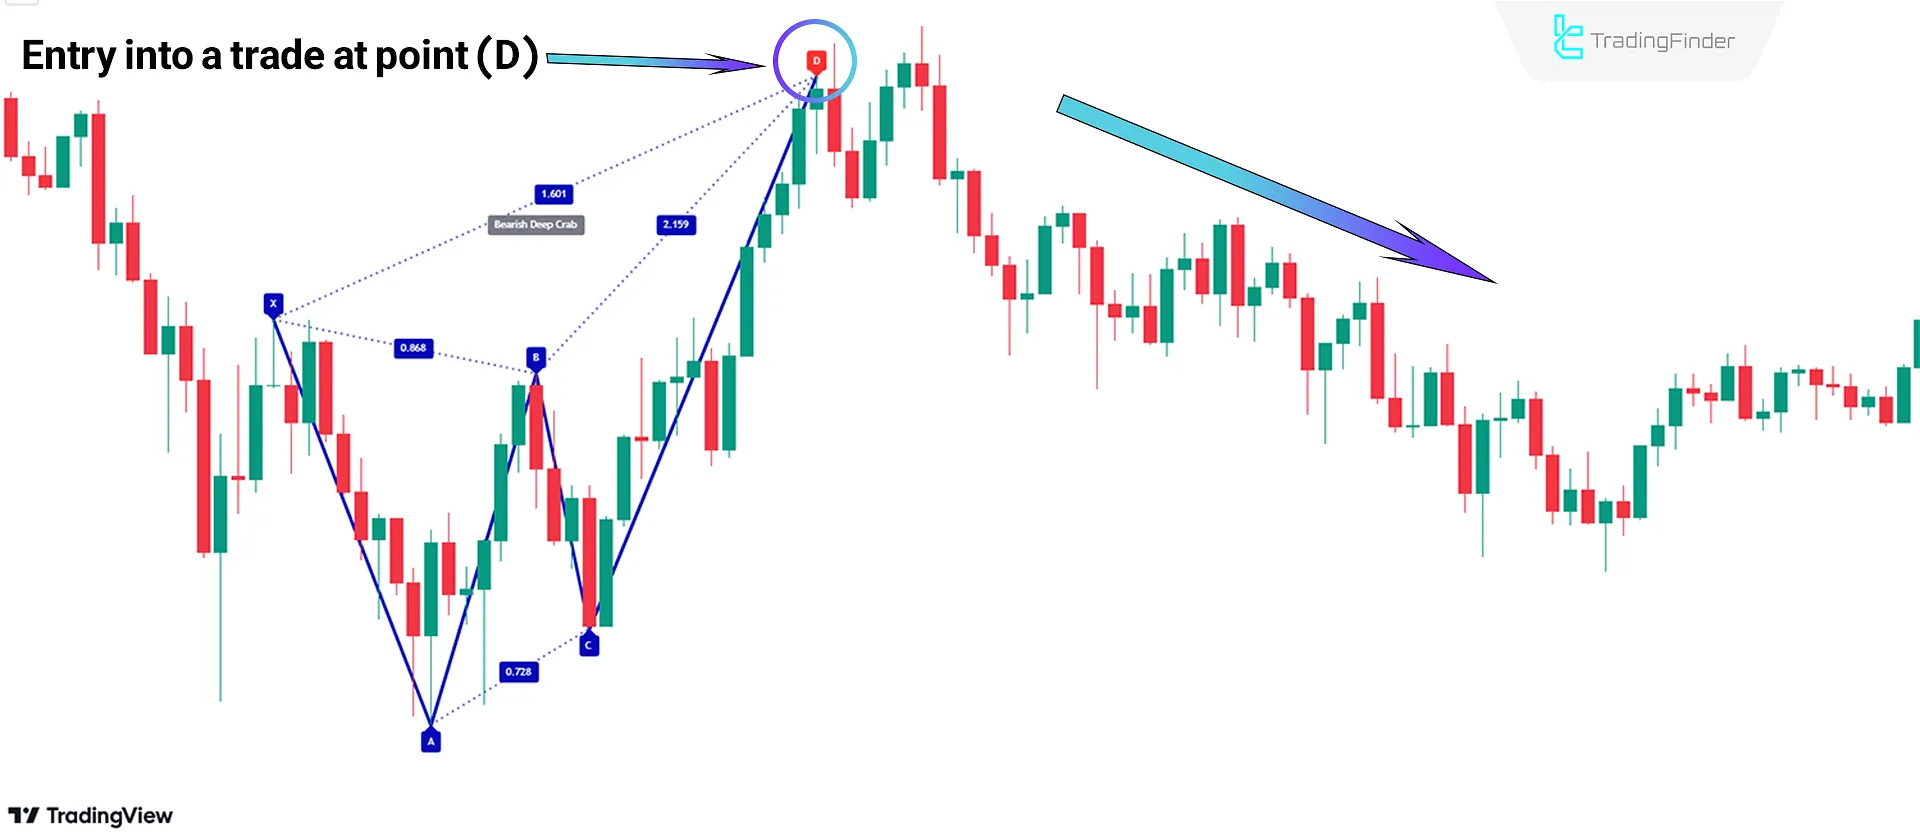
As shown in the EUR/USD price chart on a 5-minute timeframe, the price increases to point D and enters the PRZ (Potential Reversal Zone), signaling the end of the uptrend and the beginning of a downtrend.
In such conditions, traders can consider point D (marked in red) as a signal to enter short (sell) trades.

Indicator Settings

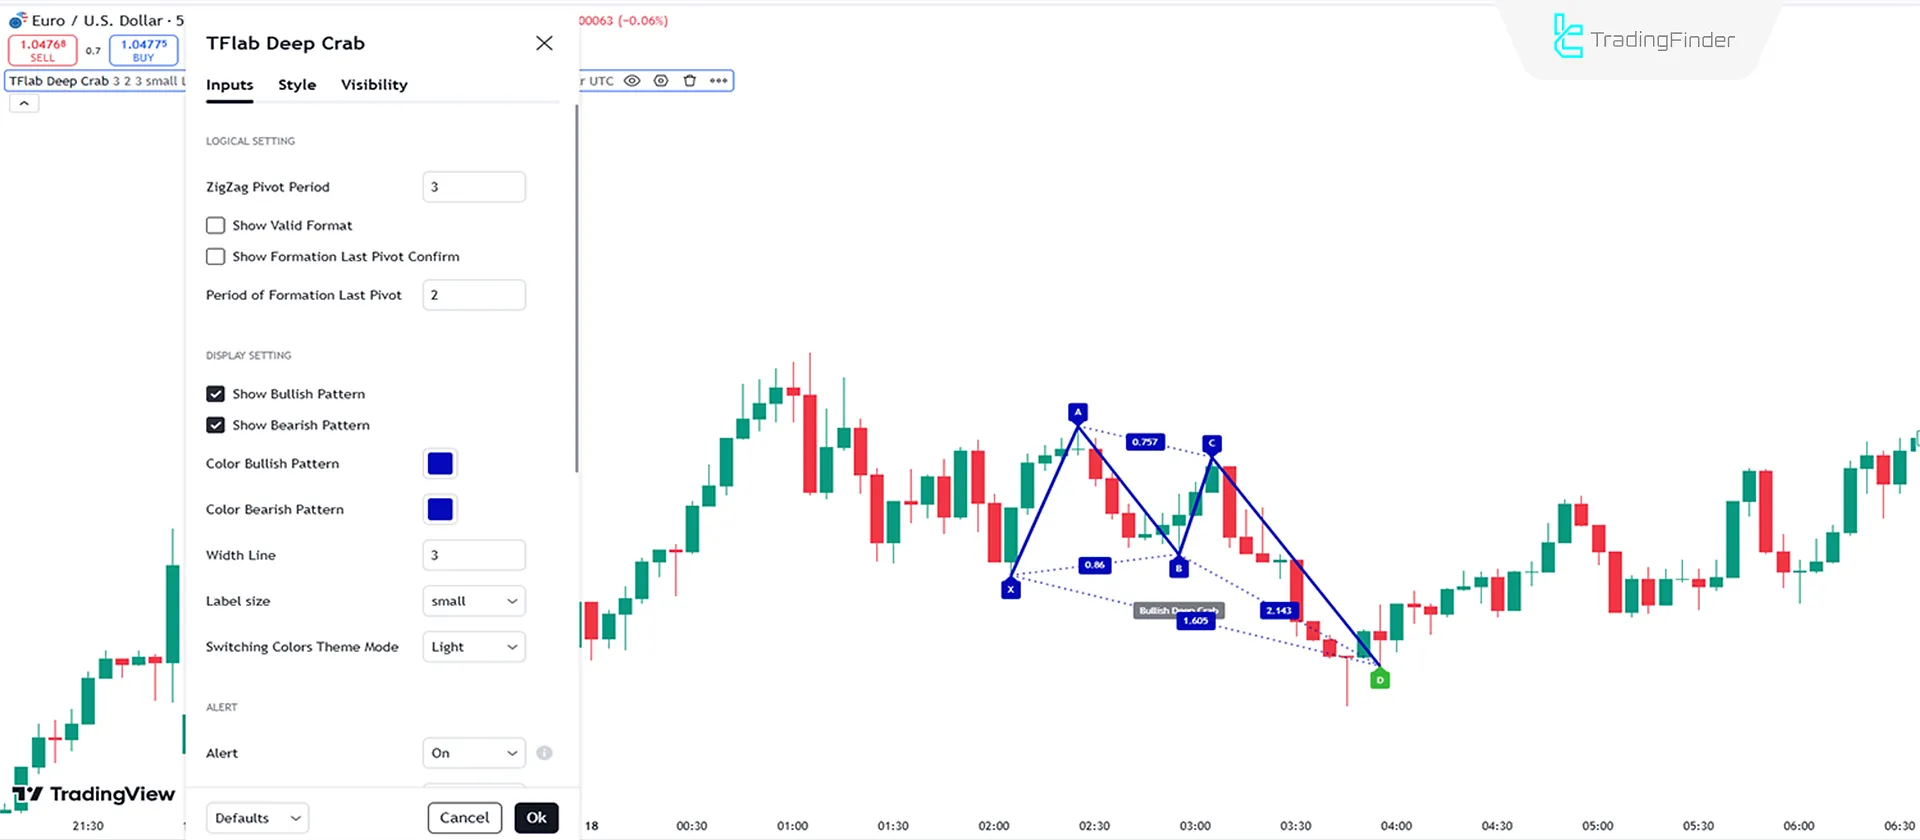
- ZigZag Pivot Period: Pivot period in the ZigZag structure, set to 3;
- Show Valid Format: Display valid pattern formats;
- Show Formation Last Pivot Confirm: Confirm the last pivot point;
- Period of Formation Last Pivot: Number of candles for detecting the last point, set to 2;
- Show Bullish Pattern: Display bullish patterns;
- Show Bearish Pattern: Display bearish patterns;
- Color Bullish Pattern: Set the color for bullish patterns;
- Color Bearish Pattern: Set the color for bearish patterns;
- Width Line: Define the thickness of the pattern lines;
- Label Size: Set the label size (X-A-B-C-D);
- Switching Colors Theme Mode: Select the indicator’s color theme;
- Alert: Enable alerts;
- Alert Name: Name the alert;
- Message Frequency: Set the frequency of alert messages;
- Show Alert Time by Time Zone: Configure alert timing based on the time zone.
Conclusion
The Deep Crab Harmonic Pattern Indicator identifies PRZ (Potential Reversal Zones) using its five point structure (X-A-B-C-D) and Fibonacci ratios, helping traders make informed decisions for entering or exiting trades.
Using this indicator has a significant impact on trend analysis and identifying key reversal points. This tool falls under the category of classic pattern and chartingindicators and works without any limitations in all markets, Forex market, stock indices, cryptocurrencies, and commodities.
Deep Crab Harmonic Pattern TradingView PDF
Deep Crab Harmonic Pattern TradingView PDF
Click to download Deep Crab Harmonic Pattern TradingView PDFWhen is the Deep Crab Pattern complete?
The pattern is complete when the price reaches point D.
What does the Deep Crab Harmonic Pattern indicate about market trends?
This indicator visualizes the Deep Crab Harmonic Pattern and highlights market reversal points.


