


TradingView
MetaTrader4
MetaTrader5
The Expansion Triangle Indicator identifies and draws one of the practical patterns in technical analysis [triangle pattern] on the chart. This pattern typically forms during significant market volatility and trader uncertainty.
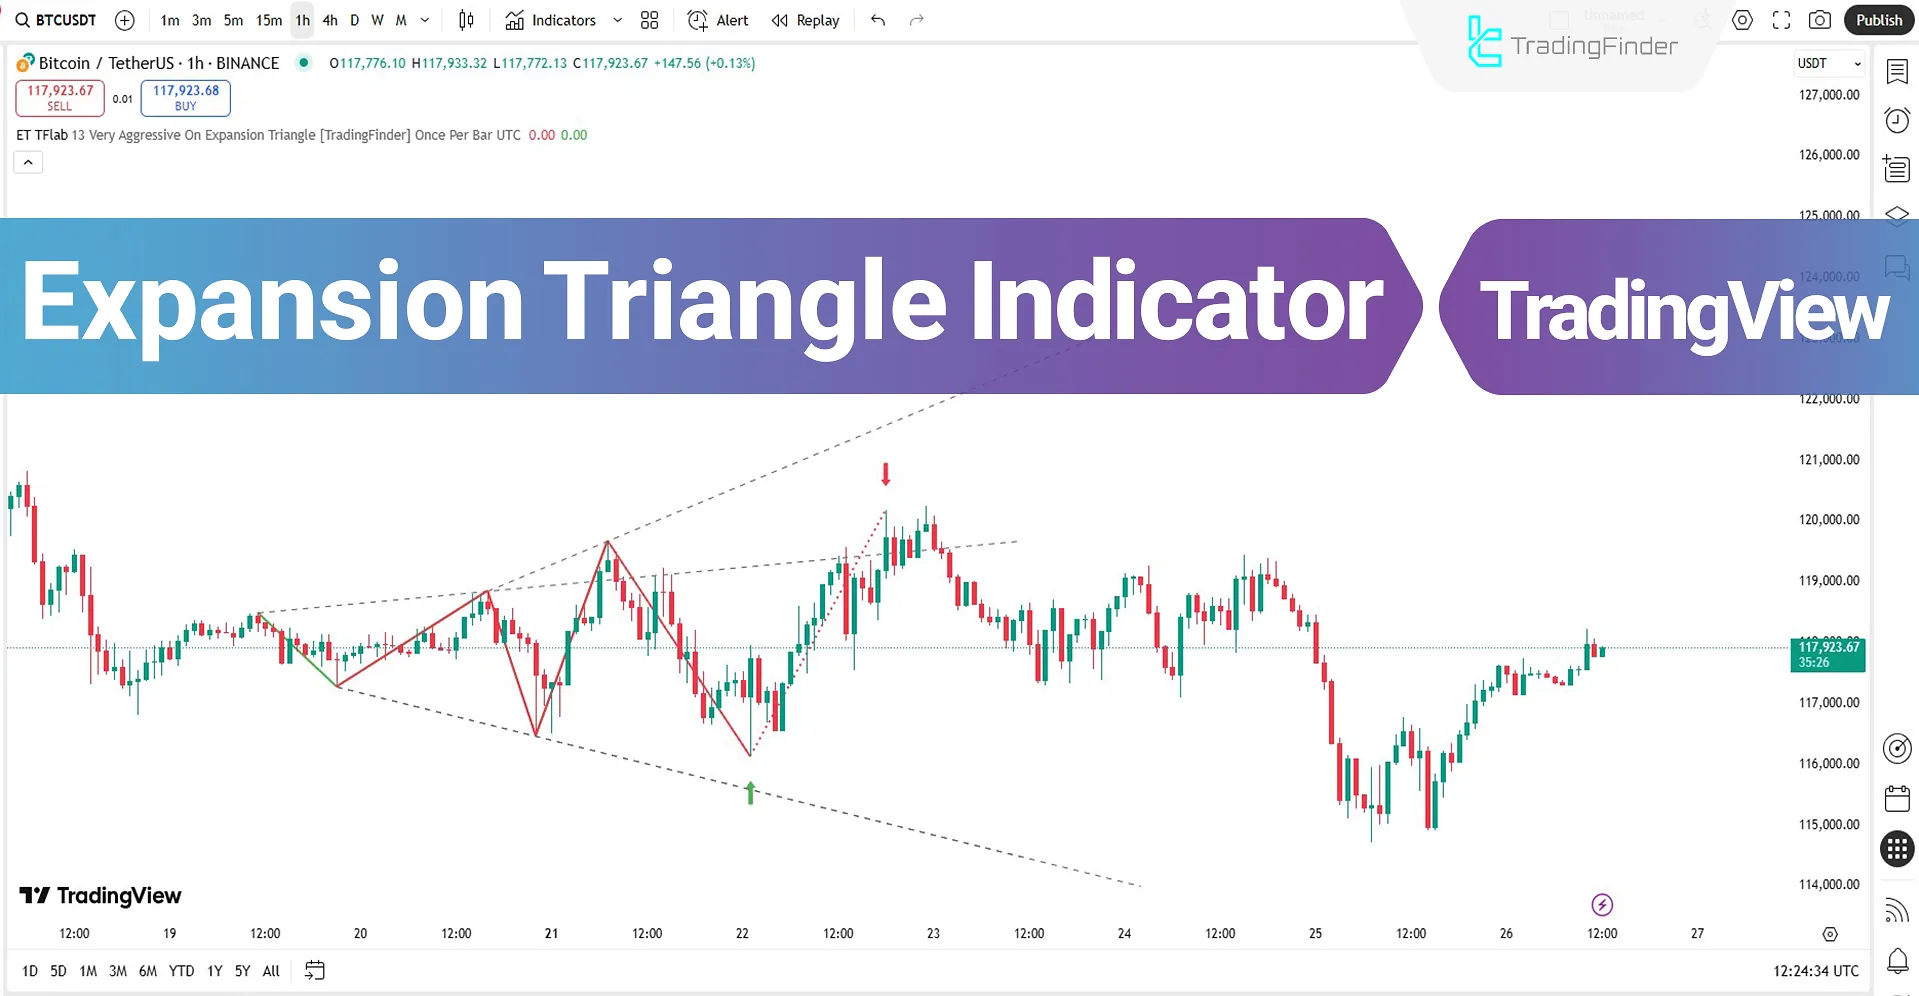
In this pattern, highs gradually become higher and lows become lower; as a result, the two main trendlines expand outward from one another.
Expansion Triangle Indicator Specifications Table
The table below outlines the specifications and features of the Expansion Triangle Indicator.
Indicator Categories: | Price Action Tradingview Indicators Signal & Forecast Tradingview Indicators Candle Sticks Tradingview Indicators |
Platforms: | Trading View Indicators |
Trading Skills: | Elementary |
Indicator Types: | Reversal Tradingview Indicators |
Timeframe: | Multi-Timeframe Tradingview Indicators |
Trading Style: | Day Trading Tradingview Indicators Scalper Tradingview Indicators Swing Trading Tradingview Indicators |
Trading Instruments: | TradingView Indicators in the Forex Market Cryptocurrency Tradingview Indicators Share Stocks Tradingview Indicators |
Expansion Triangle Indicator at a Glance
The Expansion Triangle Indicator detects the pattern upon formation and draws it on the chart using solid and dashed lines.
Additionally, this trading tool issues entry and exit signals upon the final interaction of the trend with the lines and the completion of the pattern, using green and red arrows.
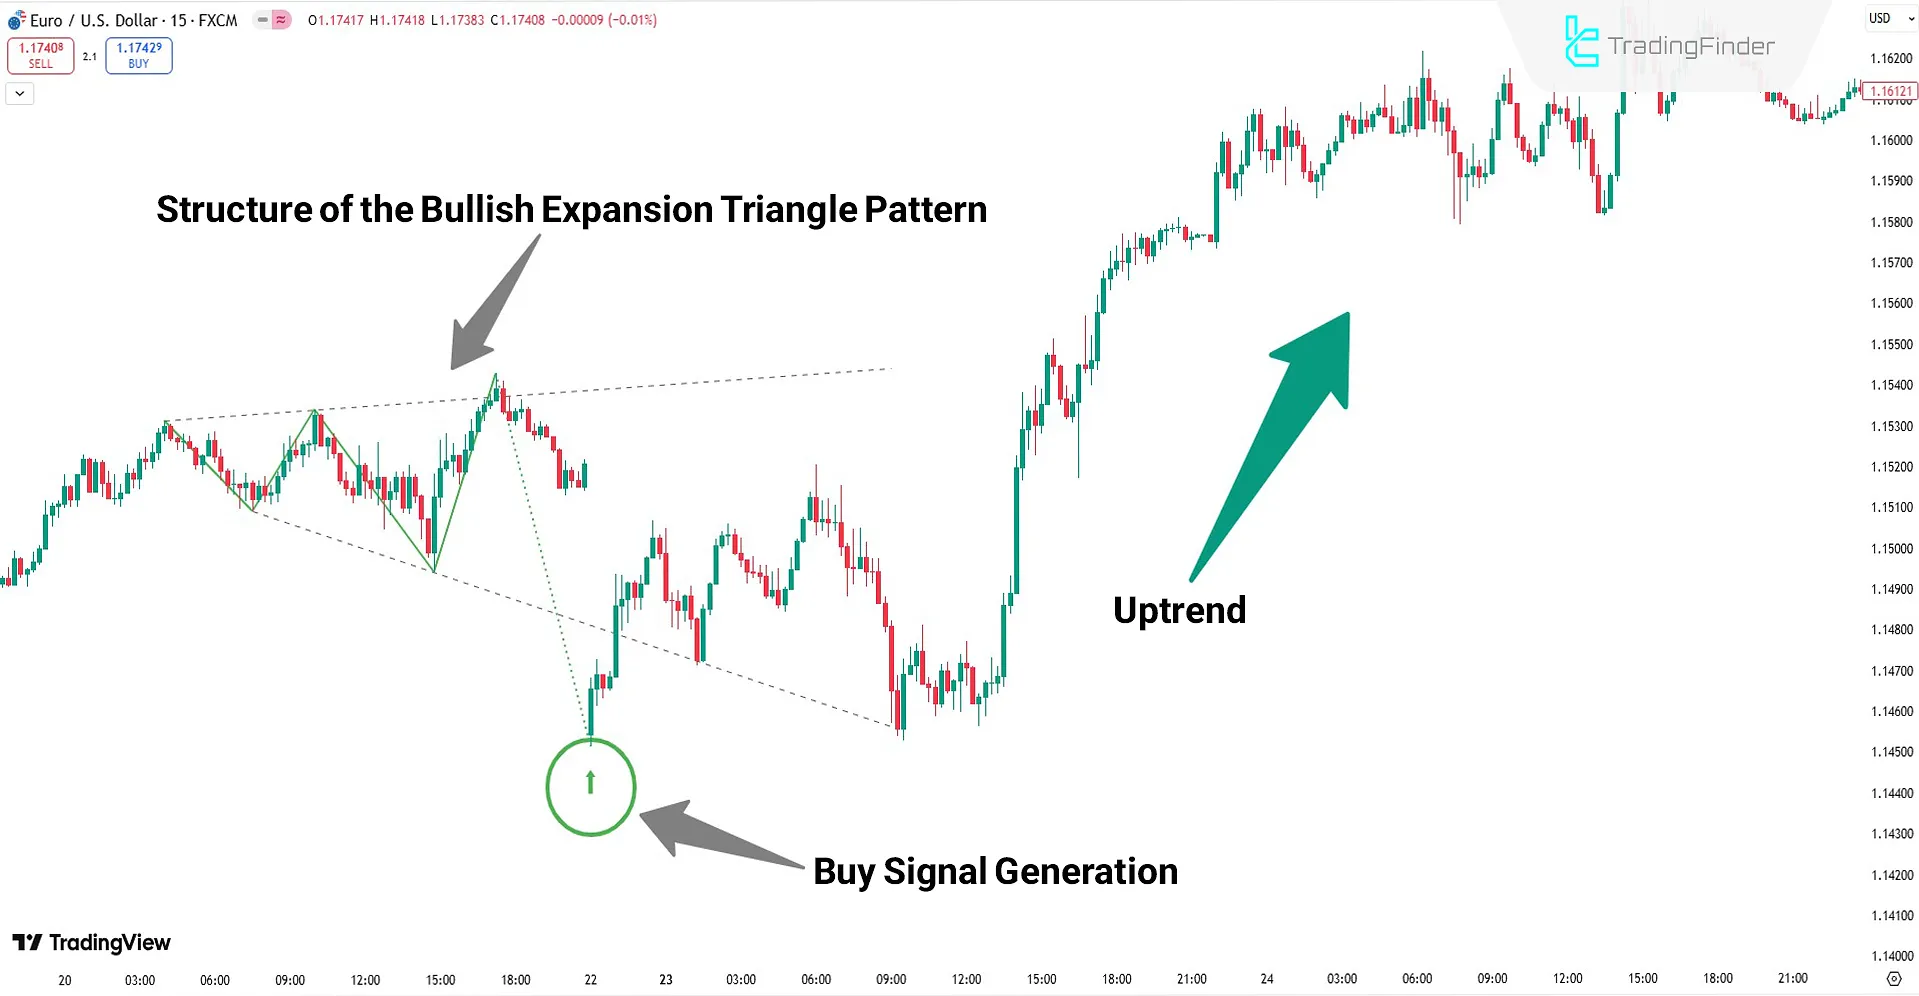
Buy Signal
Based on the analysis of the EUR/USD currency pair on the 15-minute timeframe, the expansion triangle pattern has been drawn by the indicator. Moreover, after the pattern completion, a buy signal is issued, representing a potential opportunity to enter an uptrend.
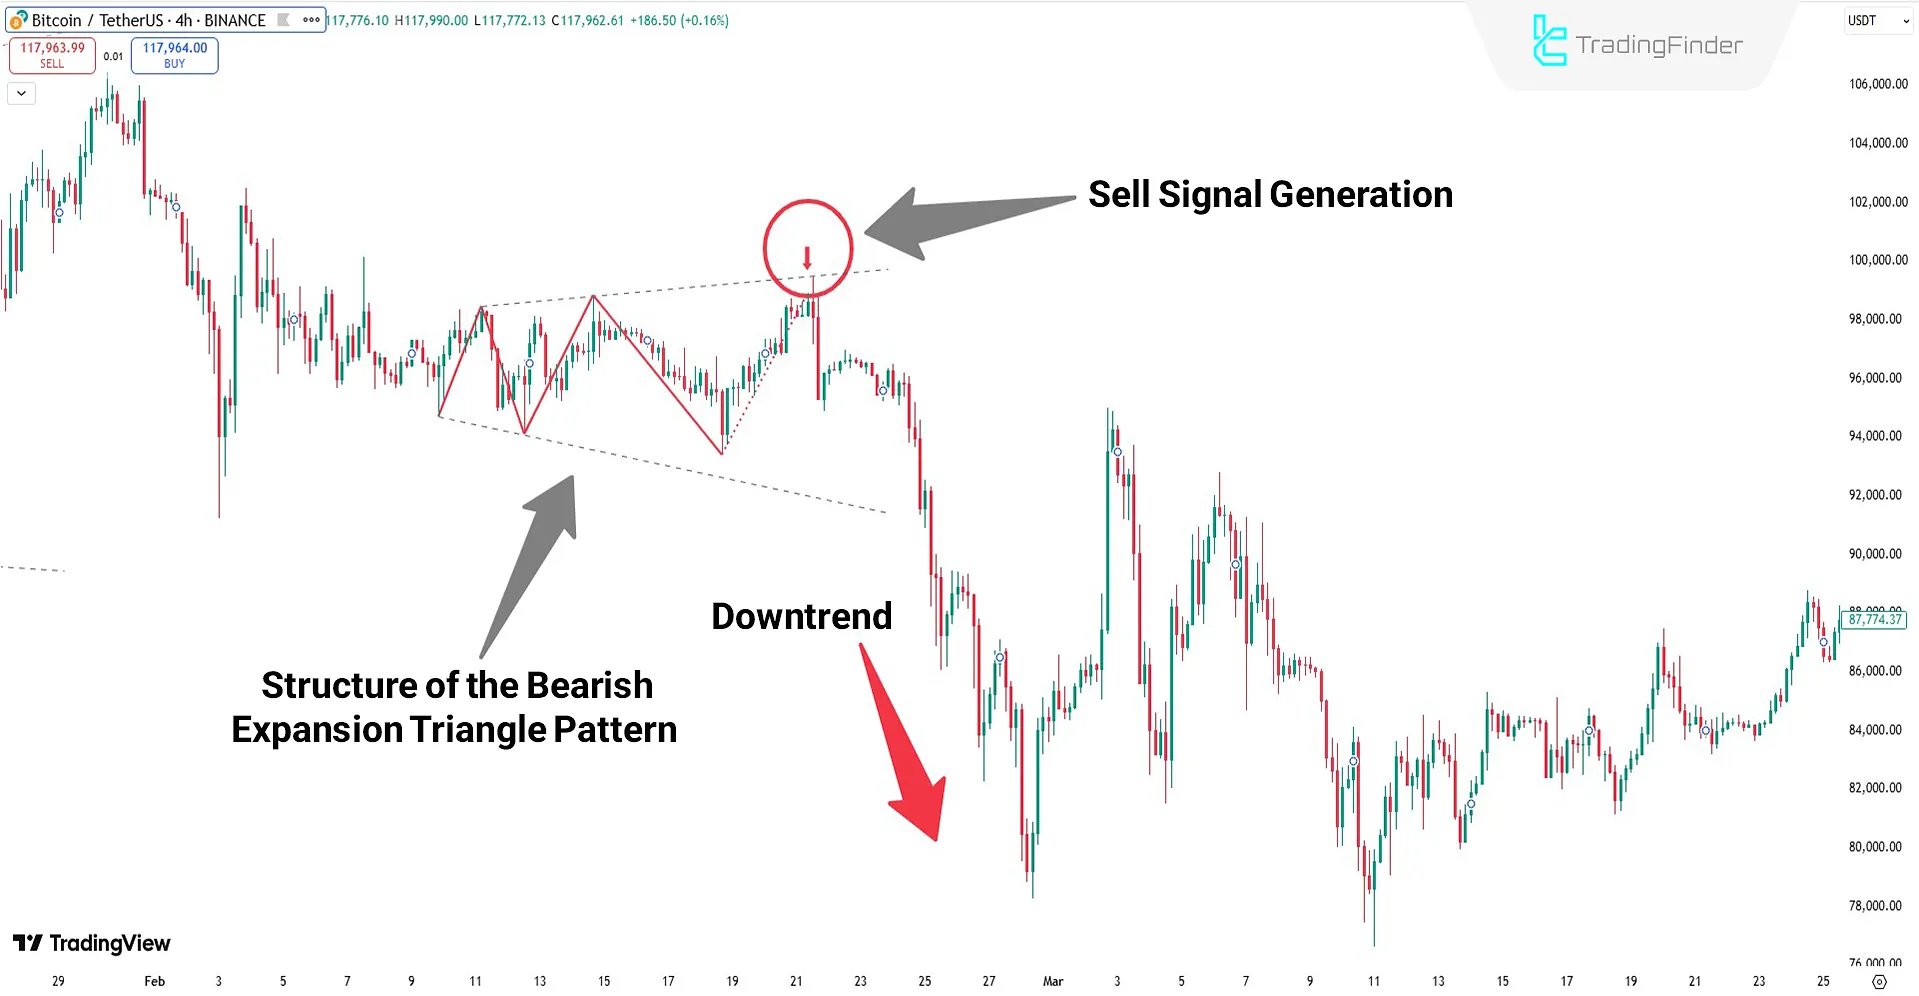
Sell Signal
According to the cryptocurrency chart for Bitcoin (BTC), the indicator displays the structure of the expansion triangle pattern using red lines on the chart. Also, at the point of pattern completion, it issues a sell signal with a red arrow.
Expansion Triangle Indicator Settings
Configurable options in the Expansion Triangle Indicator are as follows:
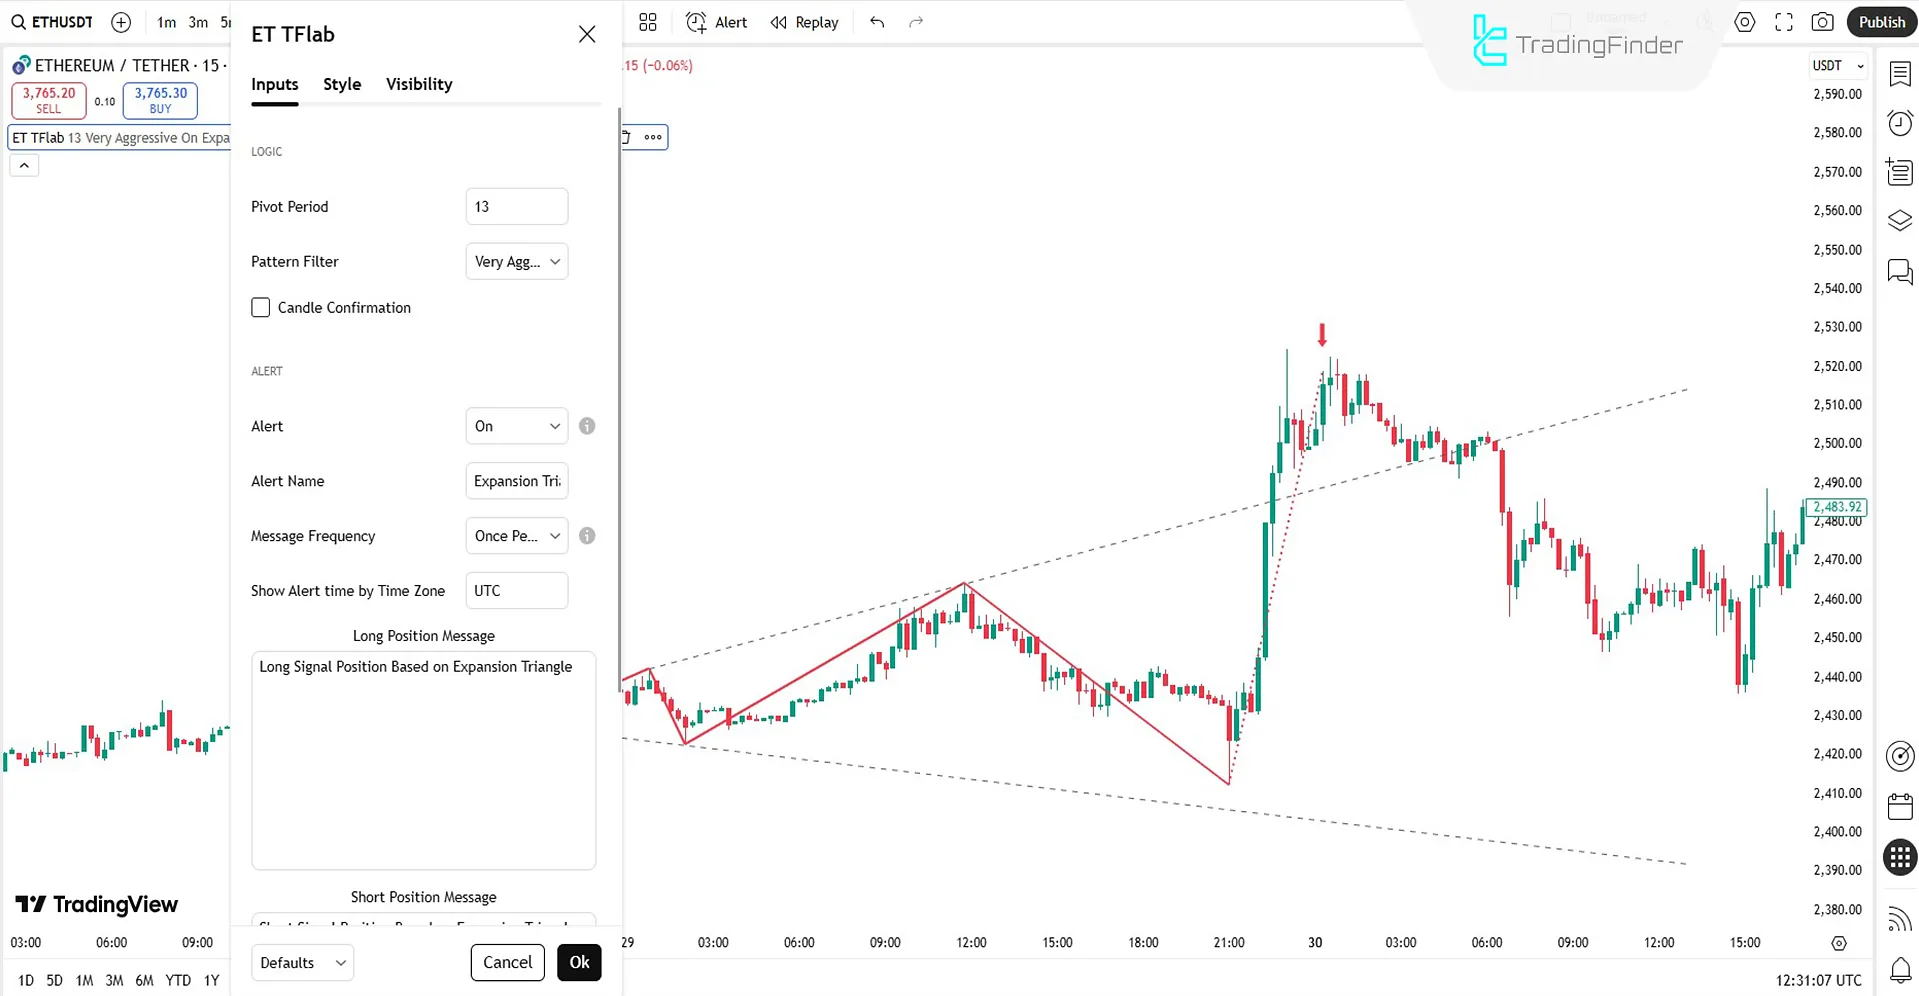
LOGIC
- Pivot Period: Number of candles used to identify peaks and troughs
- Pattern Filter: Pattern structure filter to eliminate weak signals
- Candle Confirmation: Signal generation only if a valid reversal candle exists
ALERT
- Alert: Enable alert
- Alert Name: Define the name of the alert
- Message Frequency: Choose the number of alert messages
- Show Alert Time by Time Zone: Set time zone to UTC
Conclusion
The Expansion Triangle Indicator, using wave structure analysis and adjustable filters, filters out valid broadening triangle patterns and identifies low-risk entry points.
One of the key features of this tool is its ability to provide alerts when signals are generated.
Expansion Triangle Indicator TradingView PDF
Expansion Triangle Indicator TradingView PDF
Click to download Expansion Triangle Indicator TradingView PDFWhich trading markets is this tool suitable for?
The Expansion Triangle Indicator is suitable for all markets including Forex, cryptocurrencies, stocks, etc.
Does this indicator generate buy and sell signals?
Yes, the Expansion Triangle Indicator issues buy and sell signals based on the formed pattern structure and confirmation candles.


