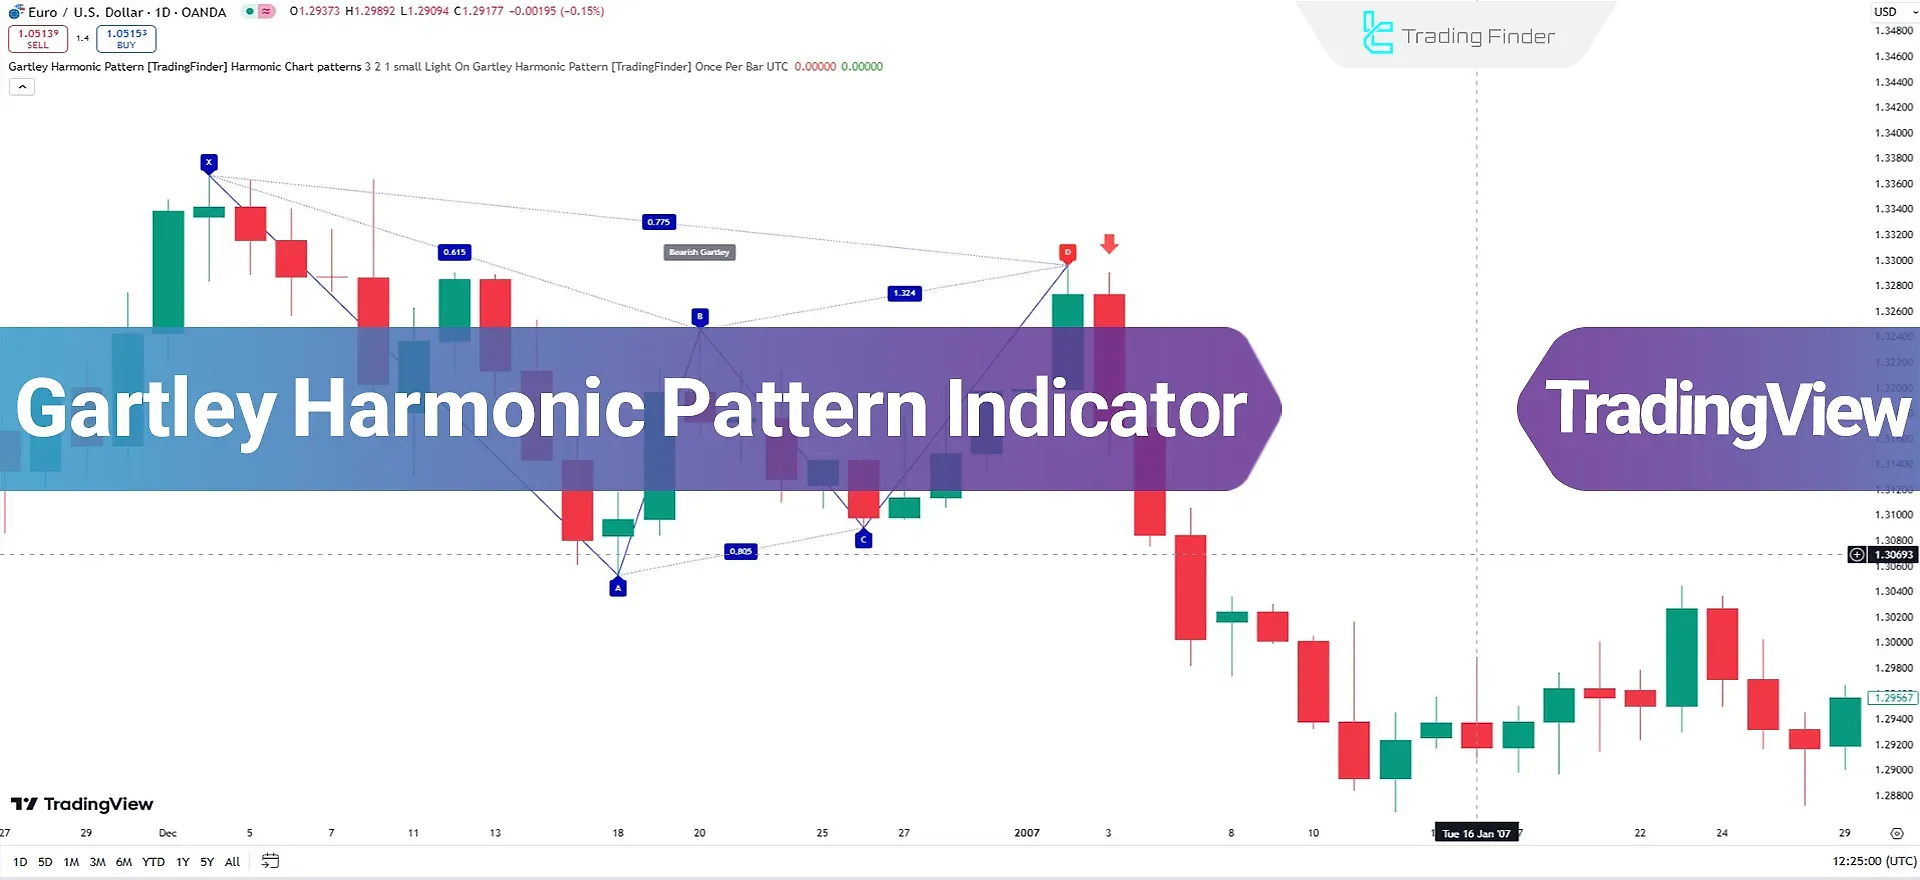
The Gartley Harmonic Pattern indicator in TradingView indicators identifies Gartley patterns and uses Fibonacci levels to predictPotential Reversal Zones (PRZ) in the market.

This pattern usually forms in the first and second waves of the Elliott Wave Theory, where the XA wave represents Wave 1, and the ABCD correction represents Wave 2. The key points of the Gartley pattern align with Fibonacci levels.
Specification Table for the Gartley Harmonic Pattern Indicator
The table below provides complete information about this indicator and its applications:
Indicator Categories: | Signal & Forecast Tradingview Indicators Harmonic Tradingview Indicators Chart & Classic Tradingview indicators |
Platforms: | Trading View Indicators |
Trading Skills: | Intermediate |
Indicator Types: | Reversal Tradingview Indicators |
Timeframe: | Multi-Timeframe Tradingview Indicators |
Trading Style: | Intraday Tradingview Indicators |
Trading Instruments: | TradingView Indicators in the Forex Market Cryptocurrency Tradingview Indicators Stock Tradingview Indicators Share Stocks Tradingview Indicators |
Overview of the Indicator
The Gartley pattern consists of four main points, each playing a specific role in identifying the pattern and predicting market changes. Point X marks the start of the movement and acts as the basis for pattern analysis.
Point A indicates the end of the initial movement and represents the path covered by the price. Point B is considered a correction of the XA wave and usually reaches the 61.8% Fibonacci level.
Point C reflects a correction of the AB wave, occurring between the 38% and 79% Fibonacci range. Point D is considered the end of this correction, typically between the BC wave's 113% and 162% Fibonacci range.
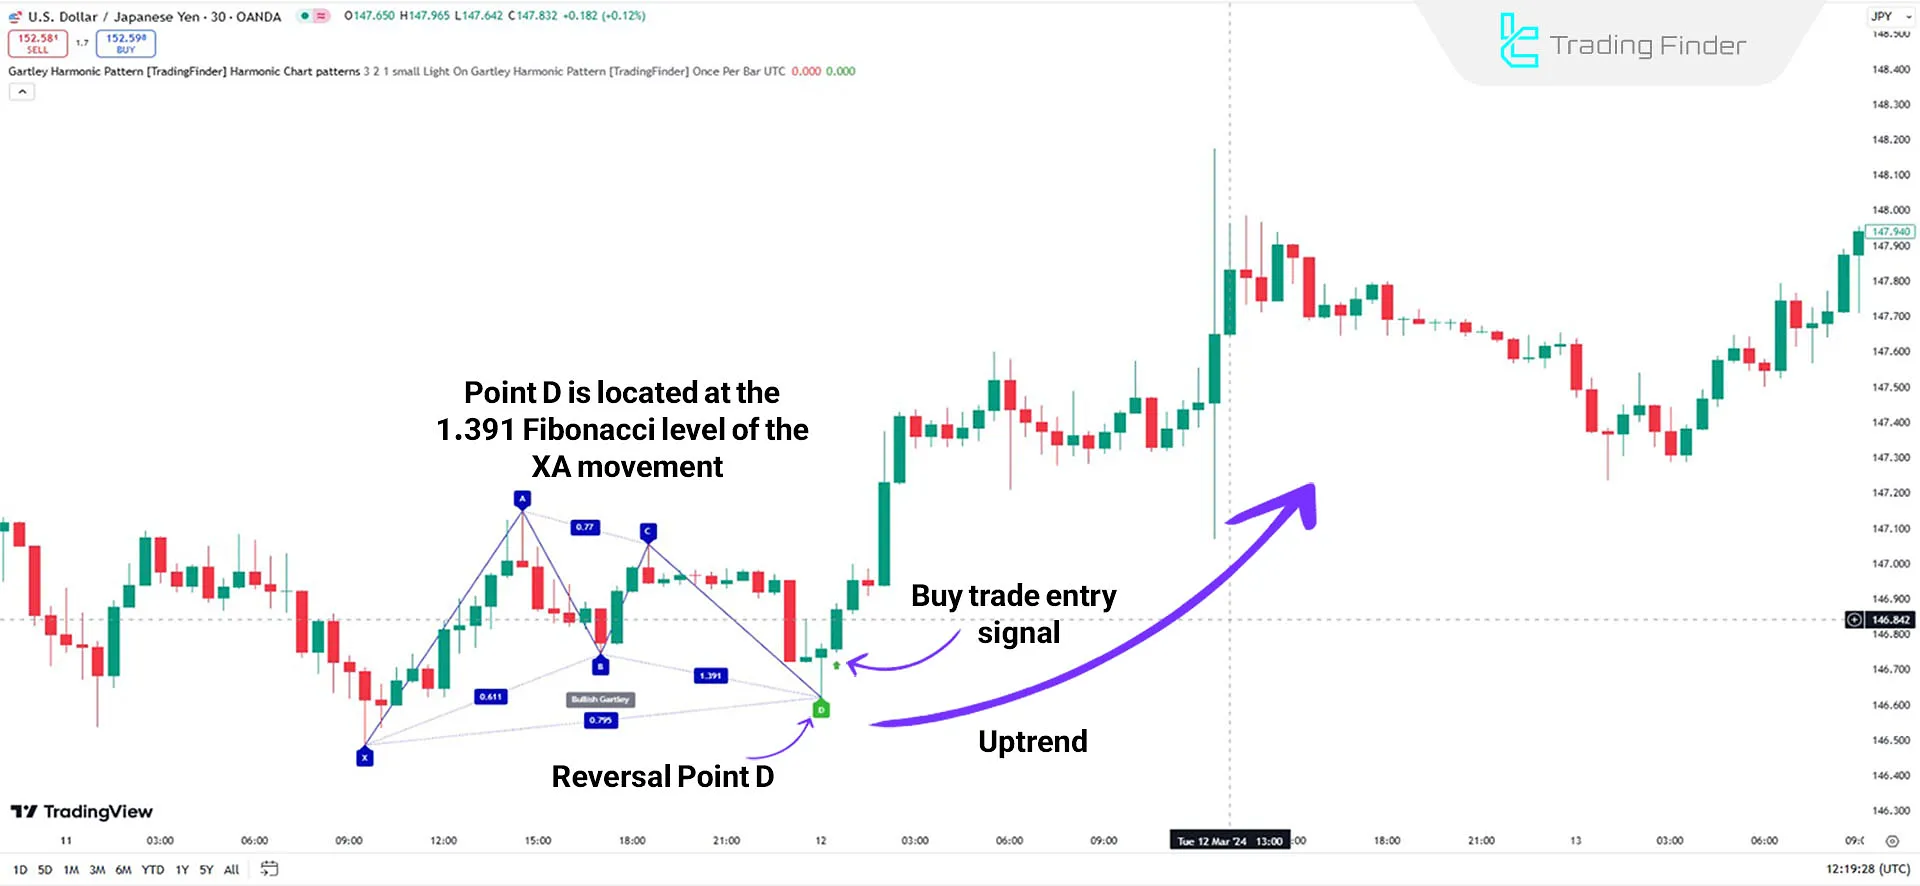
Indicator in an Uptrend
The movement from Point X to A must first be upward to identify an upward Gartley pattern. Then, the movement from Point A to B occurs downward, followed by an upward movement from Point B to C.
Finally, the movement from point C to D forms a downward move. This pattern appears similar to the letter M on the chart.
After completing this pattern, the price usually starts rising from point D, and then this Harmonic Pattern indicator displays the entry signal (green arrow) for the trade.

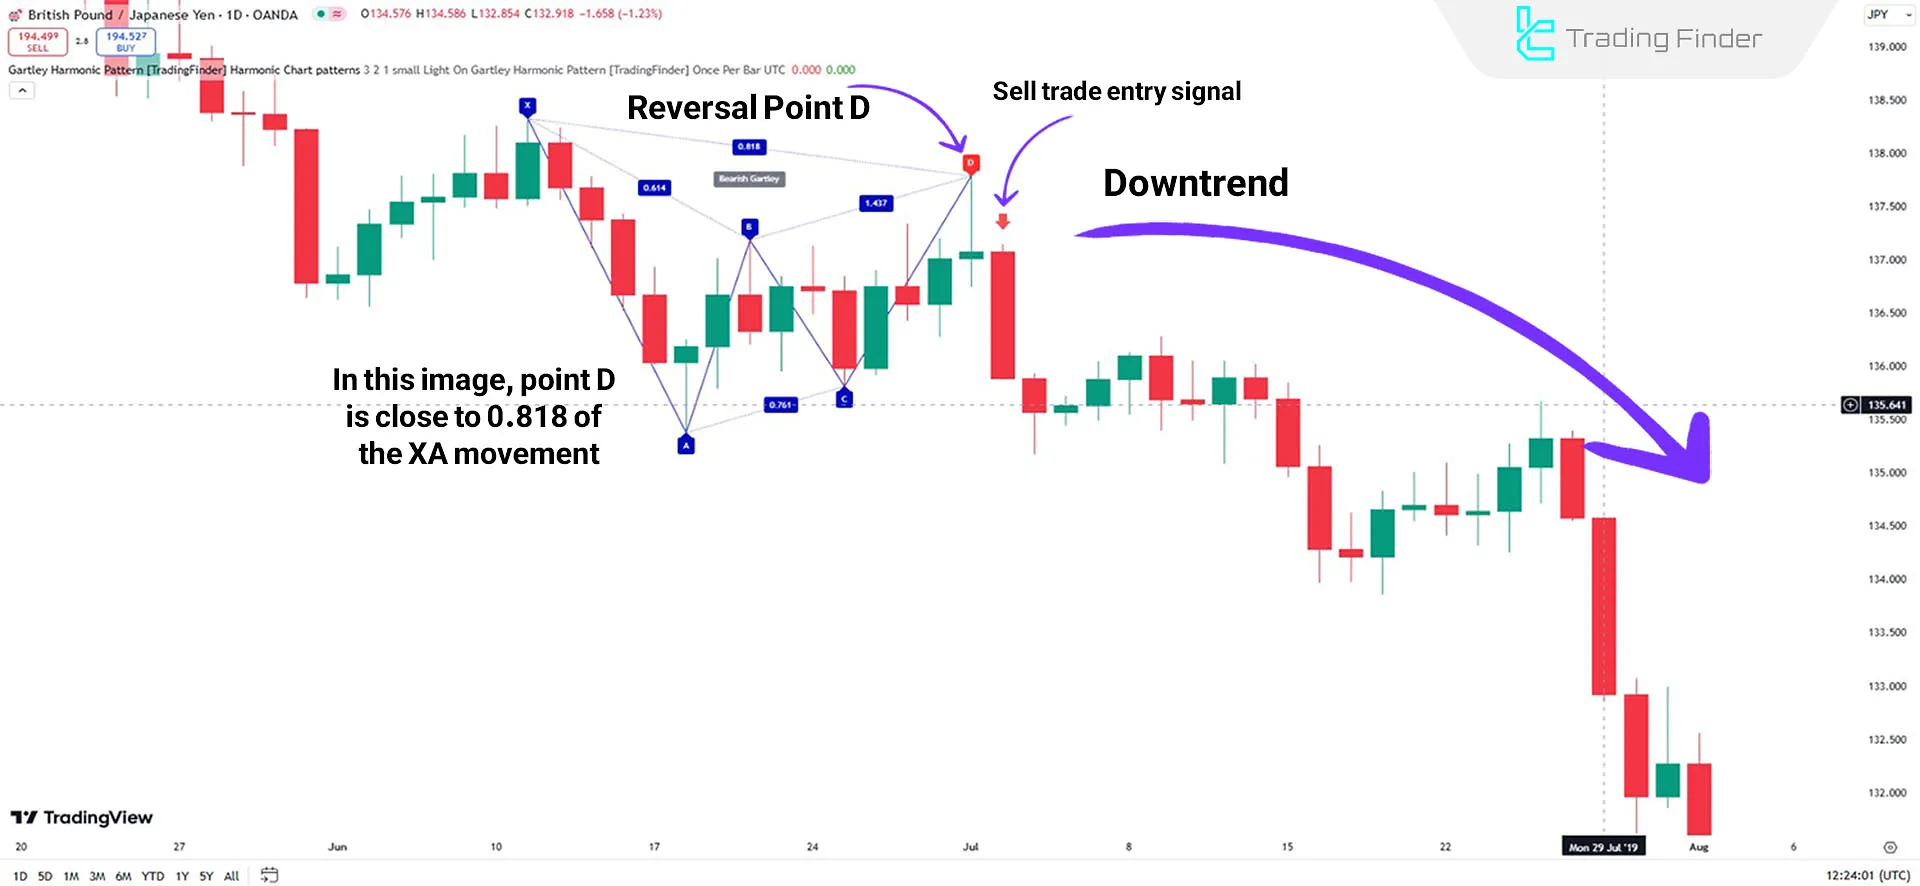
Indicator in a Downtrend
In adowntrend for GBP/JPY, the initial movement from Point X to A is downward; the movement from Point A to B occurs upward.
Afterward, the movement from Point B to C is downward again, and finally, the movement from Point C to D ascends.
Ultimately, the bearish Gartley pattern on the chart resembles the letter "W," indicating a potential price drop from Point D after the final movement.

Gartley Harmonic Pattern Indicator Settings
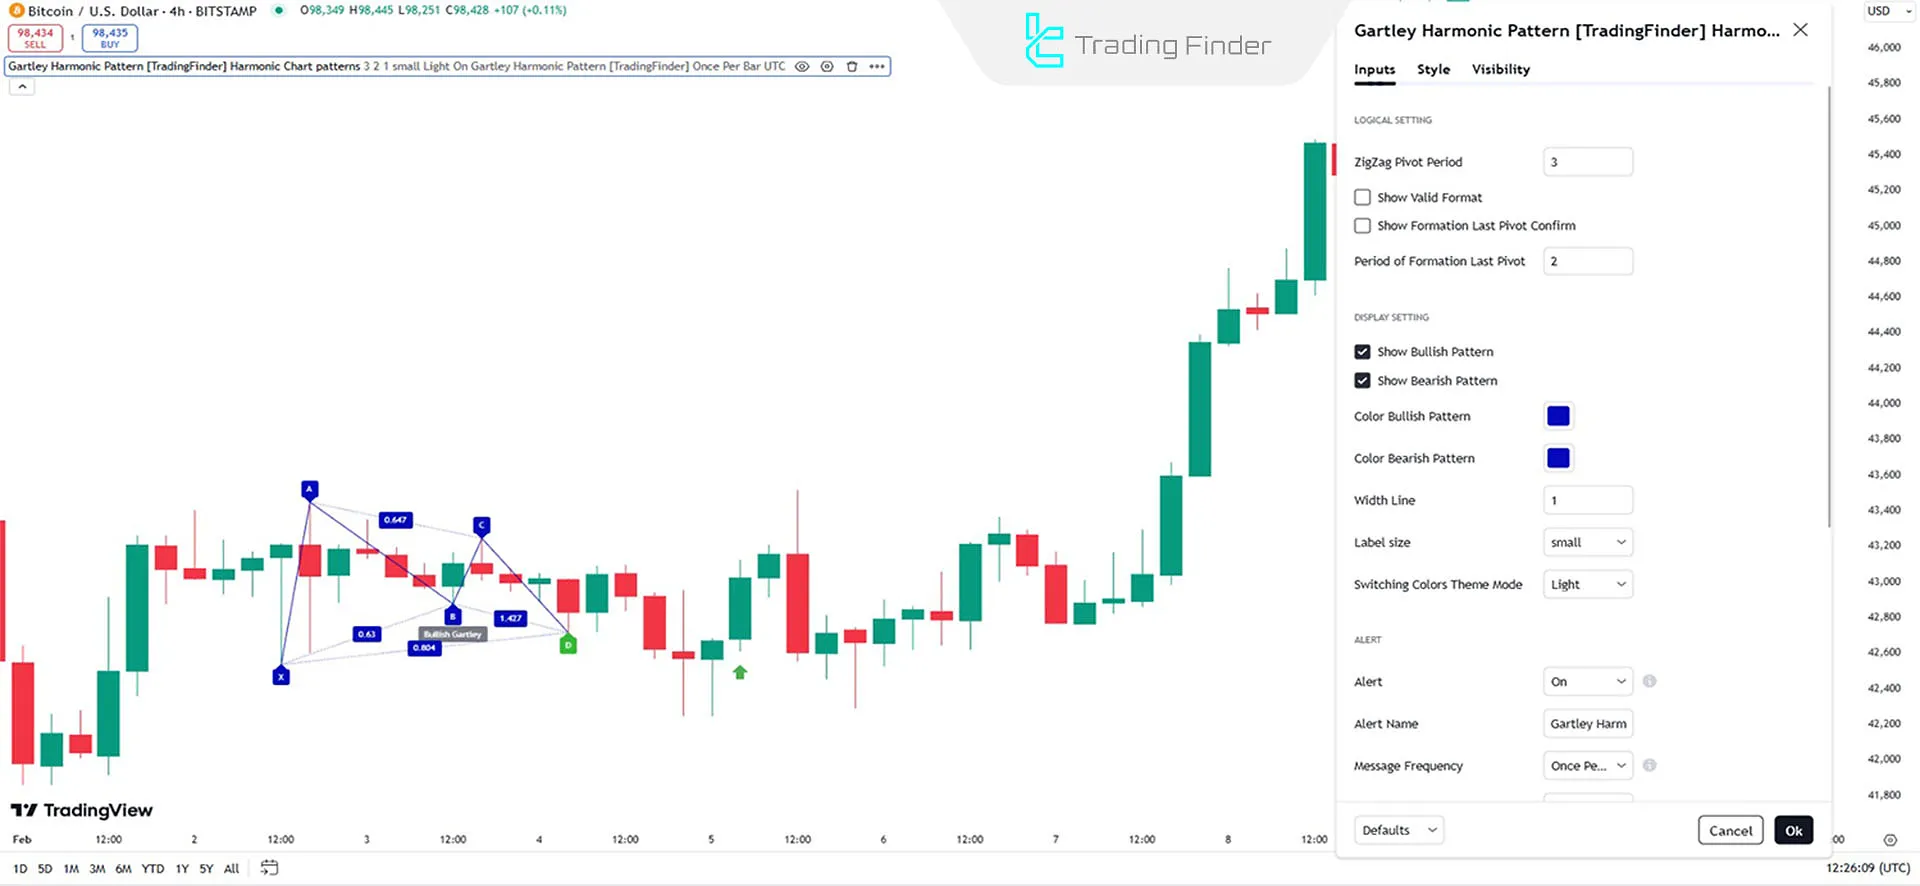
The image below refers to the formation of the Gartley harmonic pattern, which includes the sections [Logical Setting, Display Setting, and Alert]:
 Logical Setting
- ZigZag Pivot Period: The Default pivot period for ZigZag is set to 3;
- Show Valid Format: Display only valid patterns
- Show Formation Last Pivot Confirm: Show confirmation of the last pivot.
Display Setting
- Period of Formation Pivot: For the formation period of the last pivot, the default is set to 2;
- Show Bullish Pattern: Display bullish patterns
- Show Bearish Pattern: Display bearish patterns;
- Color Bullish Pattern: The default color for bullish patterns is blue;
- Color Bearish Pattern: The Default color for the bearish pattern is red;
- Width Line: Default display line thickness set to 1;
- Label Size: Size of the text labels;
- Switching Colors Theme Mode: Background theme of the chart.
Alert
- Alert: Enable alerts for pattern formations;
- Alert Name: Name of the alert;
- Message Frequency: Customizable message content;
- Show Alert Time By Time Zone: Display alert times based on the selected time zone.
Conclusion
The Gartley Harmonic Pattern Indicator analyzes price structures and Fibonacci ratios, identifies market reversal zones, and highlights high-potential trading opportunities.
Successful use of this tool requires combining technical knowledge, risk management, and experience in financial markets.
Gartley Harmonic Pattern TradingView PDF
Gartley Harmonic Pattern TradingView PDF
Click to download Gartley Harmonic Pattern TradingView PDFWhat is the Gartley Harmonic Pattern Indicator?
This indicator identifies Gartley patterns using Fibonacci levels and is used to predict market reversal zones (PRZ).
How does this indicator work?
The indicator identifies four key points (X, A, B, C, D) based on Fibonacci retracements and extensions, helping to detect bullish and bearish patterns.


