


TradingView
MetaTrader4
MetaTrader5
The Hidden SMT Divergence ICT 01 Indicator is a specialized tool in TradingView designed for Smart Money and ICT traders.
This indicator identifies differences between correlated assets based on their closing prices.
Forex traders can use hidden divergence detection to analyze bullish or bearish trends and, upon confirmation, enter buy or sell trades.
Table of Hidden SMT Divergence ICT 01 Indicator
Below is the information related to the Hidden SMT Divergence ICT 01 Indicator.
Indicator Categories: | ICT Tradingview Indicators Smart Money Tradingview Indicators Signal & Forecast Tradingview Indicators |
Platforms: | Trading View Indicators |
Trading Skills: | Elementary |
Indicator Types: | Trend Tradingview Indicators Breakout Tradingview Indicators Entry & Exit TradingView Indicators |
Timeframe: | M1-M5 Time Tradingview Indicators M30-M15 Time Tradingview Indicators |
Trading Style: | Fast Scalper Tradingview Indicators Intraday Tradingview Indicators |
Trading Instruments: | TradingView Indicators in the Forex Market Cryptocurrency Tradingview Indicators Stock Tradingview Indicators Indices Tradingview Indicators |
Hidden SMT Divergence ICT 01 Indicator at a Glance
The Hidden SMT Divergence ICT 01 Indicator is an advanced tool based on Smart Money concepts that detects differences between correlated assets with a focus on closing prices.
Compared to the standard SMT Divergence Indicator, which is based on highs and lows, this version provides higher accuracy in identifying divergences.
When a closing price divergence occurs between two correlated assets, traders can identify potential trend continuation or reversal and make better trading decisions based on price behavior.
This indicator can be used across multiple markets to detect hidden divergences and identify buy or sell opportunities.
By applying this indicator on the mentioned assets, divergences can be detected, and after confirmation, traders can enter long or short positions.
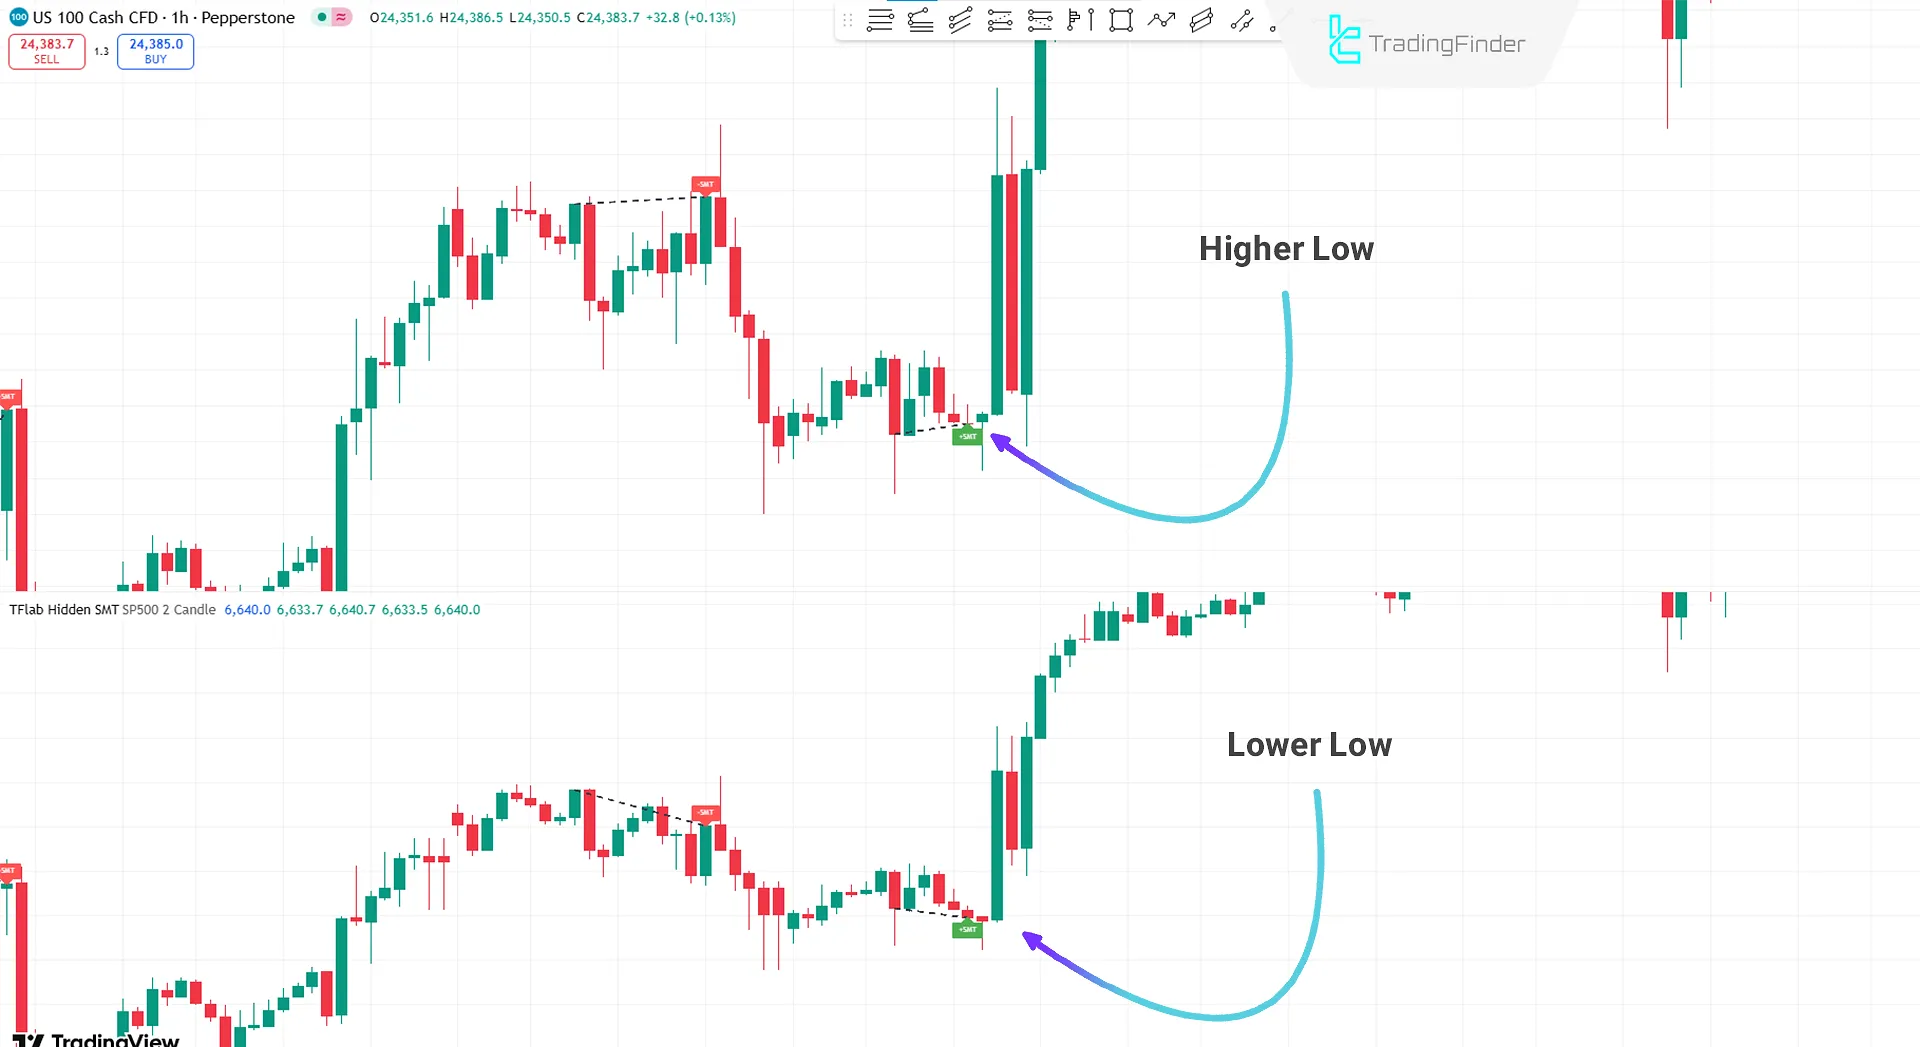
Bullish Trend with Hidden SMT Divergence ICT 01 Indicator
On the 1-hour Nasdaq chart, the Hidden SMT Divergence ICT 01 Indicator identified a divergence between the closing prices of Nasdaq and S&P 500.
By examining this difference in candle closes, which shows higher or lower lows, traders can detect a hidden bullish divergence.
In this situation, a buy signal is generated, creating a favorable opportunity to enter the market.
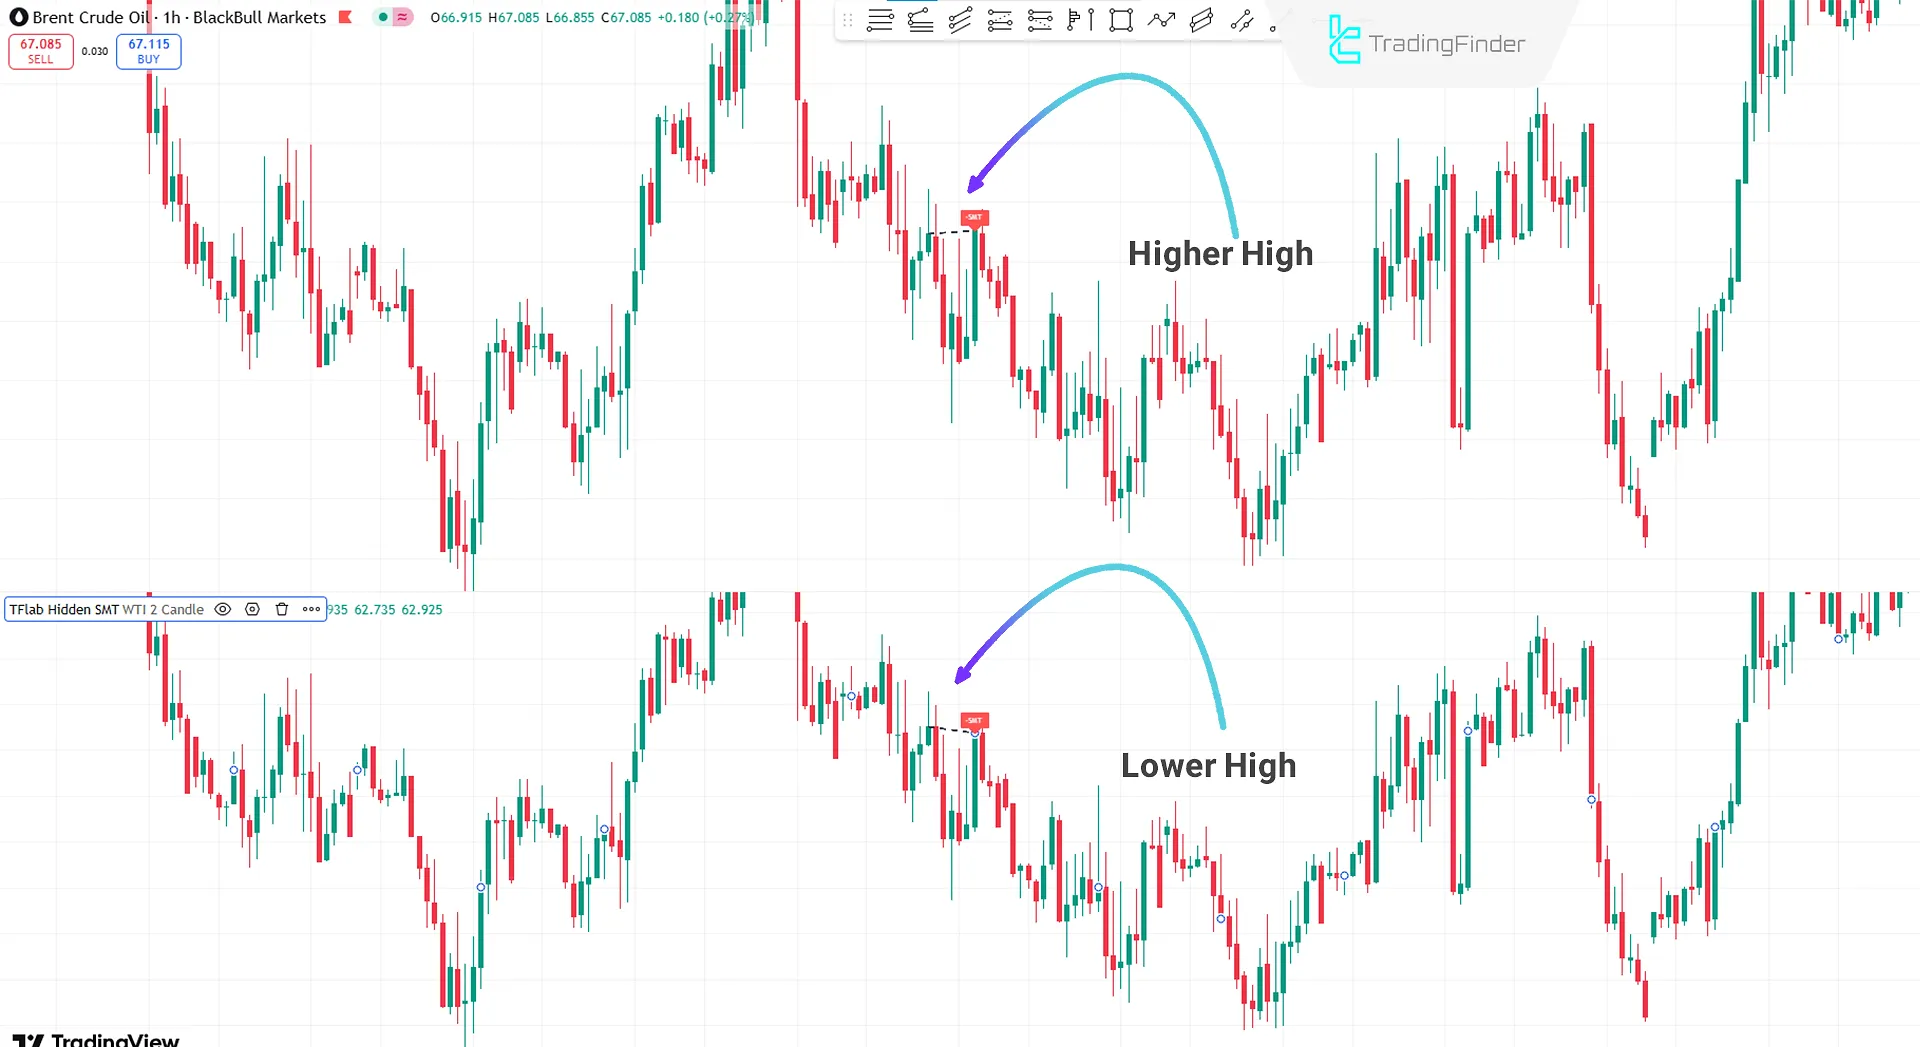
Bearish Trend with Hidden SMT Divergence ICT 01 Indicator
On the 1-hour chart, a hidden bearish divergence was identified between Brent and WTI.
Smart Money traders can use the Hidden SMT ICT 01 Indicator to analyze these divergences between correlated assets.
When a hidden divergence forms in the closing prices of higher or lower highs, suggesting a bearish market trend, more detailed chart analysis becomes possible.
By detecting this divergence, a bearish trading setup is formed, and traders can use it to enter sell positions.
Settings of Hidden SMT Divergence ICT 01 Indicator
The image below shows the settings of the Hidden SMT Divergence ICT 01 Indicator:
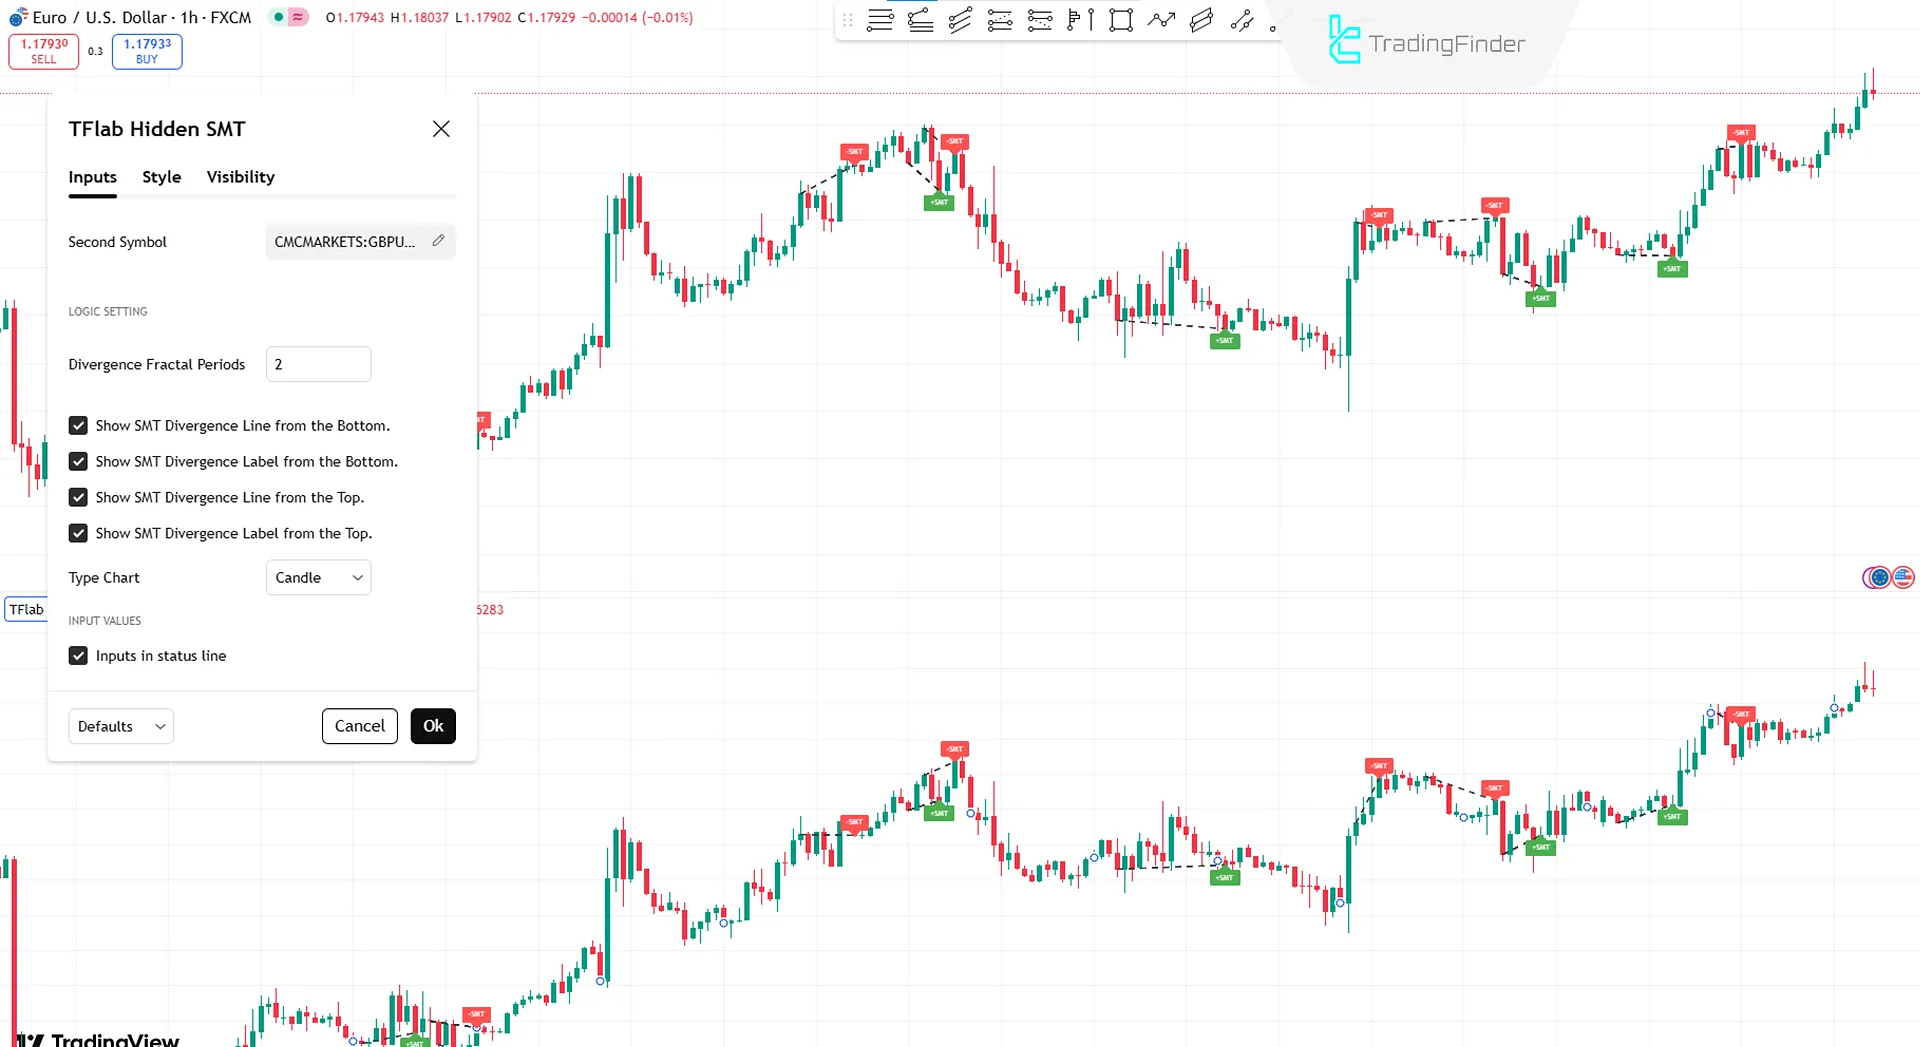
- Second Symbol: Select the secondary asset to compare with the primary asset. By default, it is set to "XAUUSD" (Gold), but it can be customized to any stock, cryptocurrency, or forex pair.
LOGIC SETTING
- Divergence Fractal Periods: Defines the number of past candles used to identify divergences. Default is 2, but it can be adjusted for greater accuracy;
- Show SMT Divergence Line from the Bottom: Displays the dotted line connecting bullish divergence points;
- Show SMT Divergence Label from the Bottom: Displays the label for bullish divergences;
- Show SMT Divergence Line from the Top: Displays bearish divergence areas with the label "+SMT";
- Show SMT Divergence Label from the Top: Displays bearish divergences with the label "-SMT";
- Type Chart: Allows switching between line or candlestick chart for better visualization.
INPUT VALUES
- Inputs in status line: Enable/disable displaying input values in the status line.
Conclusion
The Hidden SMT Divergence ICT 01 Indicator is a professional and practical tool for Smart Money and ICT traders, allowing them to detect price divergences between correlated assets.
It helps traders anticipate market trend changes before major moves and perform more detailed analysis by comparing closing prices.
Forex and crypto traders can use this indicator on their charts to forecast price movements and detect trading setups when hidden divergences occur.
Adding the Hidden SMT Divergence ICT 01 Indicator to TradingView PDF
Adding the Hidden SMT Divergence ICT 01 Indicator to TradingView PDF
Click to download Adding the Hidden SMT Divergence ICT 01 Indicator to TradingView PDFWhat is the Hidden SMT Divergence ICT 01 Indicator?
It is a specialized tool for Smart Money and ICT traders that detects differences between correlated assets based on closing prices, allowing analysis of bullish or bearish market trends.
How does the Hidden SMT Divergence ICT 01 Indicator identify divergences?
By focusing on the closing prices of correlated assets, it detects divergences with higher accuracy compared to the standard SMT Divergence Indicator, which is based on highs and lows.


