


TradingView
MetaTrader4
MetaTrader5
The Ichimoku Cloud Indicator is designed for analyzing trend, momentum, and support and resistance levels on the TradingView platform.
This indicator consists of five main components: Tenkan-sen, Kijun-sen, Senkou Span A, Senkou Span B, and Chikou Span.
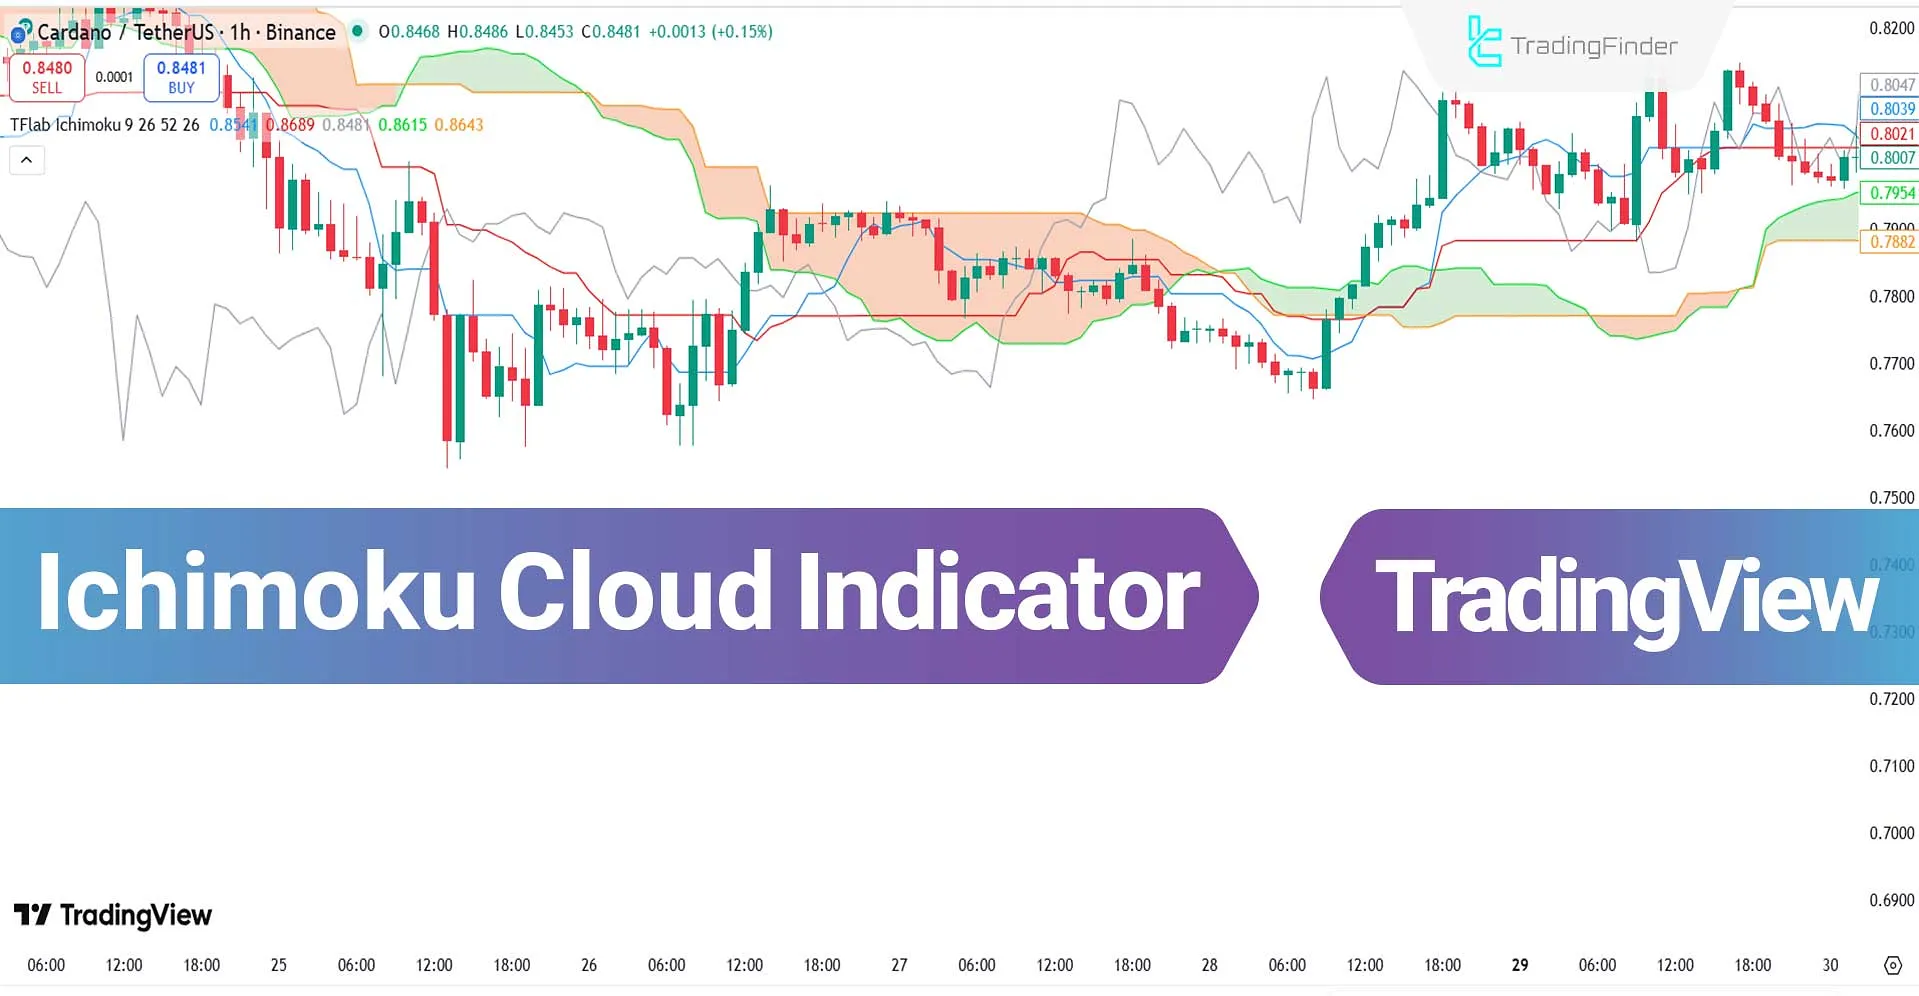
The combination of these lines forms the Ichimoku Cloud and allows users to evaluate overall market conditions.
Ichimoku Cloud Indicator Specification Table
The specifications of the Ichimoku Cloud Indicator are as follows.
Indicator Categories: | Signal & Forecast Tradingview Indicators Momentum Indicators in TradingView Ichimoku Indicators for TradingView |
Platforms: | Trading View Indicators |
Trading Skills: | Intermediate |
Indicator Types: | Reversal Tradingview Indicators |
Timeframe: | Multi-Timeframe Tradingview Indicators |
Trading Style: | Day Trading Tradingview Indicators Scalper Tradingview Indicators Swing Trading Tradingview Indicators |
Trading Instruments: | TradingView Indicators in the Forex Market Cryptocurrency Tradingview Indicators Stock Tradingview Indicators |
Ichimoku Cloud Indicator at a Glance
The Ichimoku Cloud Indicator simplifies the identification of bullish and bearish trends by providing an integrated visual representation.
When the price is above the Ichimoku Cloud, it indicates a bullish trend; conversely, when it is below the cloud, it signals a bearish trend. If the price moves inside the cloud, the market is considered neutral or ranging.
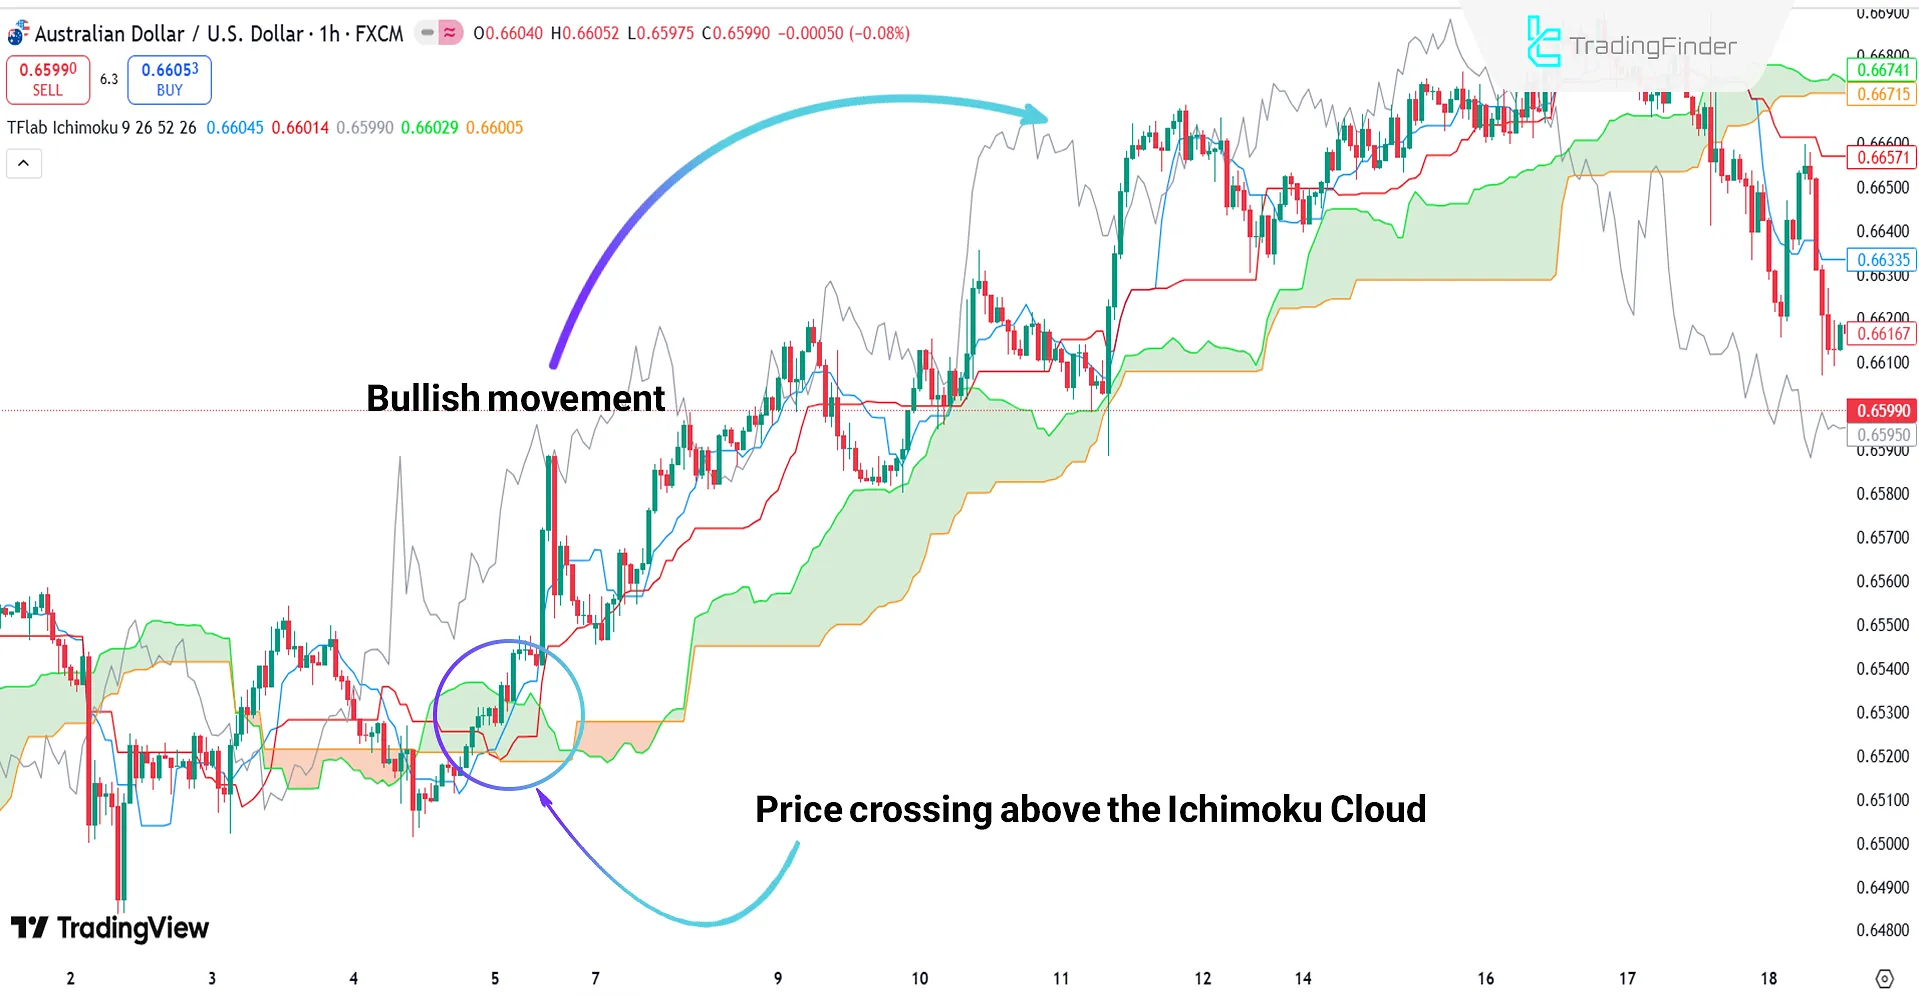
Bullish Trend Conditions
Based on the 1-hour chart of AUD/USD, the price crossing above the Ichimoku Cloud indicates the beginning of an uptrend.
Subsequently, the price staying above the green cloud confirms the continuation of the bullish trend. In this condition, the cloud can also act as a support zone.
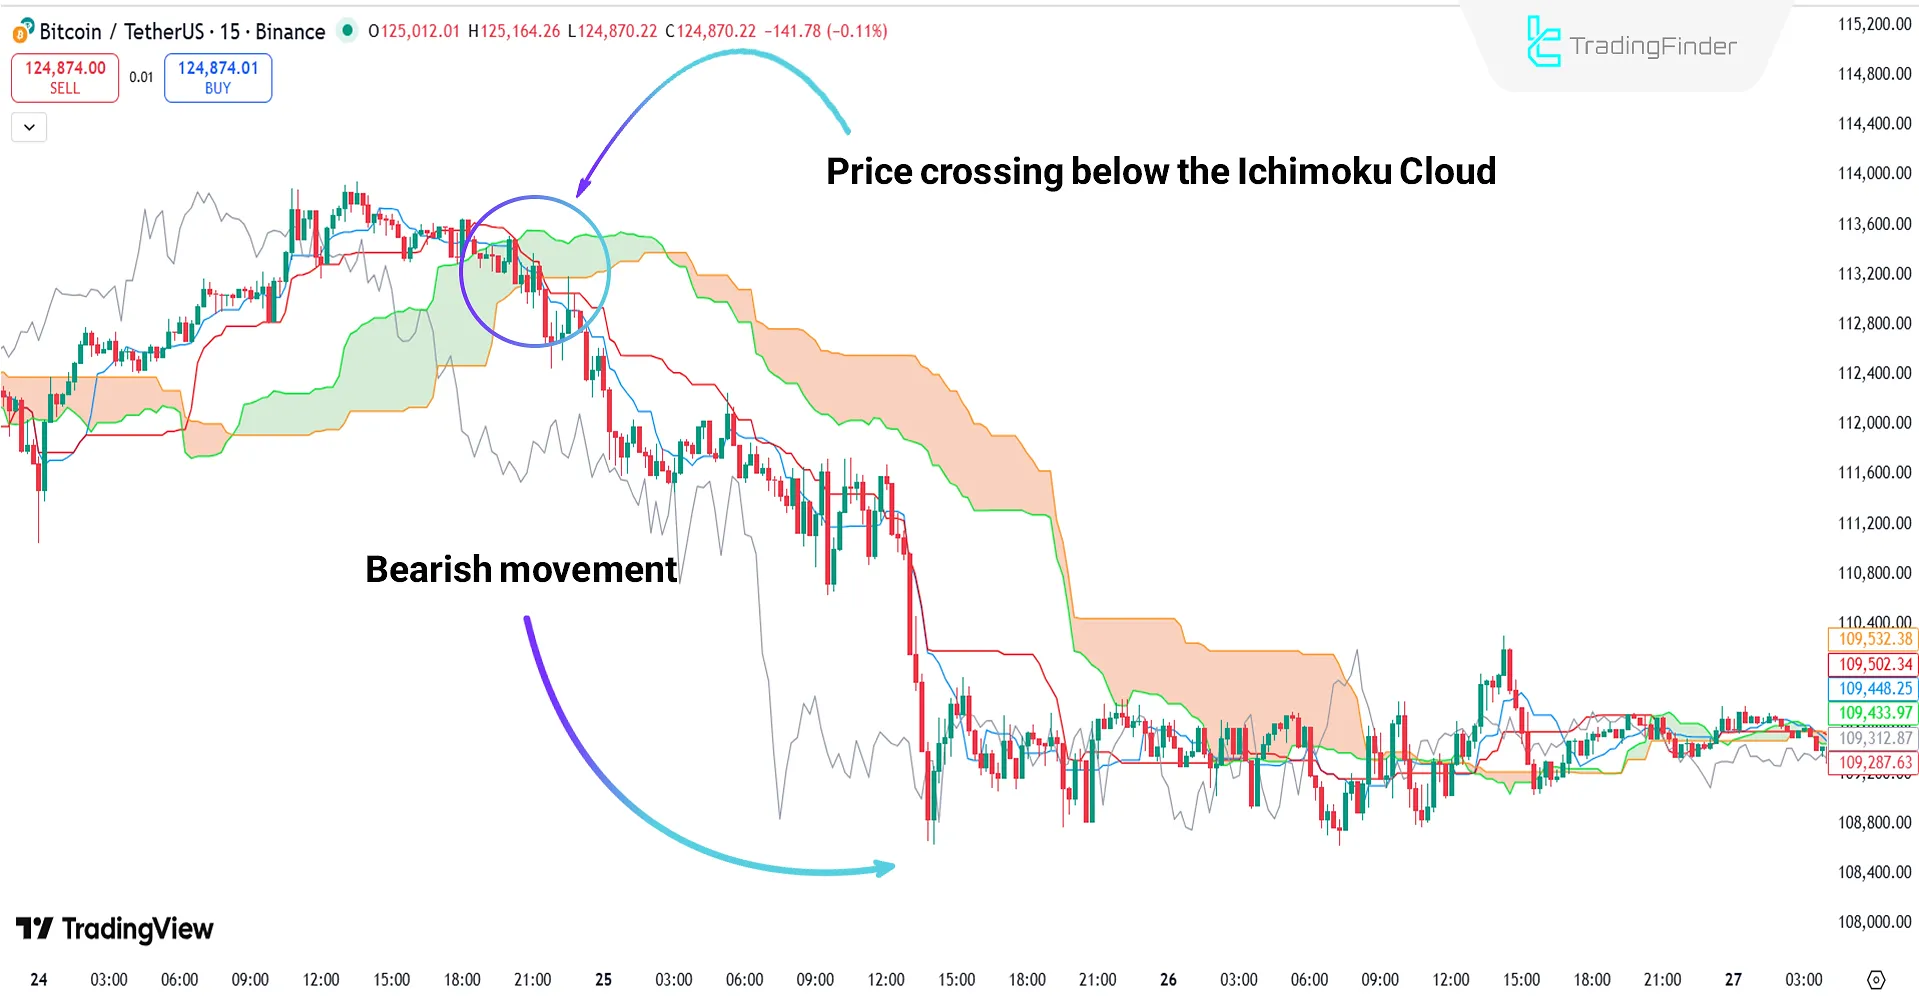
Bearish Trend Conditions
According to the 15-minute Bitcoin (BTC) cryptocurrency chart, the price positioned below the Ichimoku Cloud represents a downtrend. In this scenario, traders may use the upper area of the red cloud as potential stop-loss zones.
Ichimoku Cloud Indicator Settings
The settings of the Ichimoku Cloud Indicator are as follows:
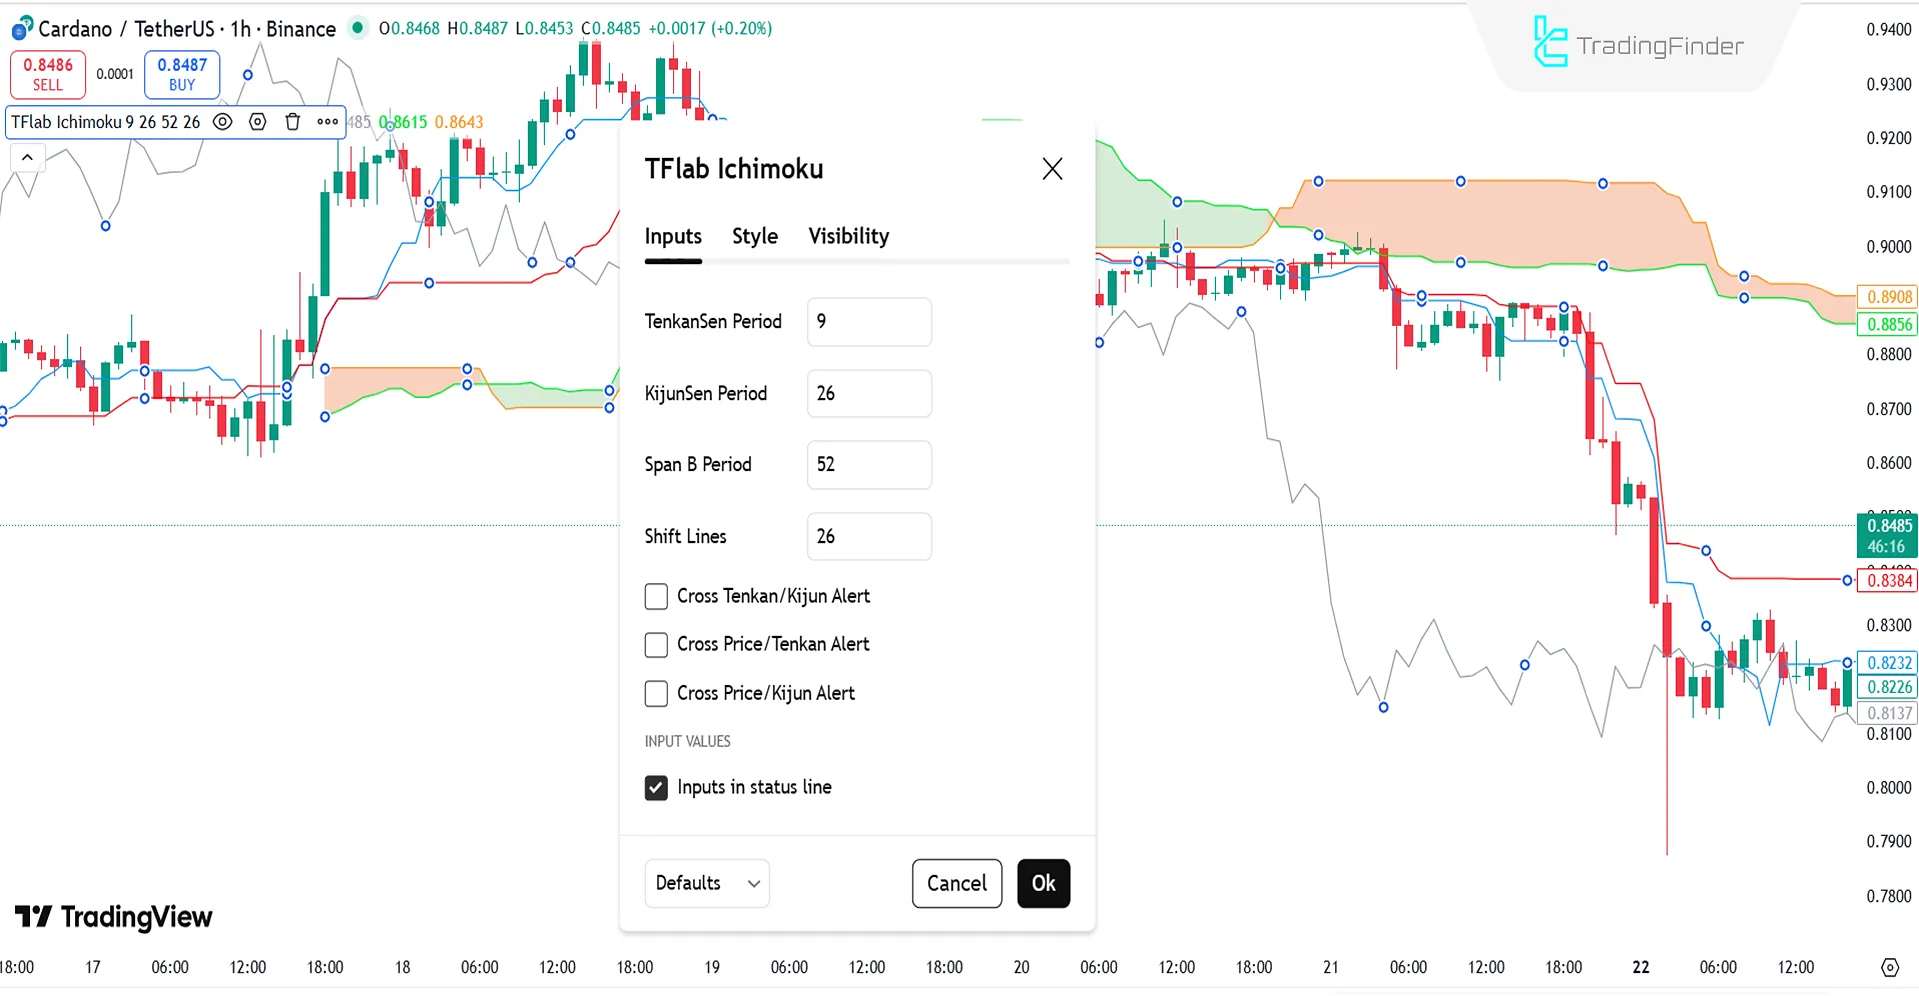
- TenkanSen Period: Period length of the Tenkan-sen line
- KijunSen Period: Period length of the Kijun-sen line
- Span B Period: Senkou Span B period for defining cloud boundary
- Shift Lines: Number of candlesticks for cloud and Chikou Span shift
- Cross Tenkan/Kijun Alert: Alert type for Tenkan-sen and Kijun-sen intersection
- Cross Price/Tenkan Alert: Alert type for price and Tenkan-sen intersection
- Cross Price/Kijun Alert: Alert type for price and Kijun-sen intersection
Conclusion
The Ichimoku Cloud Indicator, by combining its five main components, enables the analysis of trend, momentum, and dynamic support and resistance levels.
Its primary signals are derived from the Tenkan–Kijun crossovers, cloud breakouts, and Chikou Span positions. Beyond indicating the current trend, the Ichimoku Cloud also provides a forward-looking projection of key market levels.
Ichimoku Cloud Indicator to TradingView PDF
Ichimoku Cloud Indicator to TradingView PDF
Click to download Ichimoku Cloud Indicator to TradingView PDFCan this indicator be used in long-term timeframes?
Yes, the Ichimoku Cloud Indicator is multi-timeframe and can be applied across all periods.
What does it mean when the price is above the Ichimoku Cloud?
It indicates a bullish trend.


