


The Ichimoku PourSamadi Signal Indicator is designed based on the time philosophy in the Ichimoku system (Ichimoku Kinko Hyo).
When the Kijun-sen remains unchanged for several consecutive candlesticks, it indicates a temporary balance between supply and demand.
As soon as the slope of the line changes, the indicator records this turning point as a time anchor and begins counting a new cycle.
The count continues from that candlestick with a fixed sequence of numbers: 5, 9, 13, 17, 26, 35, 43, 52, 63, 72, 81, and 90.
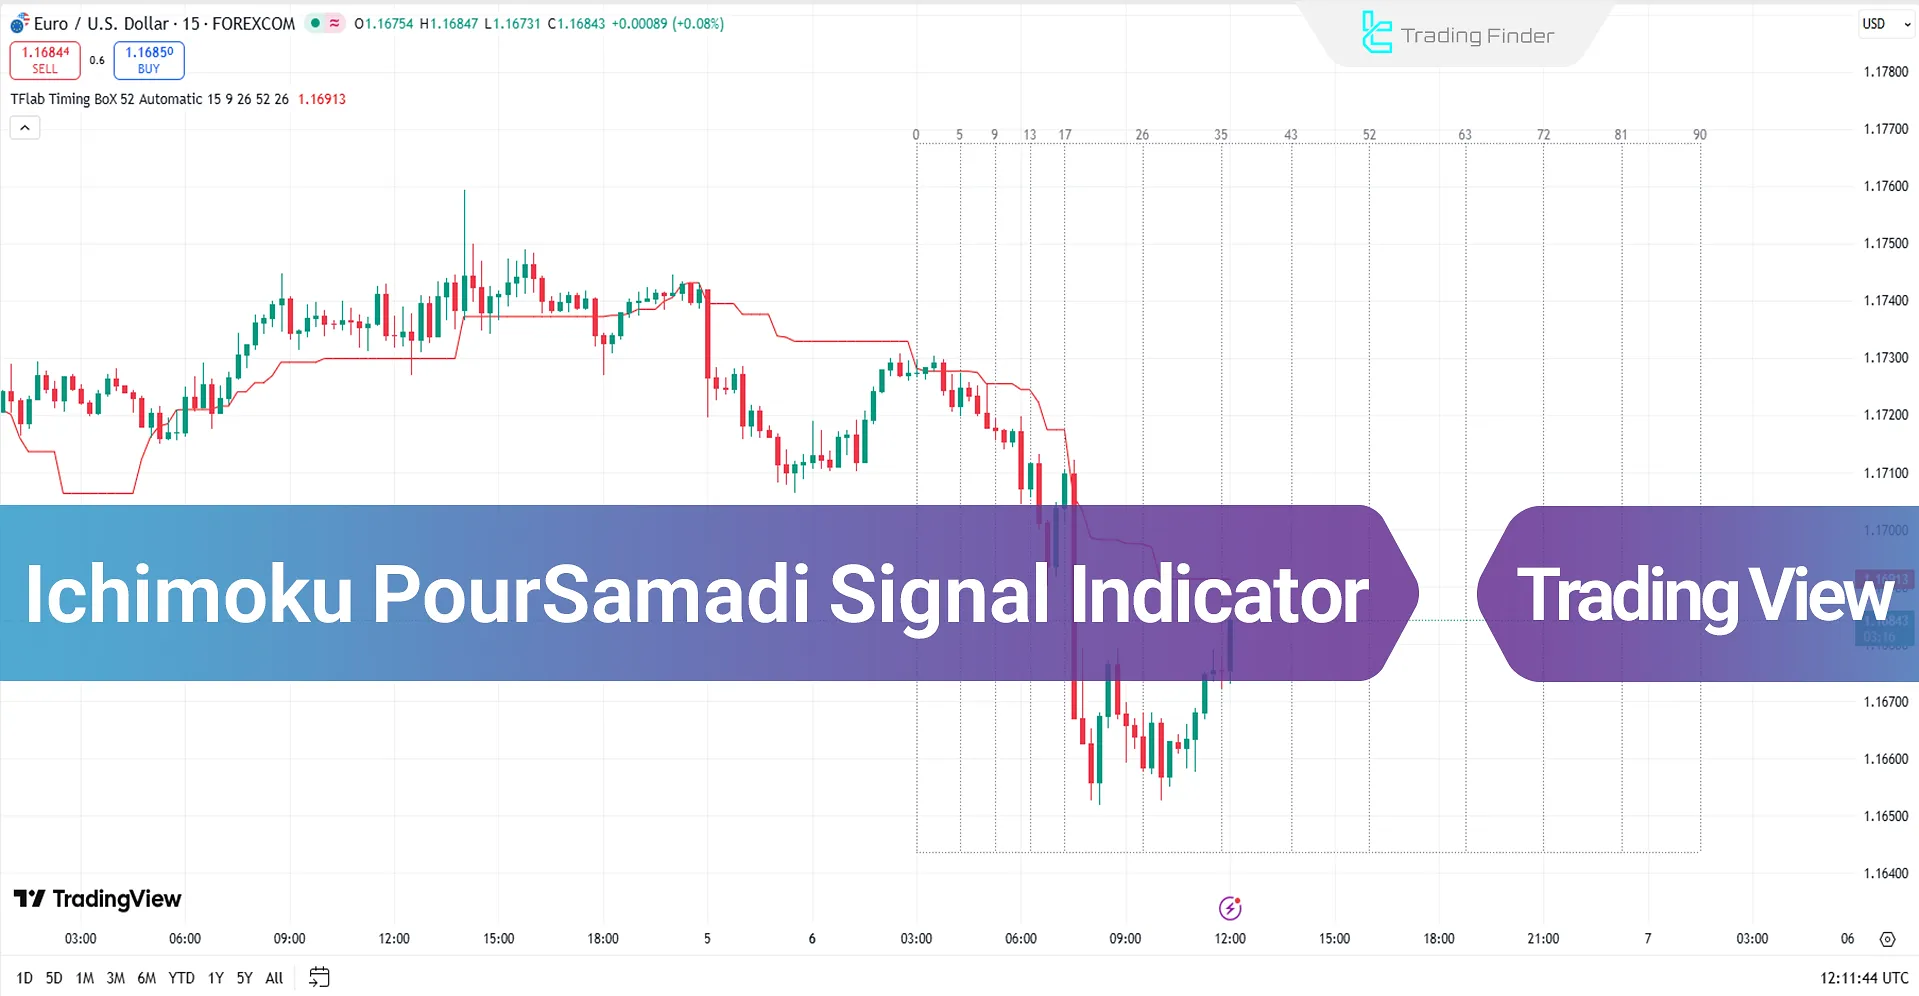
These numbers represent points in time where the probability of a rhythm shift in price movement or the start of a new market wave increases.
Specification Table of Ichimoku PourSamadi Signal Indicator
The following table presents the features and capabilities of the Ichimoku PourSamadi Signal indicator:
Indicator Categories: | Price Action Tradingview Indicators Trading Assist Tradingview Indicators Ichimoku Indicators for TradingView |
Platforms: | Trading View Indicators |
Trading Skills: | Intermediate |
Indicator Types: | Reversal Tradingview Indicators Breakout Tradingview Indicators |
Timeframe: | Multi-Timeframe Tradingview Indicators |
Trading Style: | Intraday Tradingview Indicators |
Trading Instruments: | TradingView Indicators in the Forex Market Cryptocurrency Tradingview Indicators Stock Tradingview Indicators Commodity Tradingview Indicators Indices Tradingview Indicators Share Stocks Tradingview Indicators |
Ichimoku PourSamadi Signal Indicator at a Glance
The Ichimoku PourSamadi Signal Indicator defines the time map of market movement and enables the analysis of price cycles over time as follows:
- Identification of high-risk time periods for market structure shifts
- Detection of potential wave endings or the start of corrective phases
- Differentiation between structured fluctuations and noise-driven market moves
Indicator Performance in Bullish Trend
In a bullish scenario, the indicator acts as a catalyst for rhythm changes in the market.
At one of these time nodes, if the price reacts by breaking a resistance level around nodes 9, 26, or 52 and strong-bodied bullish candlesticks form, the market movement pattern enters a bullish phase.

Indicator Performance in Bearish Trend
In a bearish scenario, when the Kijun-sen changes its slope downward after a flat period, a new cycle in the time dimension begins.
At key counting points, if the price loses major support around one of the significant nodes such as 63, and consecutive bearish candlesticks form, conditions for the start of a bearish wave emerge.

Ichimoku PourSamadi Signal Indicator Settings
The image below displays the details of the Ichimoku PourSamadi Signal Indicator settings:

Logical Setting
- KijunSen Period 52: Display Kijun-sen period 52
- Flat Event Filter: Show Flat event filter
- Update Timing Analysis BoX Per Event: Show Update timing analysis box per event
Display Setting
- Show Logical KijunSen Line: Display logical Kijun-sen line
Ichimoku Setting
- TenkanSen Period: Display tenkan-sen period
- KijunSen Period: Display kijun-sen period
- Span B Period: Show span B period
- Shift Lines: Show shift lines
- Ichimoku Display Setting: Show ichimoku display setting
- Show TenkanSen Line: Display Tenkan-sen line
- Show KijunSen Line: Display Kijun-sen line
- Show Chikou Span Line: Display Chikou Span line
- Show Span A Line: Display Span A line
- Show Span B Line: Display Span B line
- Show Cloud: Display Kumo cloud
Conclusion
The Ichimoku PourSamadi Signal Indicator, by focusing on the time philosophy in Ichimoku, identifies hidden cycles in the market.
In this indicator, the bullish scenario is confirmed through resistance breakout and demand dominance, while the bearish scenario is shaped by the loss of support and supply dominance.
Ichimoku PourSamadi Signal Indicator to TradingView PDF
Ichimoku PourSamadi Signal Indicator to TradingView PDF
Click to download Ichimoku PourSamadi Signal Indicator to TradingView PDFWhen does the cycle count begin in the Ichimoku PourSamadi Signal Indicator?
The counting begins from the first candlestick where the slope of the Kijun-sen changes, and the indicator registers that point as the time anchor.
What is the meaning of the sequence of numbers used in the Ichimoku PourSamadi Signal Indicator?
In this indicator, the numbers 5, 9, 13, 17, 26, 35, 43, 52, 63, 72, 81, and 90 represent key points where the probability of price reaction or rhythm change in the market is higher.


