


TradingView
MetaTrader4
MetaTrader5
The ICT Setup 04 Indicator, utilizing smart money and liquidity concepts, identifies key swing points and highlights reactive zones with green and red arrows when a liquidity sweep occurs.
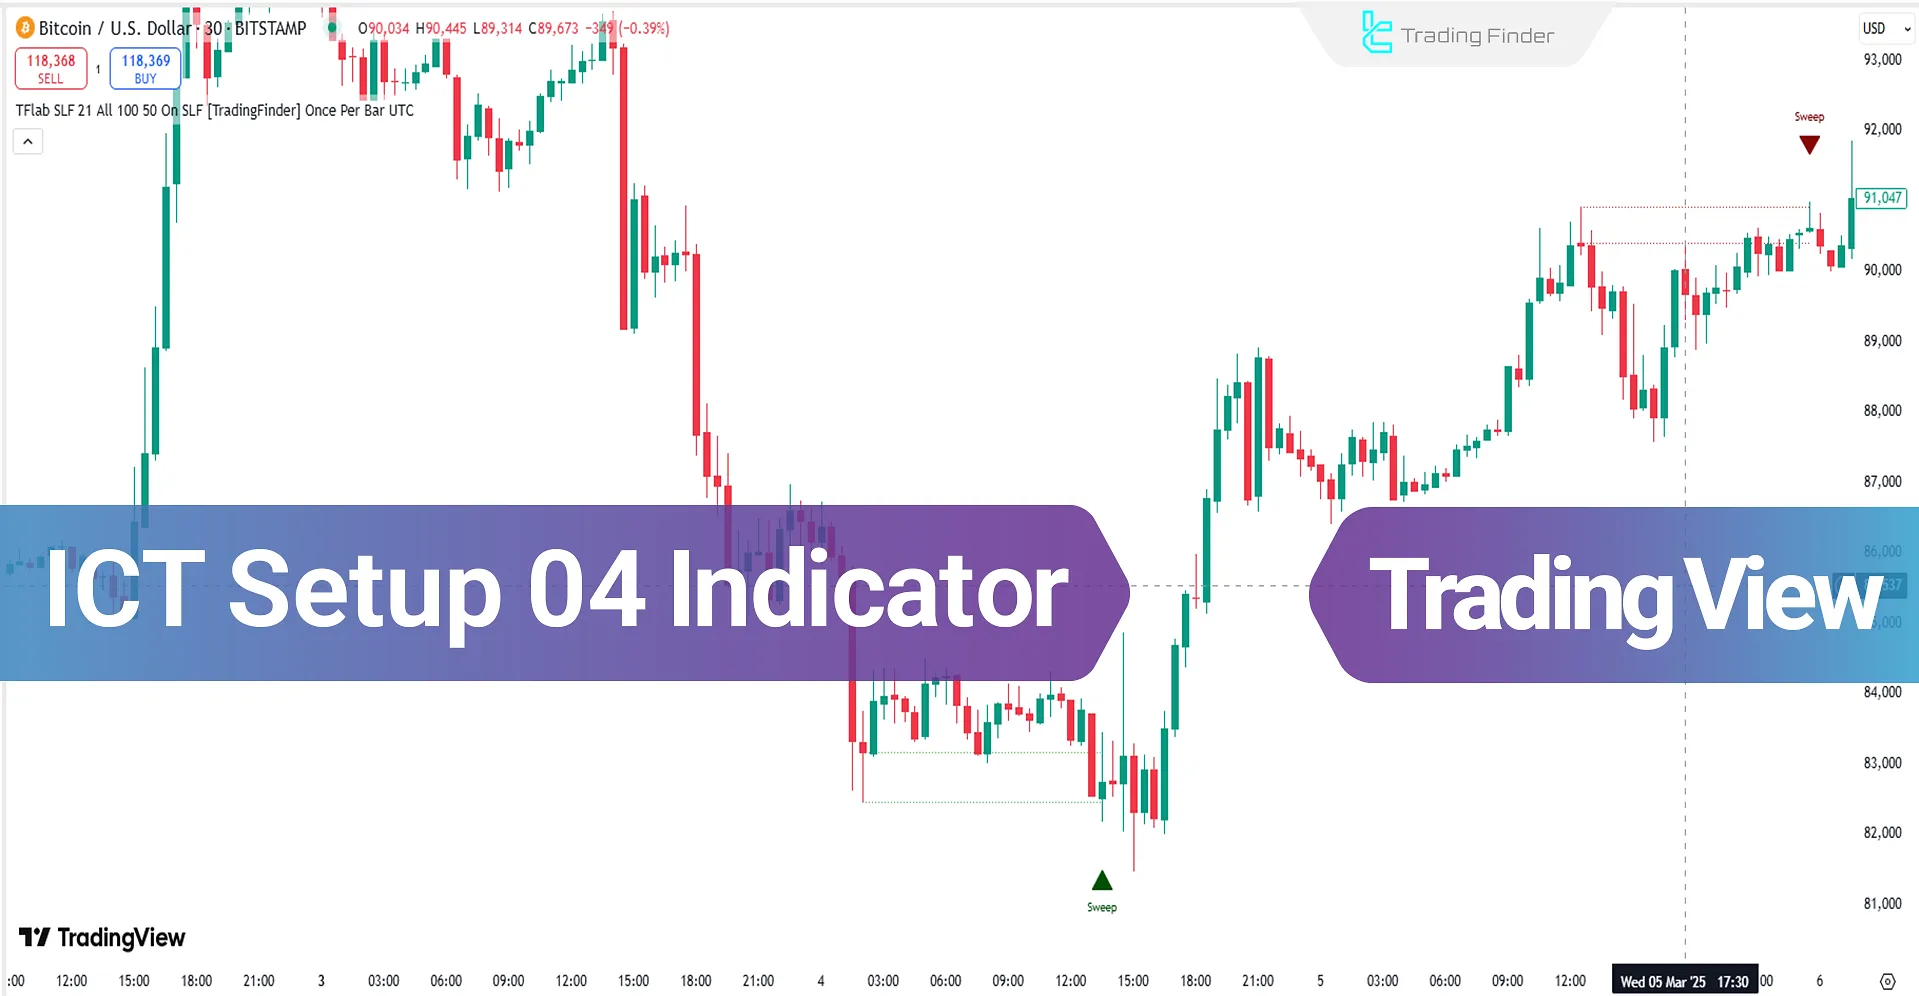
This trading tool uses structural and candlestick filters to detect fake breakouts and aligns trading signals with institutional order flow.
ICT Setup 04 Indicator Specification Table
The general specifications and features of the ICT Setup 04 Indicator are shown in the table below.
Indicator Categories: | ICT Tradingview Indicators Smart Money Tradingview Indicators Liquidity Tradingview Indicators |
Platforms: | Trading View Indicators |
Trading Skills: | Advanced |
Indicator Types: | Breakout Tradingview Indicators |
Timeframe: | Multi-Timeframe Tradingview Indicators |
Trading Style: | Intraday Tradingview Indicators |
Trading Instruments: | TradingView Indicators in the Forex Market Cryptocurrency Tradingview Indicators Share Stocks Tradingview Indicators |
ICT Setup 04 Indicator Overview
The ICT Setup 04 Indicator first detects significant price swings, then waits for price to fake-break these levels and enter a smart reactive zone.
When a confirmation candle (Doji or small-bodied candle) forms and closes inside this zone, representing a fake breakout, a potential entry zone is signaled.
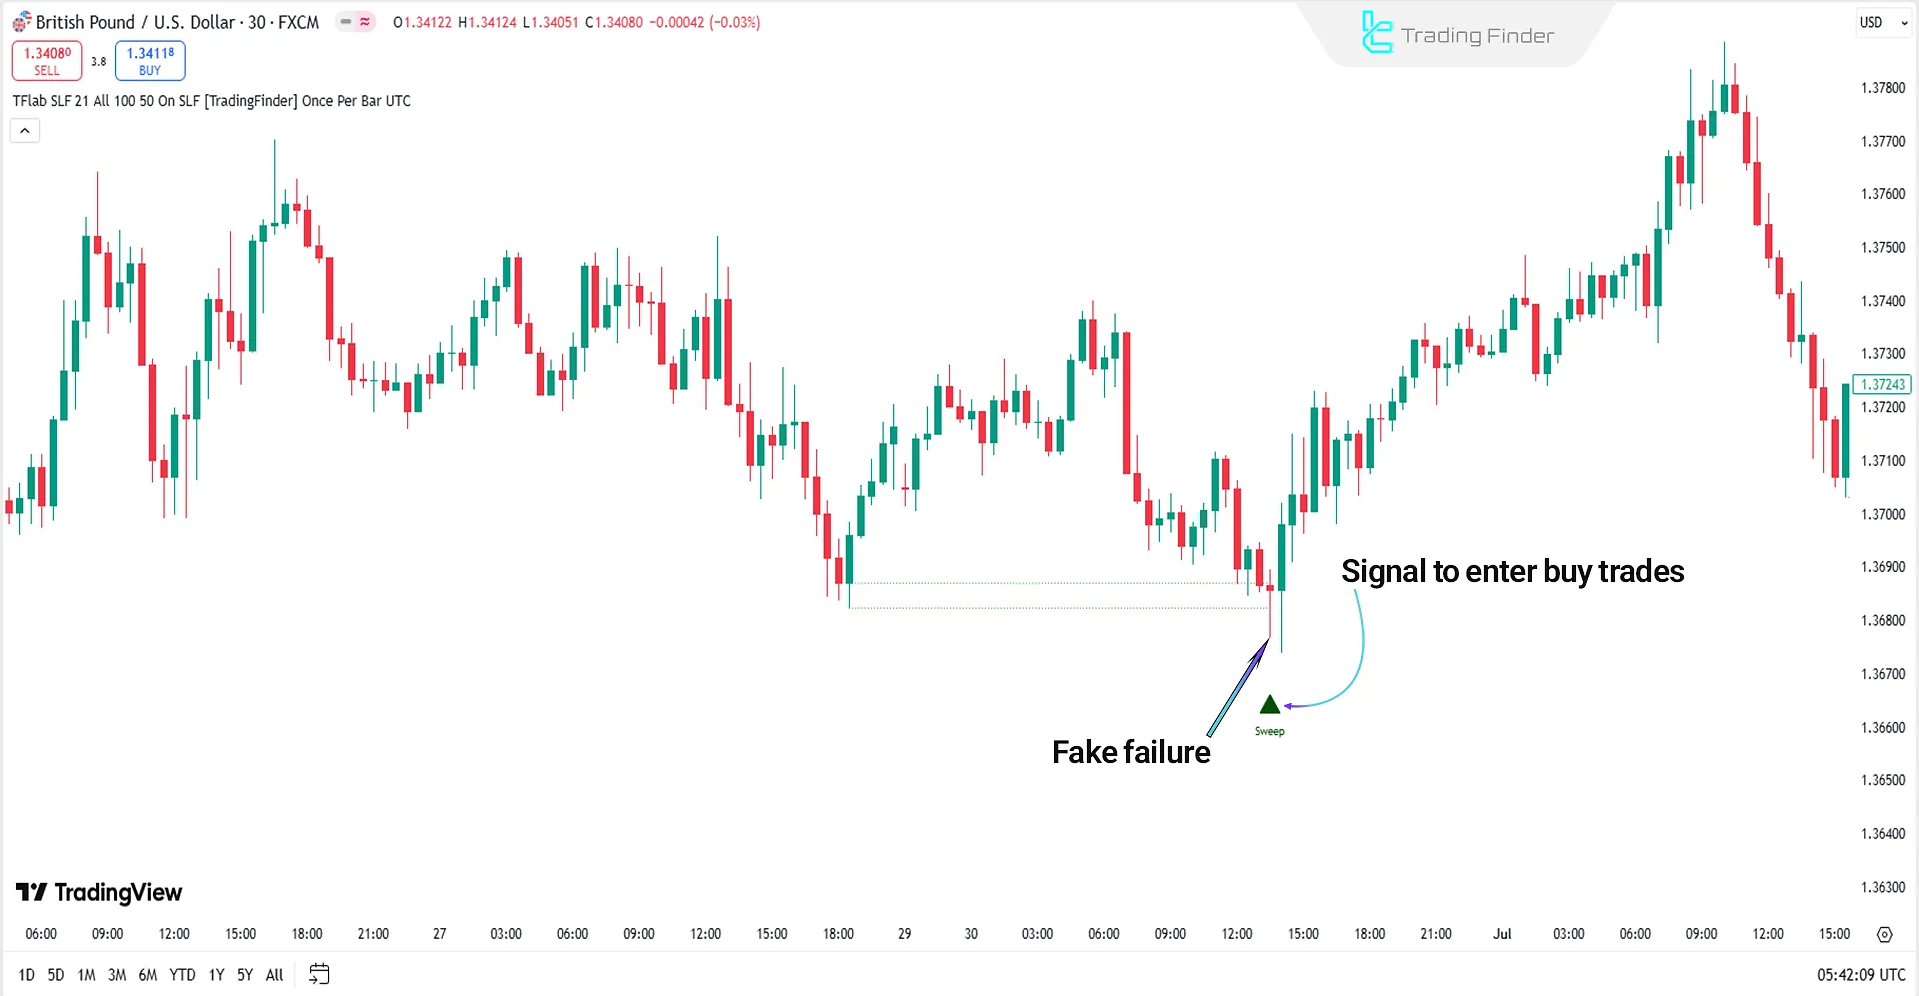
Uptrend Scenario
Following a downtrend, price sweeps the previous swing low and enters the reactive zone between those levels.
Within this area, the formation of a Doji candle closing above the liquidity level shows that price fails to hold below liquidity, suggesting seller weakness and triggering a buy signal.
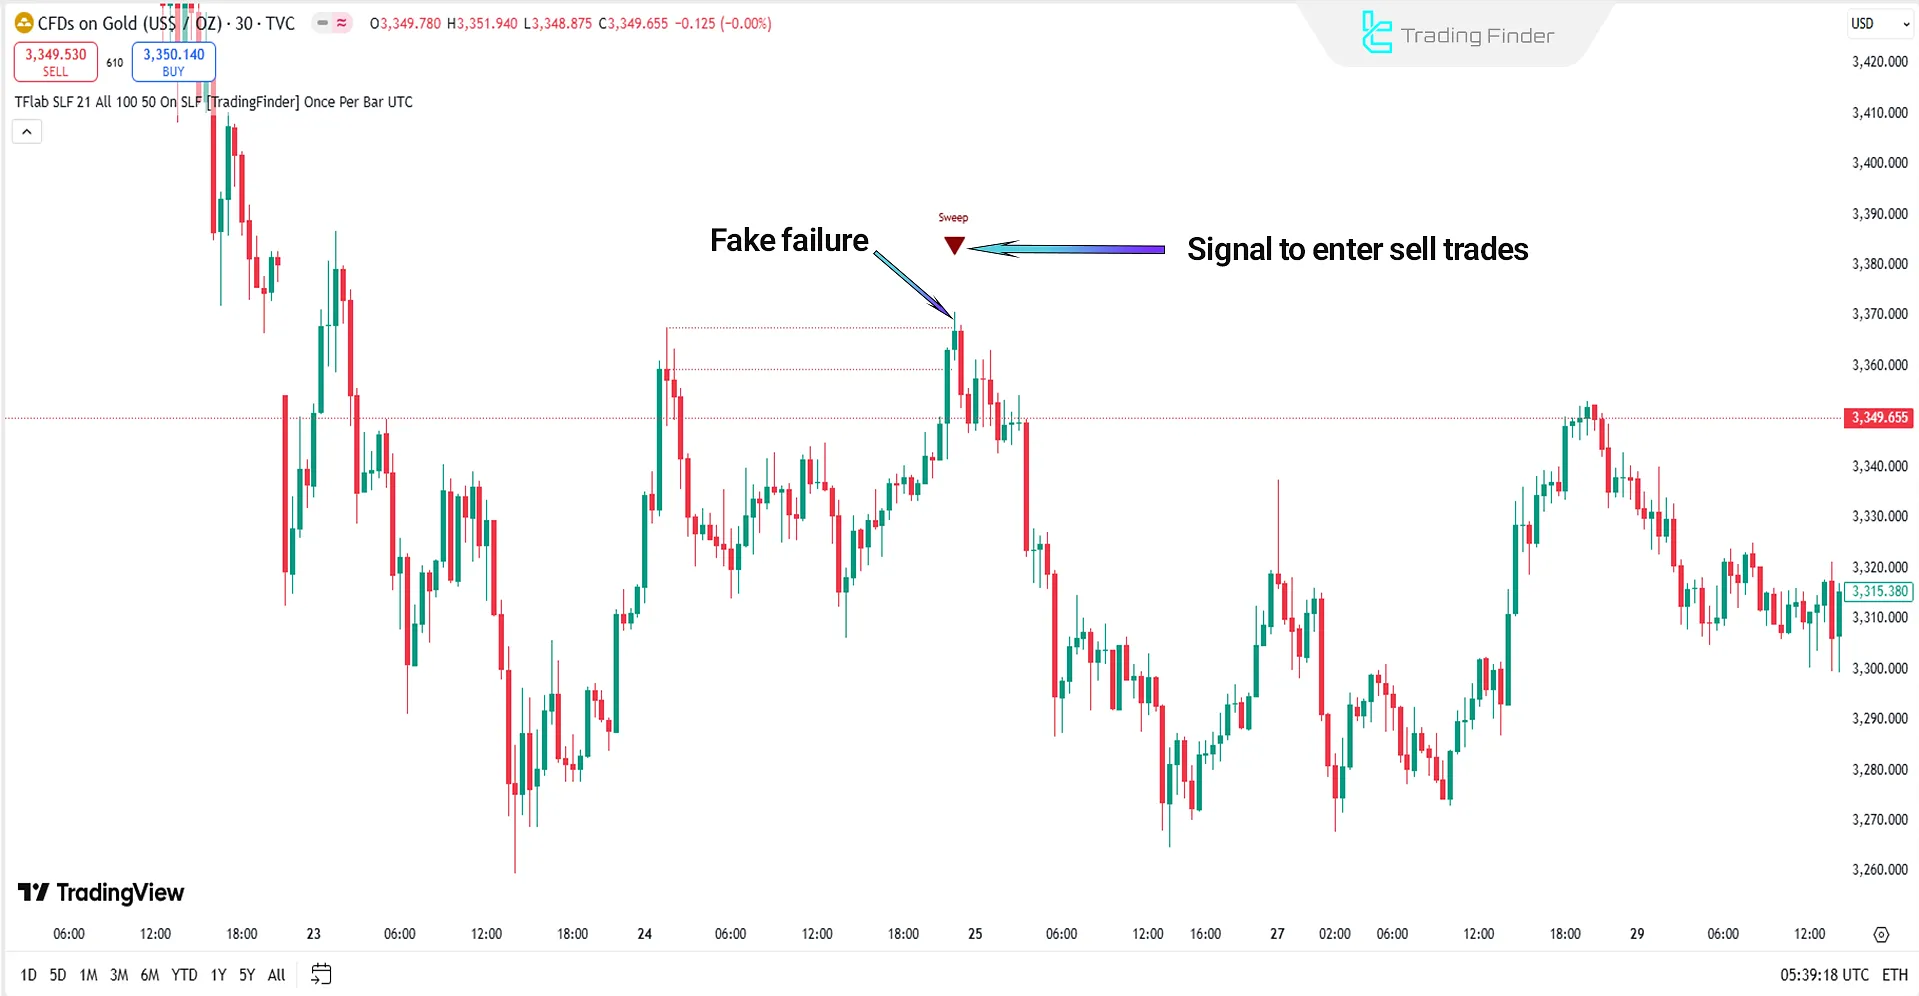
Downtrend Scenario
In an uptrend, price surpasses the previous swing high and enters the reactive zone after sweeping buy-side liquidity.
Here, a candle with a long upper wick and small body forms — an indication of a fake breakout — triggering a sell signal.
ICT Setup 04 Indicator Settings
The settings panel for the ICT Setup 04 Indicator is detailed below:
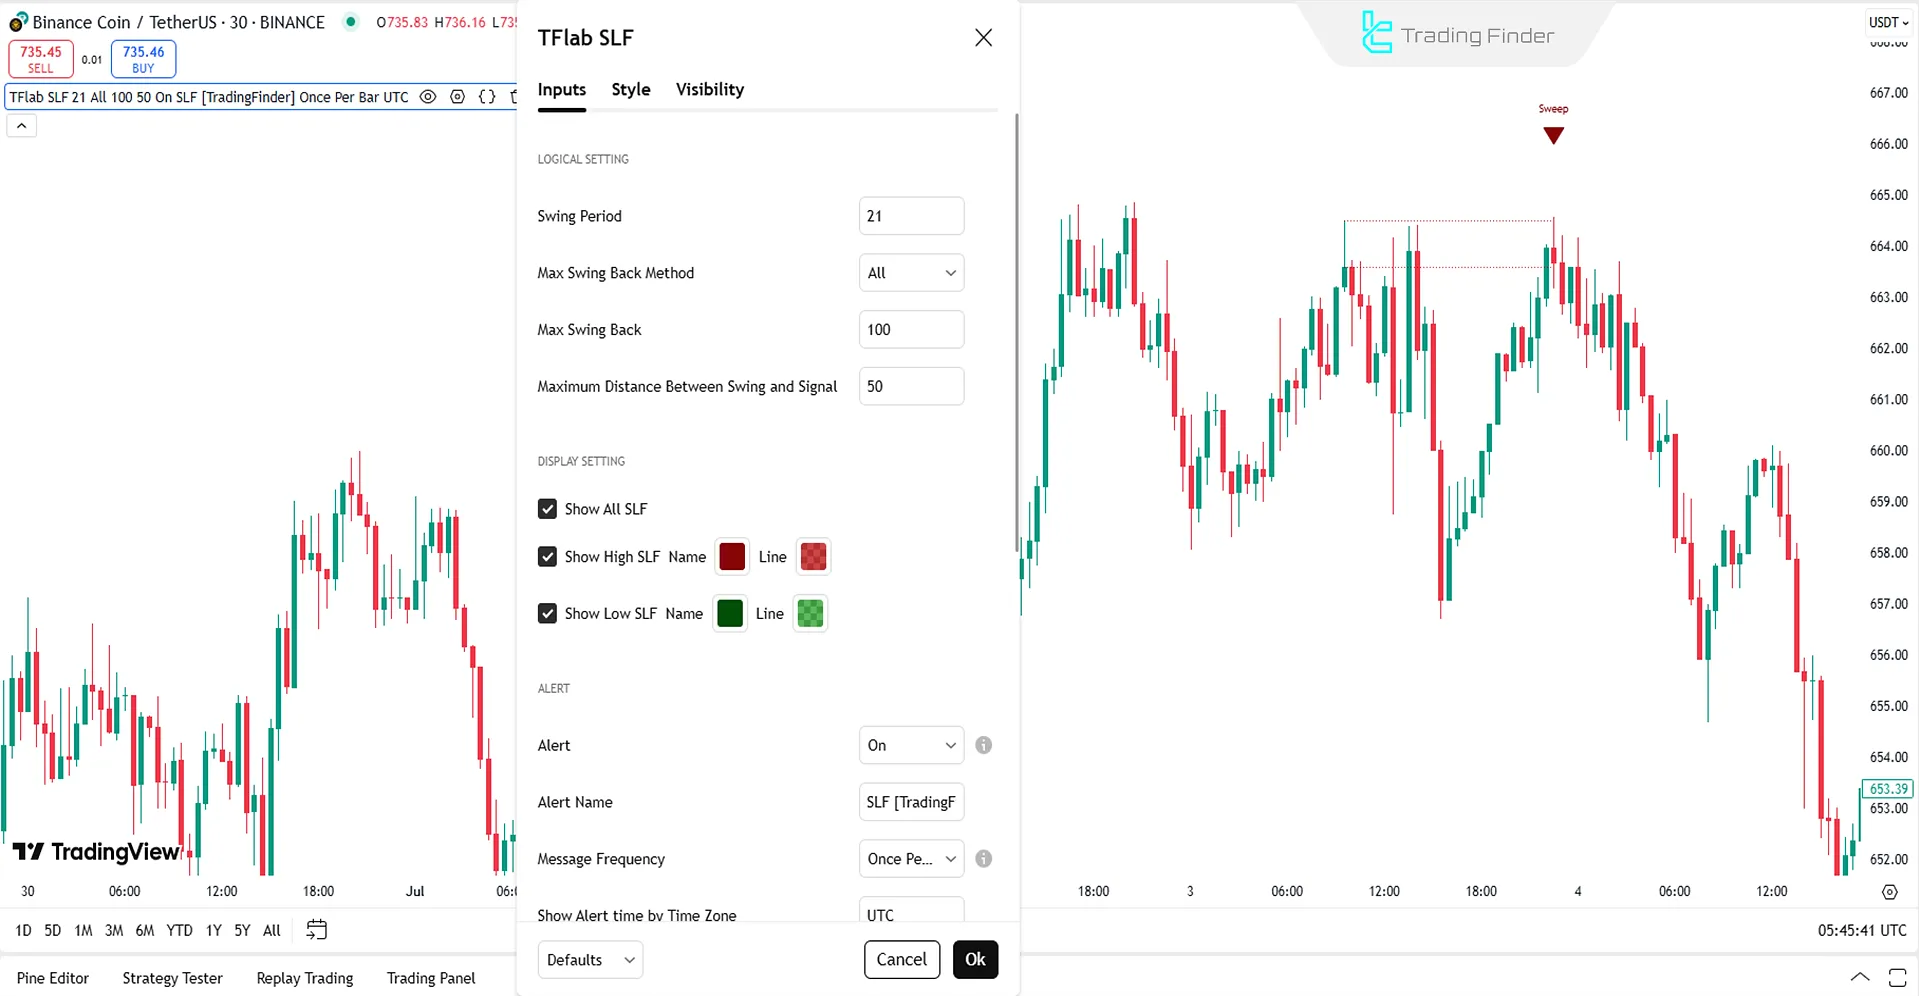
LOGICAL SETTING
- Swing Period: Swing detection period;
- Max Swing Back Method: Method of calculating maximum swing back;
- Max Swing Back: Maximum allowed swing back;
- Maximum Distance Between Swing and Signal: Max distance between swing point and signal trigger.
DISPLAY SETTING
- Show All SLF: Show all SLF levels;
- Show High SLF: Show upper SLF;
- Show Low SLF: Show lower SLF.
ALERT
- Alert: Enable alerts;
- Alert Name: Custom alert name;
- Message Frequency: Message repetition interval;
- Show Alert time by Time Zone: Display alert time based on selected time zone.
Conclusion
The ICT Setup 04 Indicator combines swing analysis, liquidity sweep detection, and candlestick behavior to intelligently identify high-probability reversal zones and pinpoint accurate entry levels.
By merging market structure confirmation and price action, it avoids false breakouts and keeps trades aligned with smart money movement.
ICT Setup 04 Indicator PDF
ICT Setup 04 Indicator PDF
Click to download ICT Setup 04 Indicator PDFDoes the ICT Setup 04 Indicator provide entry signals for both buy and sell trades?
Yes; this tool uses green and red arrows to signal potential buy and sell entries.
Which timeframes are supported by the ICT Setup 04 Indicator?
It is a multi-timeframe indicator and can be used across all timeframes.
Hi TFLab team can you make customize Trading Central's technical analytics indicator for tradingview can auto support/resistance pivot Customize Feature: 1. Can changed color, line like dot, dash, solid 2. Timeframe Chart 3. Can display table Reference for pivot, long position and target

Hello, You can use the available versions on Trading View from the website.
Can you create a TradingView indicator that follows Trading Central’s analysis style? Their charts highlight key support and resistance levels, directional arrows, and target zones, providing a clear and intuitive layout for traders. This kind of visual guidance helps users make informed decisions quickly. Adding an indicator like this to TradingView would benefit those who rely on simple, actionable technical setups for planning trades more effectively.
Thank you for your suggestion. All ideas for future indicator development are carefully considered and reviewed.


