


The ICT Venom Trading Model Indicator is designed based on ICT concepts, aiming to display the initial market range, liquidity sweep, and key reaction zones for price.
This tool first marks the time range between 08:00 and 09:30 New York time; a range known in the Venom strategy as the "Venom Box."
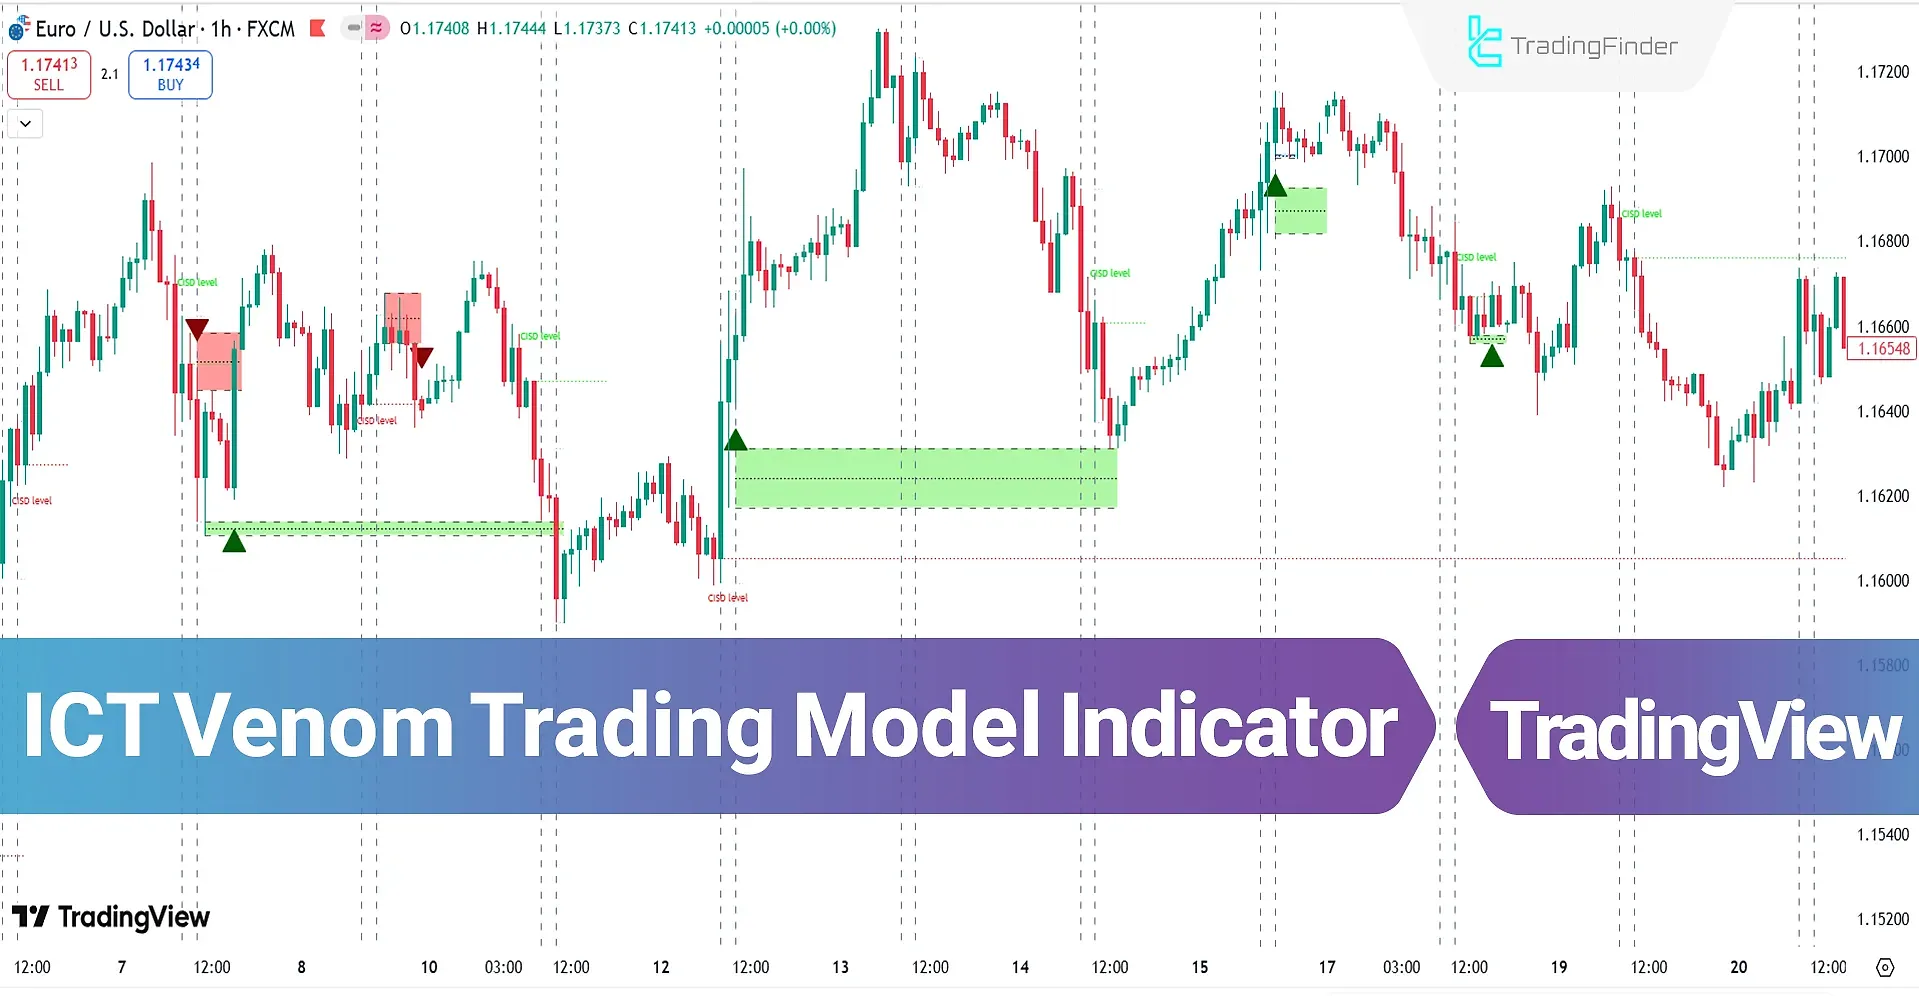
After forming this box, the indicator analyzes price movement during the U.S. market opening and plots the zones with the highest liquidity importance.
Specification Table of ICT Venom Trading Model Indicator
The features of the Venom Trading Model Indicator in ICT style are as follows.
Indicator Categories: | ICT Tradingview Indicators Smart Money Tradingview Indicators Liquidity Tradingview Indicators |
Platforms: | Trading View Indicators |
Trading Skills: | Elementary |
Indicator Types: | Reversal Tradingview Indicators |
Timeframe: | Multi-Timeframe Tradingview Indicators |
Trading Style: | Day Trading Tradingview Indicators Scalper Tradingview Indicators Swing Trading Tradingview Indicators |
Trading Instruments: | TradingView Indicators in the Forex Market Cryptocurrency Tradingview Indicators Share Stocks Tradingview Indicators |
ICT Venom Trading Model Indicator at a Glance
The signal generation of this indicator is based on the ICT Venom strategy. First, the "Venom Box" is placed as the initial high and low market range. Then, at 09:30, the liquidity collection point is revealed, and the "CISD" level is plotted as a sign of price delivery flow shift.
Next, order block and "FVG" zones are defined as entry areas, and in suitable conditions, the indicator displays direction using arrow markers.
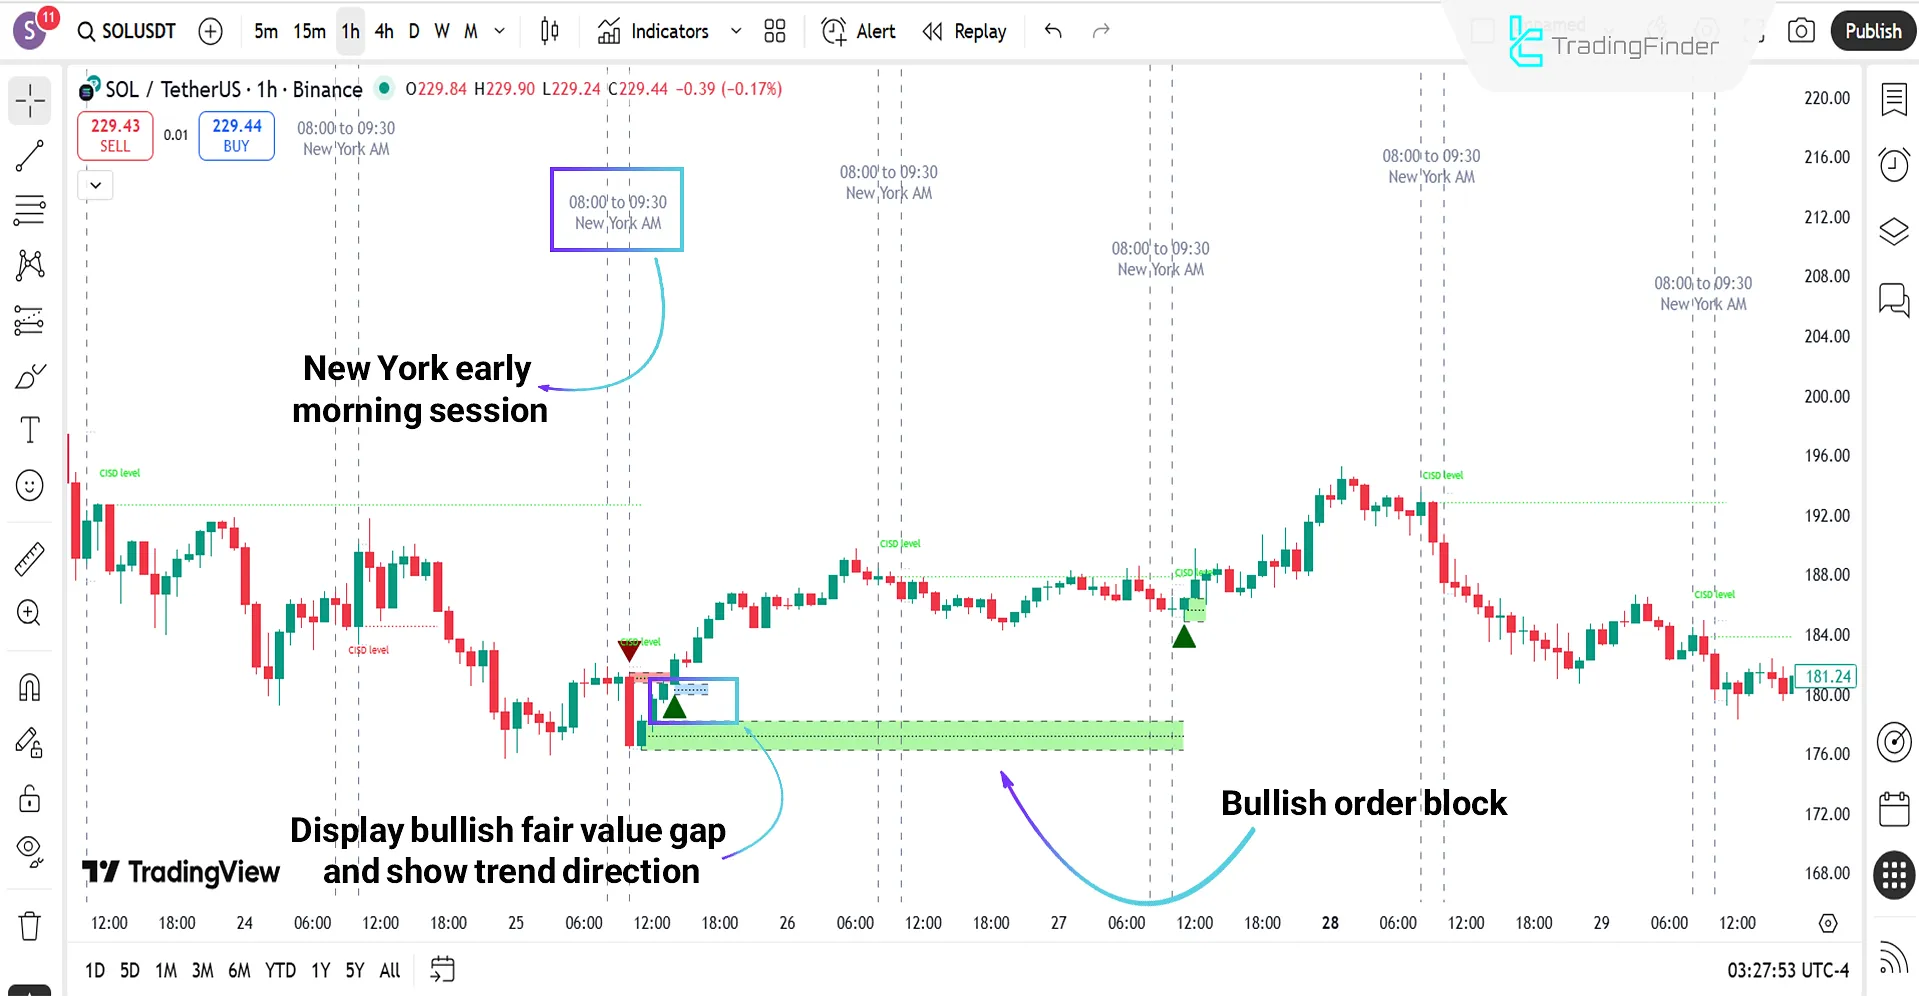
Bullish Trend Conditions
Based on the 1-hour chart of Solana (SOL) cryptocurrency, liquidity at the range low was first accumulated, and the "CISD" level was identified as a sign of flow shift.
Price entering the bullish order block zone (green box) shows a positive reaction. Afterwards, a green arrow indicates the bullish direction and continuation upward.
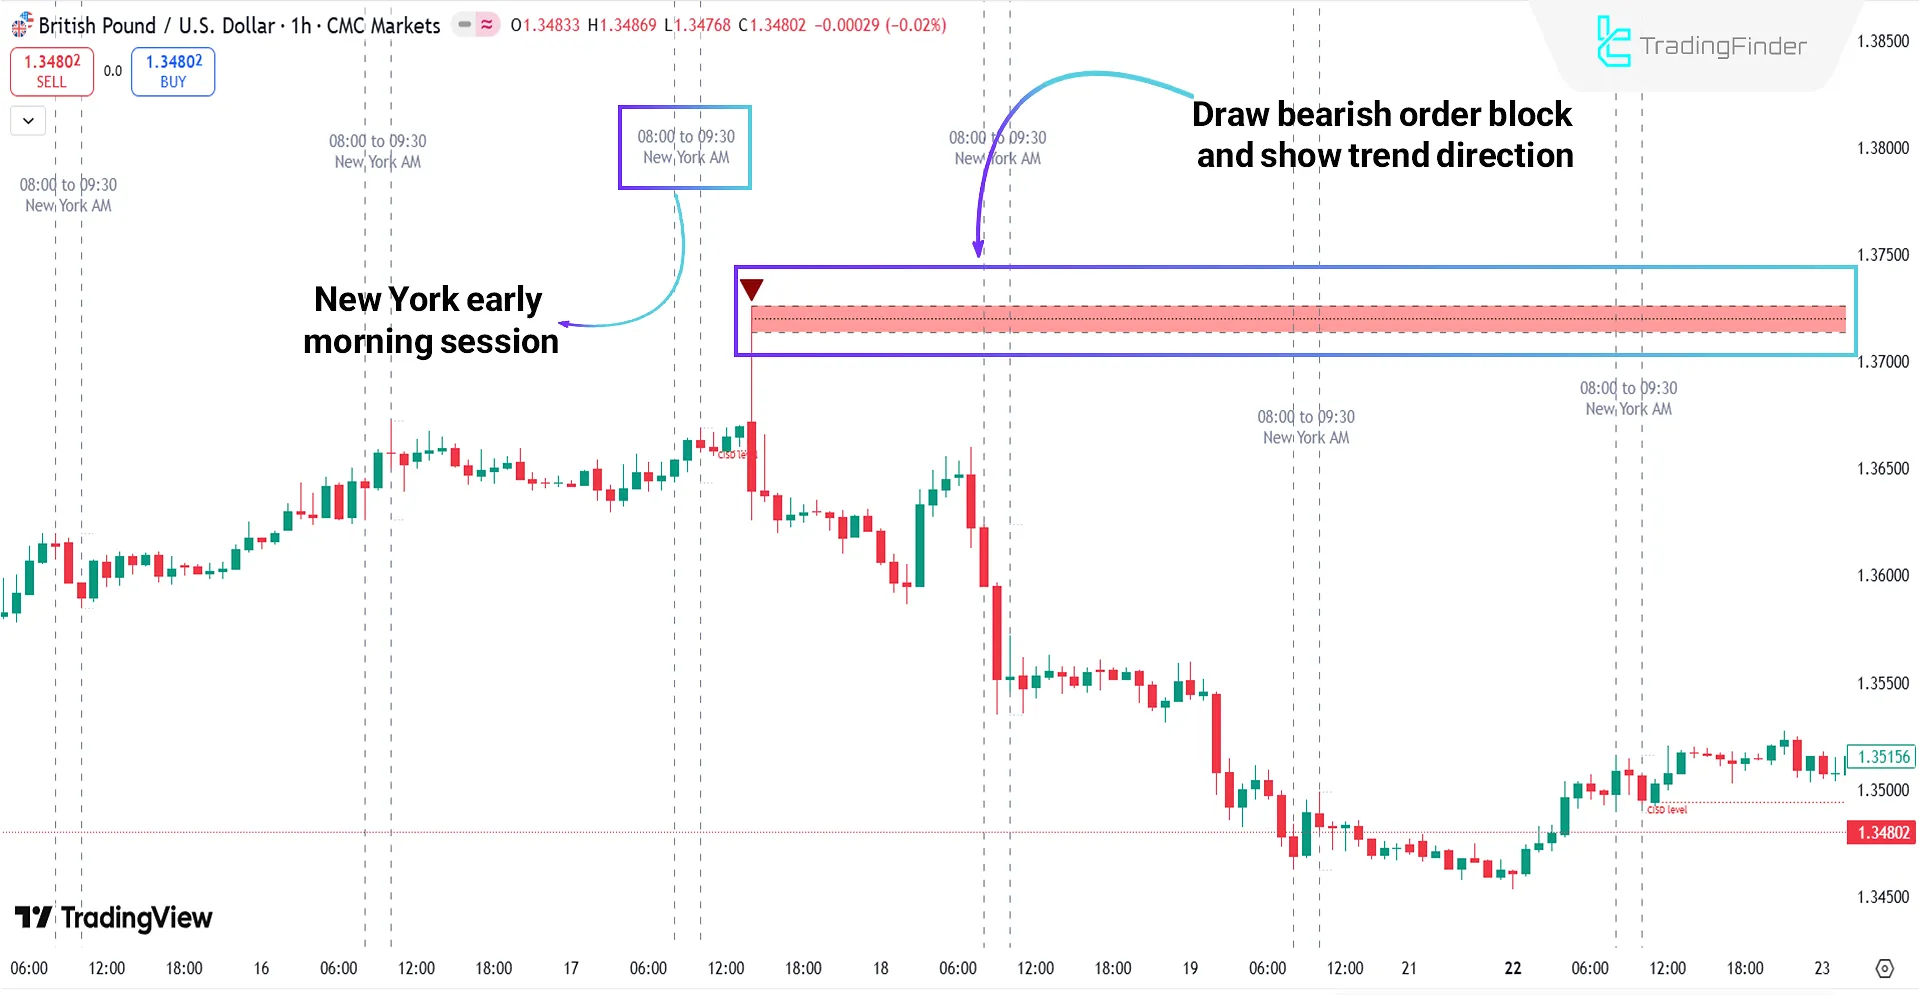
Bearish Trend Conditions
According to the GBP/USD 1-hour chart, the New York early morning session range is first marked. Then, liquidity above the range is collected, followed by a false breakout to the upside.
Next, a bearish order block zone is plotted, acting as the main resistance. Price reaction from this zone highlights the bearish trend direction and shows continuation toward lower levels.
ICT Venom Trading Model Indicator Settings
The settings panel of the ICT Venom Trading Model Indicator is as shown below:
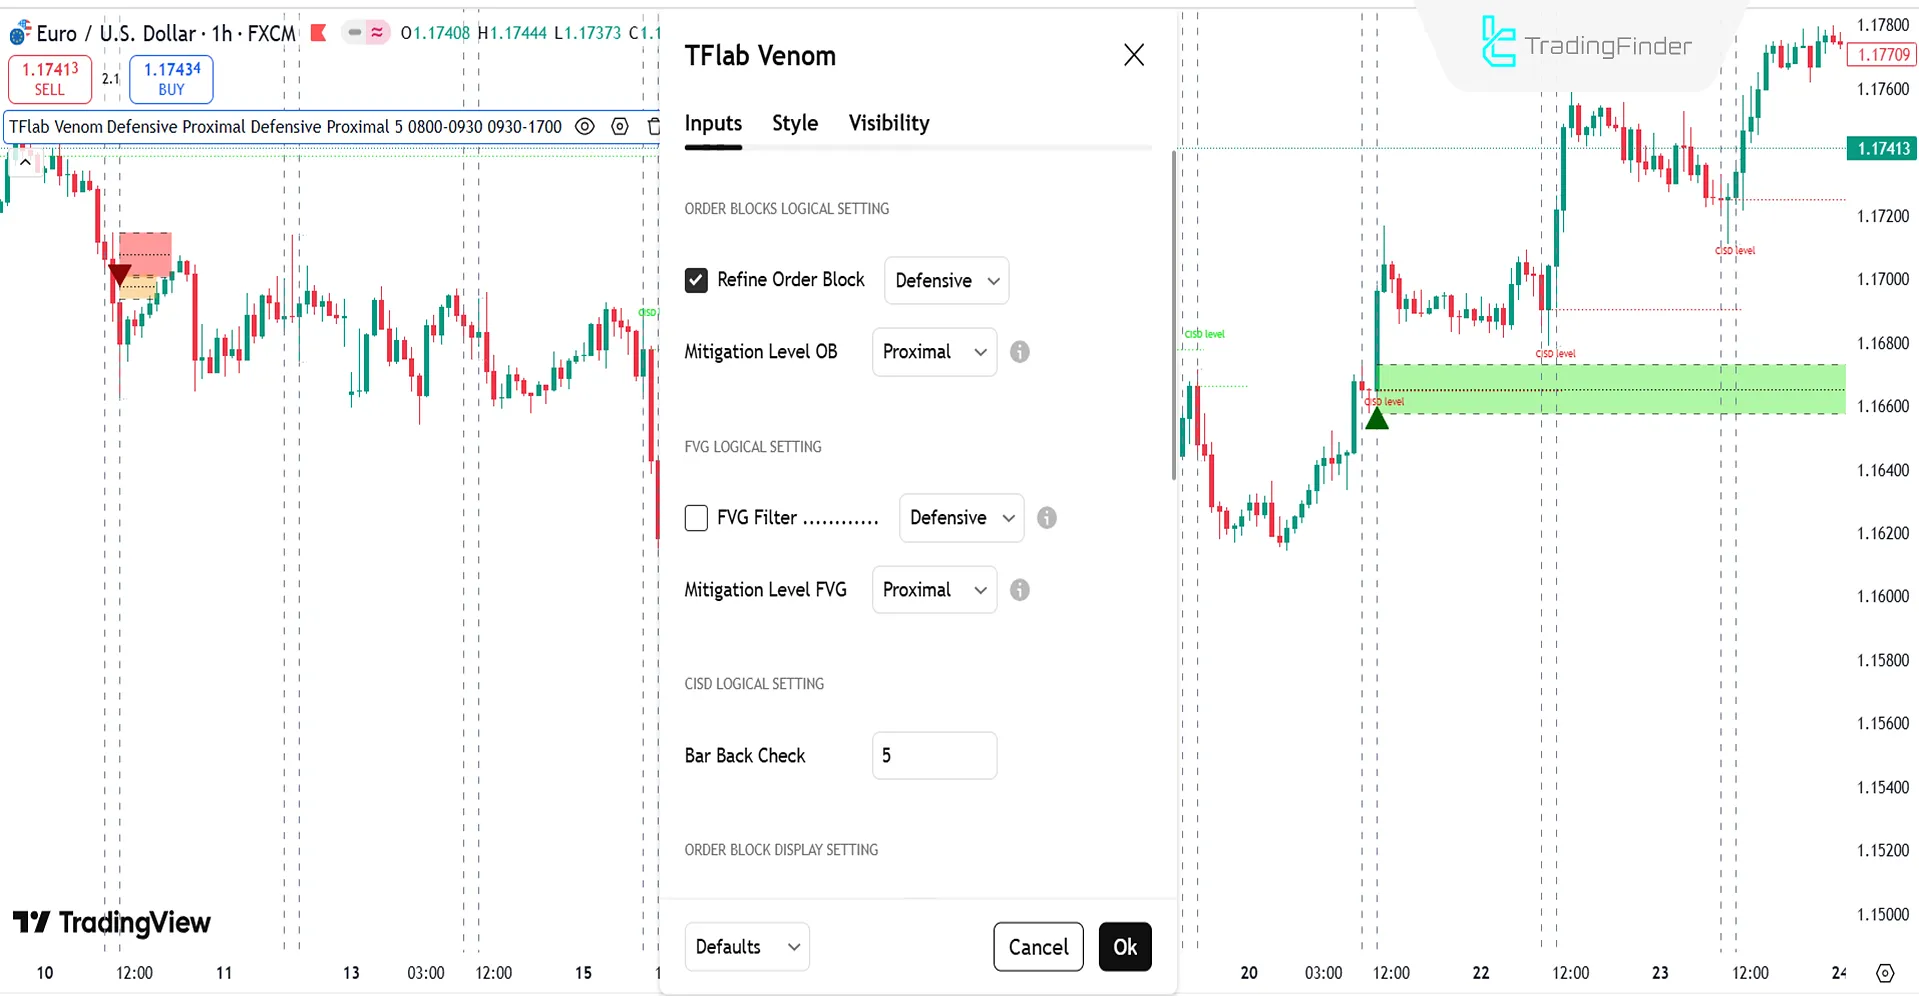
Order Blocks Logical Setting
- Refine Order Block: Refined selection for higher accuracy in order block plottingپ
- Mitigation Level OB: Reaction level in the order block
FVG Logical Setting
- FVG Filter: Type of filter for fair value gap
- Mitigation Level FVG: Reaction level in FVG zone
CISD Logical Setting
- Bar Back Check: Number of previous candles to check CISD level
Order Block Display Setting
- Demand Order Block: Show demand order block
- Supply Order Block: Show supply order block
FVG Display Setting
- Demand FVG: Show demand fair value gap
- Supply FVG: Show supply fair value gap
CISD Display Setting
- Show All CISD: Display all CISD levels
- Show High CISD Name: Display high CISD level
- Show Low CISD Name: Display low CISD level
Time Settings
- Opening Range: Initial market time range
- Trading Permit: Permitted trading range
Input Values
- Inputs in status line: Show input values in status bar
Conclusion
The ICT Venom Trading Model Indicator is designed to identify the initial market range, liquidity collection, and key price reaction zones.
By marking the "Venom Box" and CISD levels, this indicator clarifies trade entry conditions. Moreover, by displaying entry and exit signals with arrow markers, it makes bullish and bearish trend analysis more precise and practical.
ICT Venom Trading Model Indicator PDF
ICT Venom Trading Model Indicator PDF
Click to download ICT Venom Trading Model Indicator PDFWhat is the Venom Box?
It is the time range between 08:00 and 09:30 New York, considered the initial market range in the Venom strategy.
What is the best timeframe to use?
The ICT Venom Trading Model Indicator is multi-timeframe and can be applied across all time ranges.


