


TradingView
MetaTrader4
MetaTrader5
The Multi TF Oscillator Screener is a specialized and advanced technical tool that displays up to 10 customizable trading symbols, allowing traders to monitor multiple assets across different timeframes on TradingView.
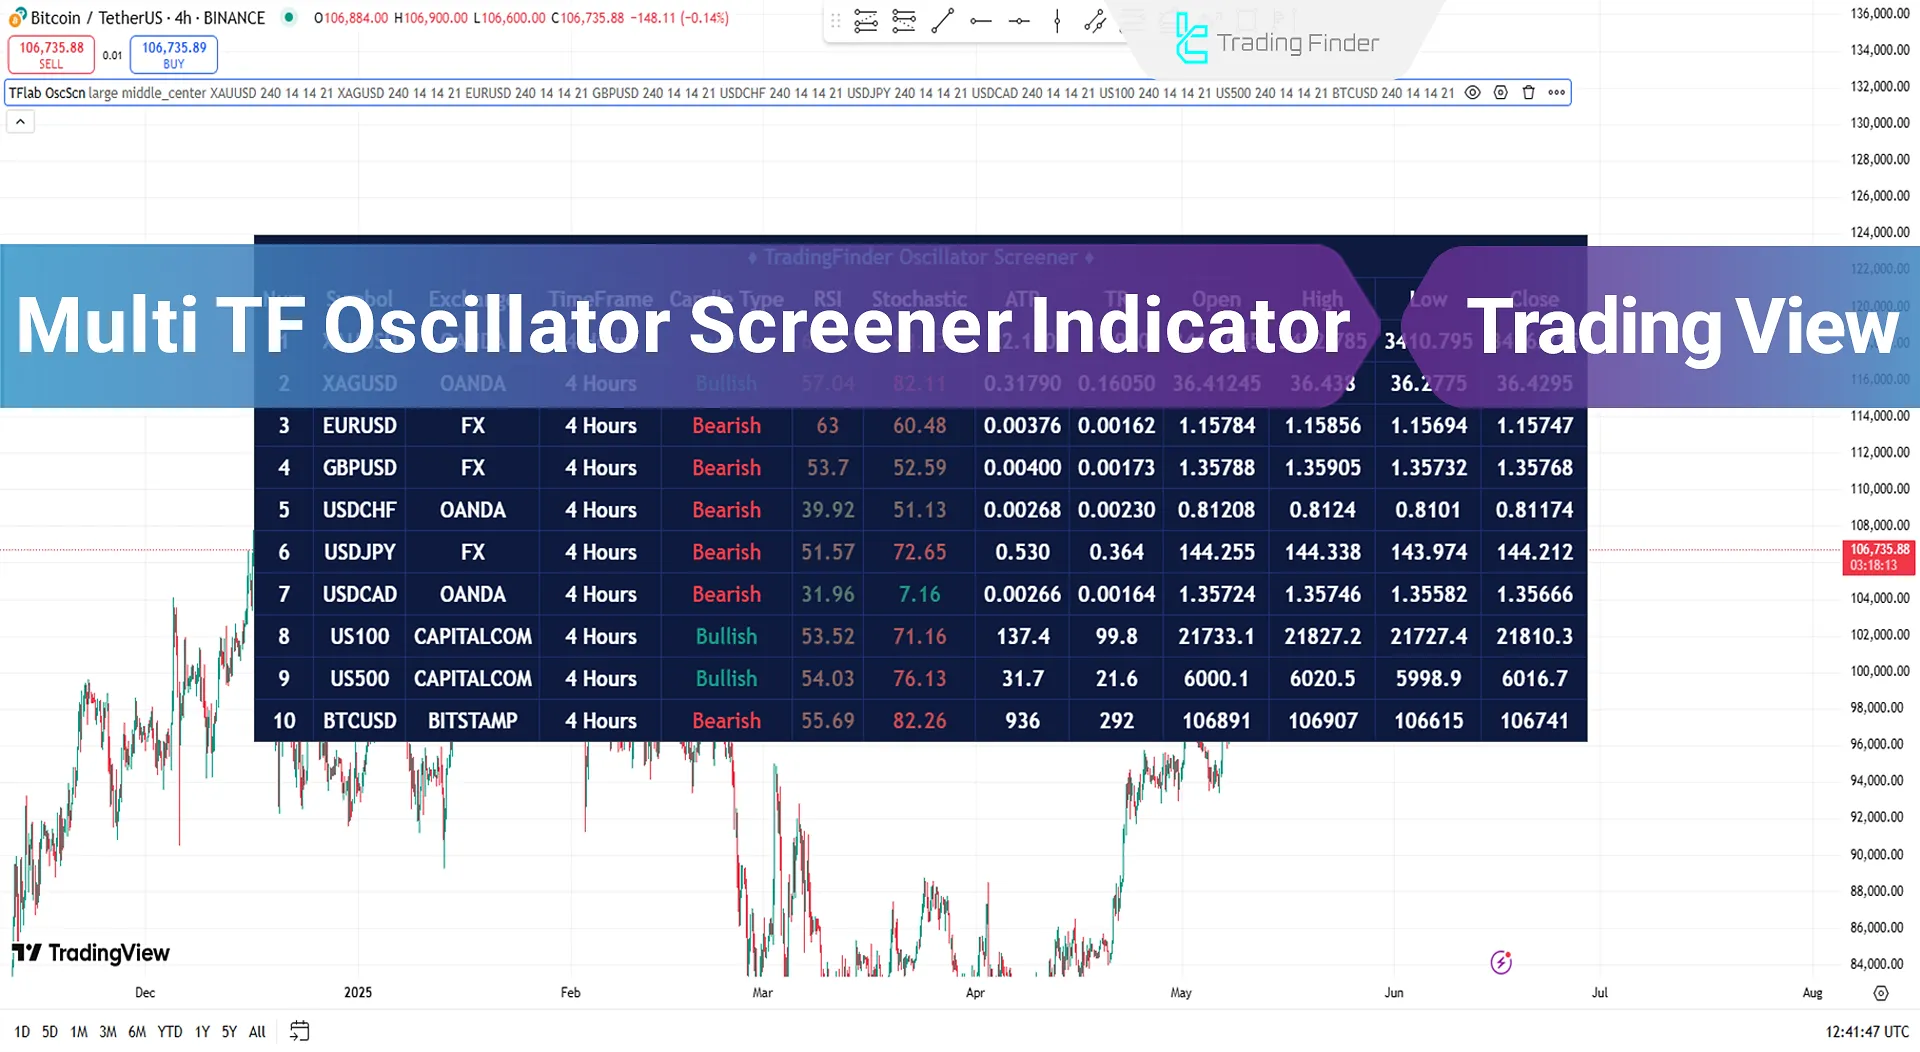
This indicator provides a comprehensive panel that shows the status of each symbol using essential indicators like RSI and Stochastic, and also displays the nature of the last candlestick to indicate whether the trend is bullish or bearish.
Multi TF Oscillator Screener Table
The general specifications of the Multi TF Oscillator Screener are presented in the table below:
Indicator Categories: | Oscillators Tradingview Indicators Signal & Forecast Tradingview Indicators Trading Assist Tradingview Indicators |
Platforms: | Trading View Indicators |
Trading Skills: | Advanced |
Indicator Types: | Leading Tradingview Indicators Entry & Exit TradingView Indicators |
Timeframe: | Multi-Timeframe Tradingview Indicators |
Trading Style: | Intraday Tradingview Indicators Day Trading Tradingview Indicators Scalper Tradingview Indicators |
Trading Instruments: | TradingView Indicators in the Forex Market Stock Tradingview Indicators Indices Tradingview Indicators Share Stocks Tradingview Indicators |
Overview of the Indicator
The Multi TF Oscillator Screener is a unique tool that enables traders to monitor up to 10 symbols across various timeframes.
Equipped with a comprehensive panel, it delivers insights into each symbol using key metrics such as RSI, Stochastic, ATR, and the latest candlestick information—all easily accessible for thorough analysis.
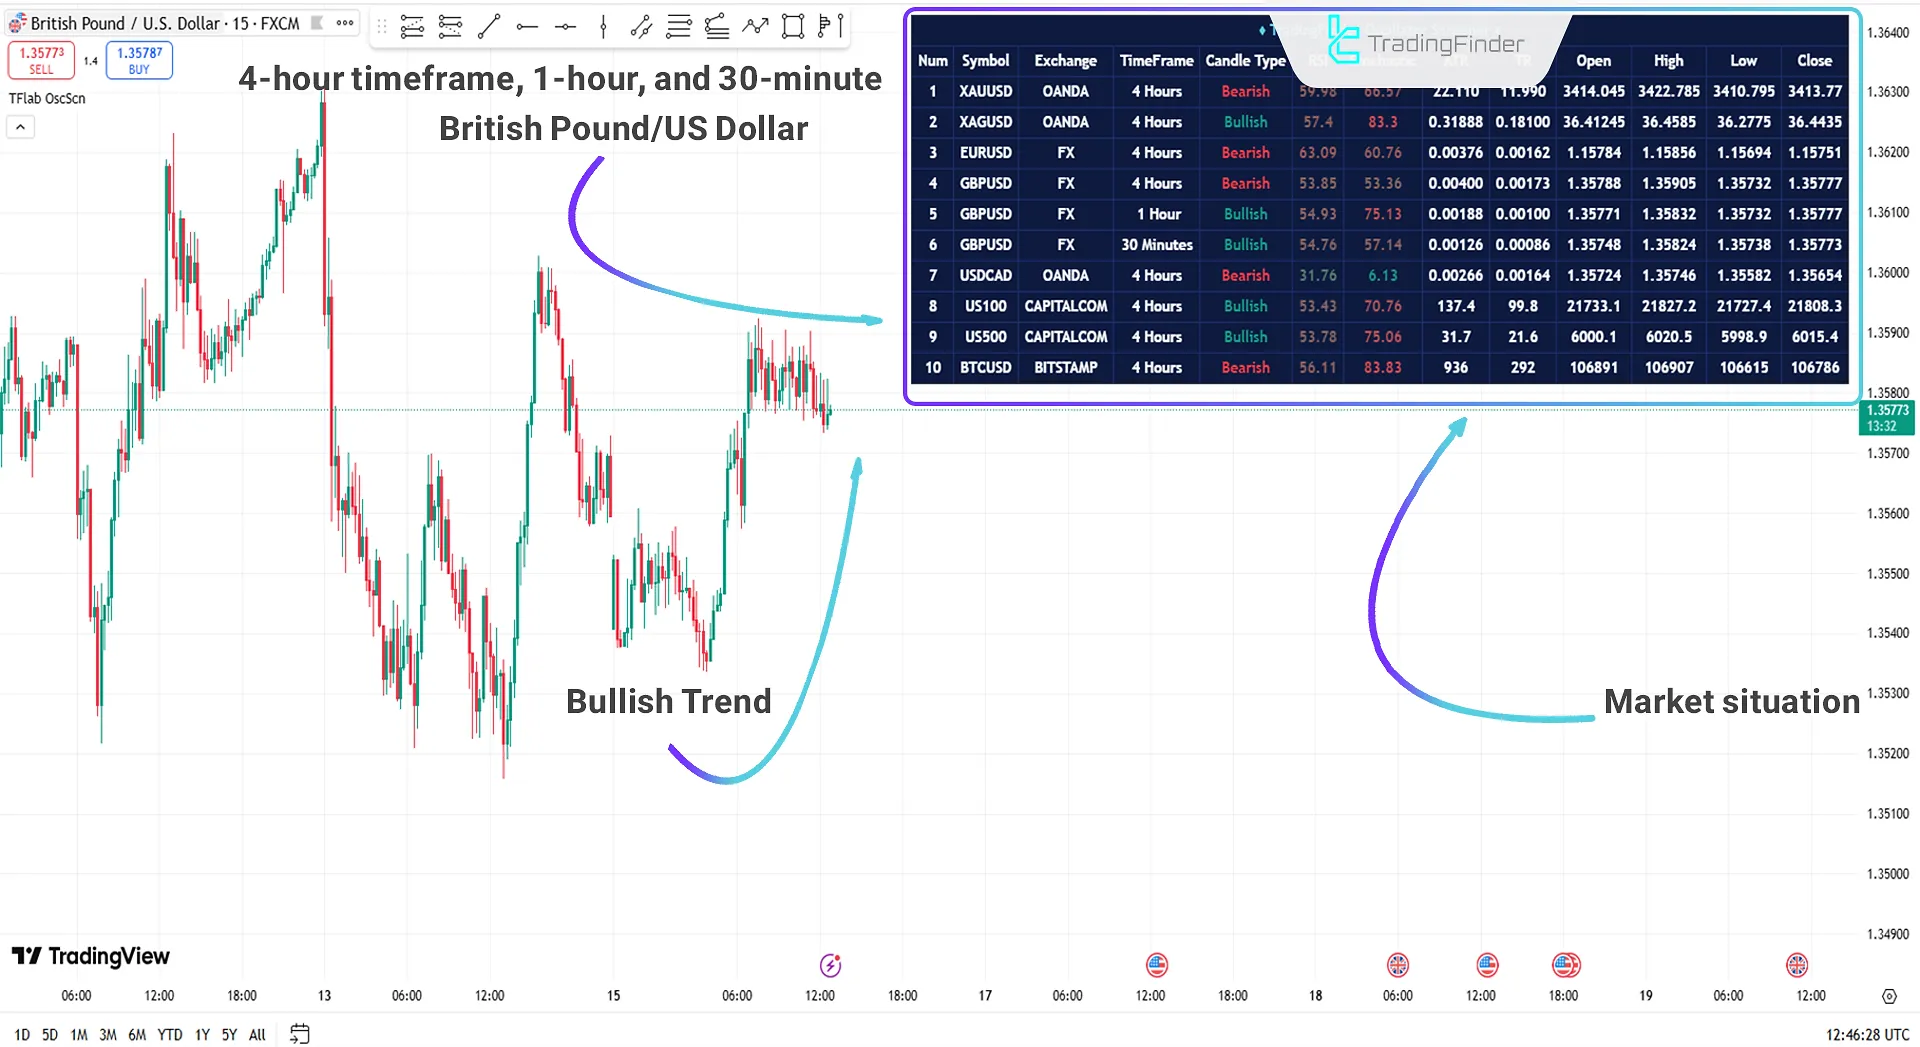
Multi-Timeframe Bullish Analysis
In the 15-minute chart of the GBP/USD currency pair, the Multi TF OscillatorScreener displays a variety of data.
Using the top-right panel on the chart, traders can examine the state of each symbol in the selected chart.
In the chart below, the recent trend was bullish. The panel shows the GBP/USD symbol in three different timeframes, allowing traders to conduct in-depth analysis regarding the current trend and price movement across multiple timeframes.
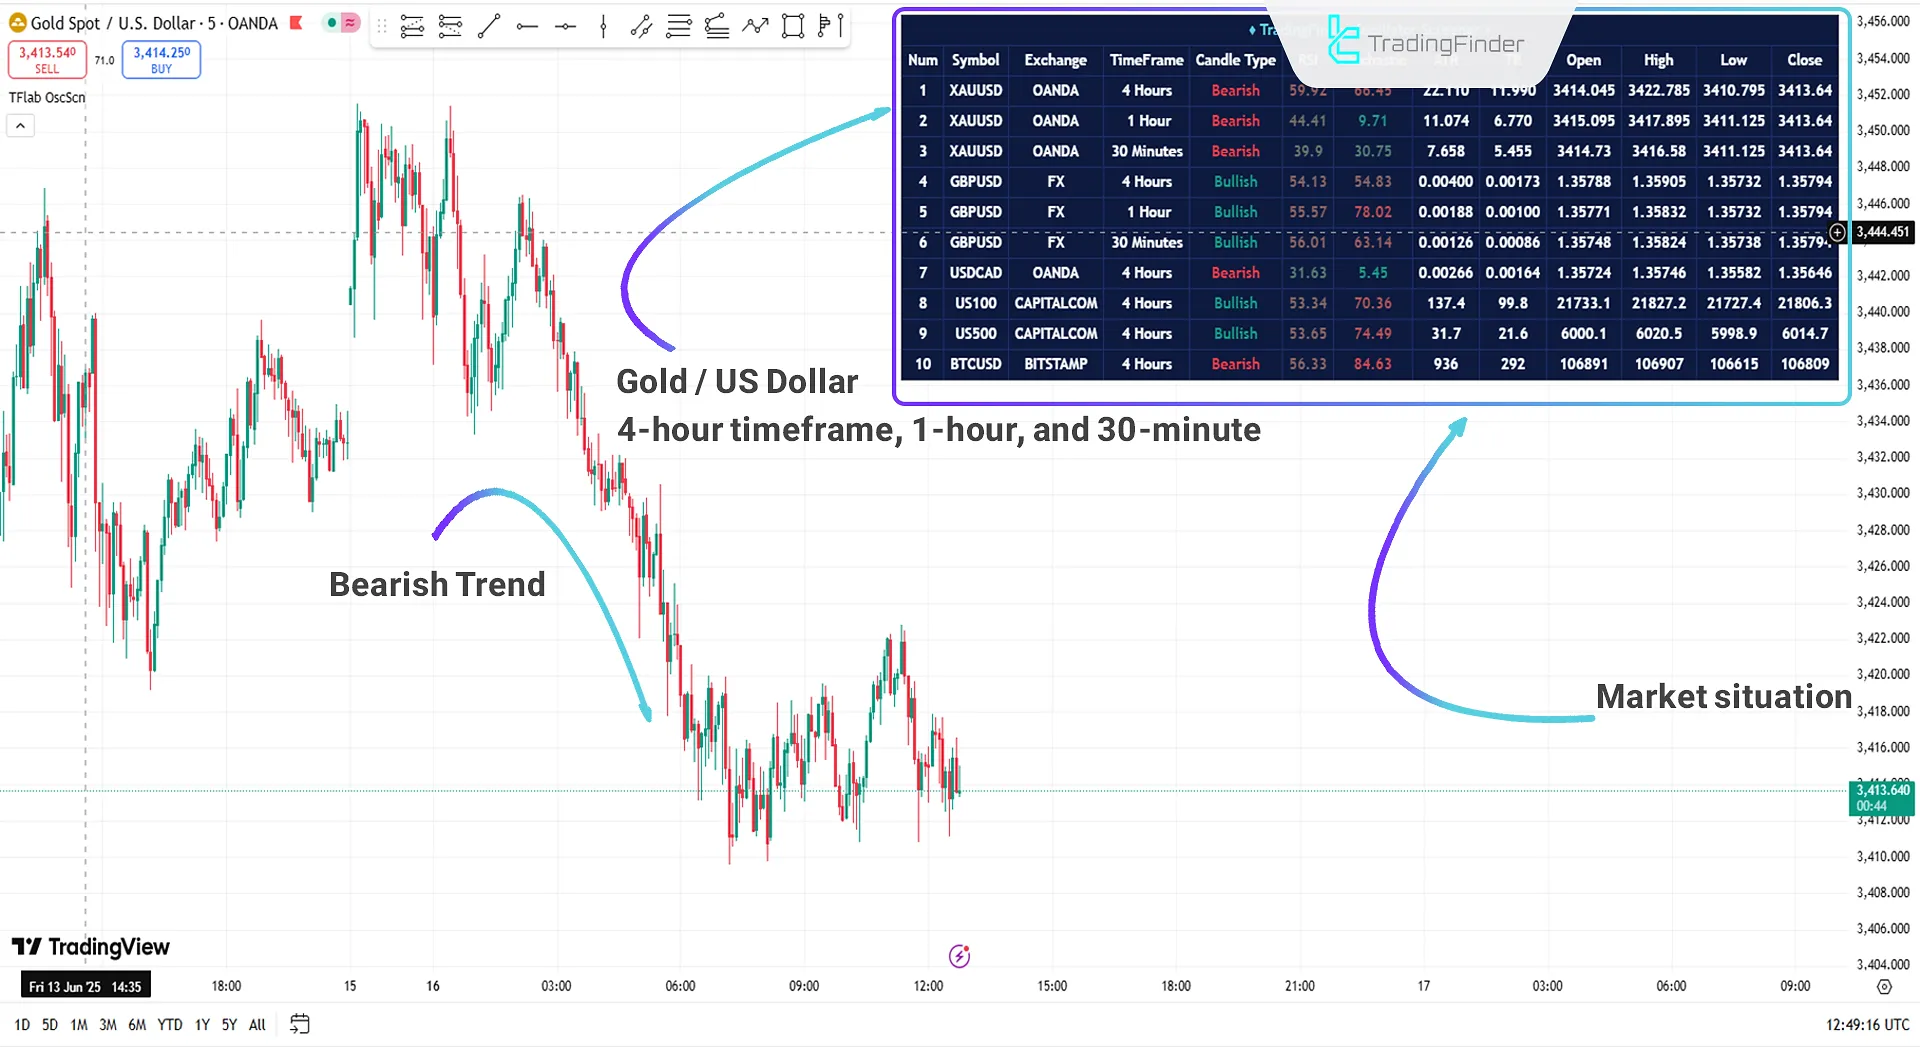
Multi-Timeframe Bearish Analysis
On the 5-minute chart of Gold (XAU/USD), the screener displays the symbol's status in three different timeframes.
The panel shows that the last candlestick in all three timeframes for XAU/USD is bearish. This enables traders to identify trends within their desired timeframes and make more informed trading decisions.
Multi TF Oscillator Screener Settings
The following section outlines the available settings for the Multi TF Oscillator Screener:
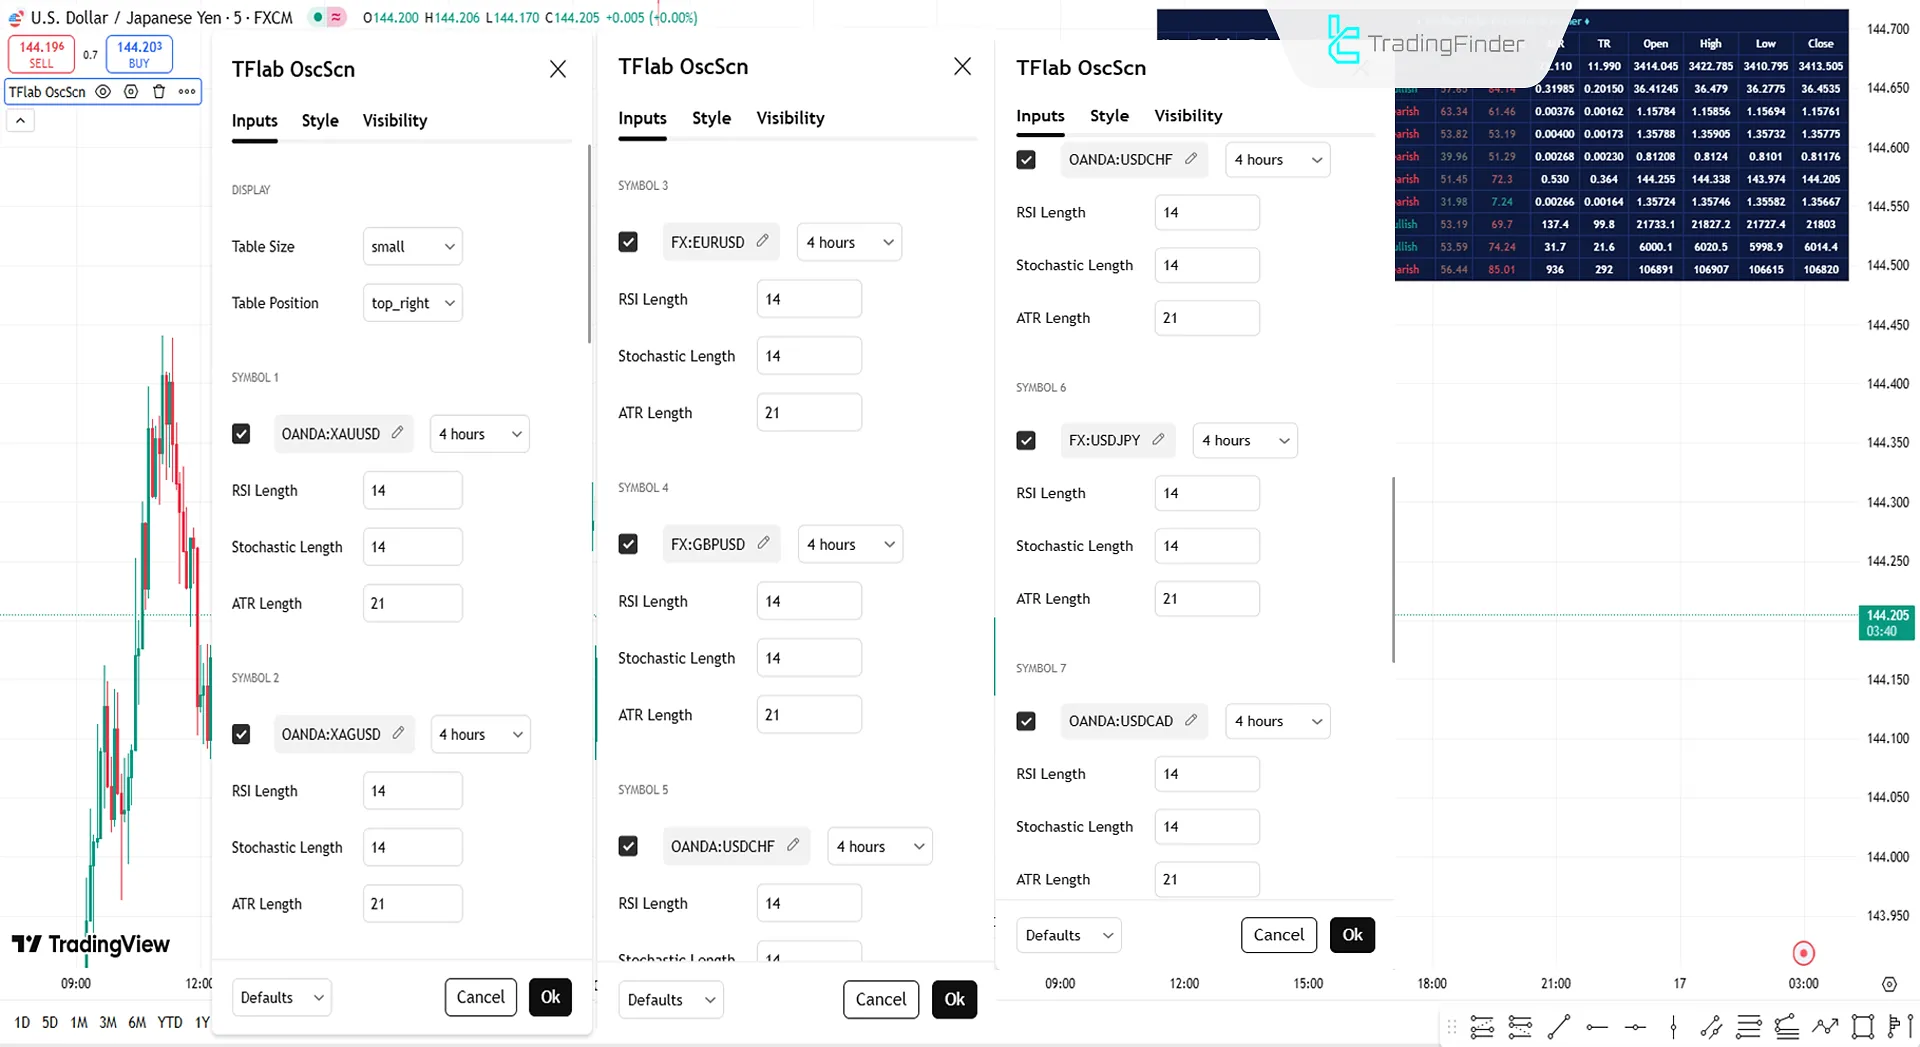
Display
- Table Size: Adjust panel size
- Table Position: Set panel location
Symbol
- Symbol: Select trading symbol
- Time Frame: Choose the symbol’s timeframe
- RSI Length: Set RSI period
- Stochastic: Configure Stochastic period
- ATR: Set ATR period
Conclusion
The Multi TF Oscillator Screener offers a powerful panel that facilitates more specialized analysis for Forex traders.
Traders can analyze up to 10 trading symbols within one panel. It provides comprehensive data on the latest candlestick, and by displaying values for Stochastic, RSI, and ATR, it delivers a clearer understanding of each asset across multiple timeframes.
Adding The Multi TF Oscillator Screener TradingView PDF
Adding The Multi TF Oscillator Screener TradingView PDF
Click to download Adding The Multi TF Oscillator Screener TradingView PDFWhat Is the Multi-Timeframe Oscillator Screener?
This indicator is a comprehensive and specialized panel designed for multi-timeframe analysis, providing traders with complete information on each symbol to keep them updated on market conditions.
Can the Trading Symbols Be Changed in the Multi-Timeframe Oscillator Screener?
Yes, this indicator allows for changing trading symbols along with the timeframe of each symbol.


