


TradingView
MetaTrader4
MetaTrader5
The Divergence Signal Indicator displays positive and negative divergences on the chart as red boxes (downtrend) and gray boxes (uptrend). These signals indicate potential changes in market trends.
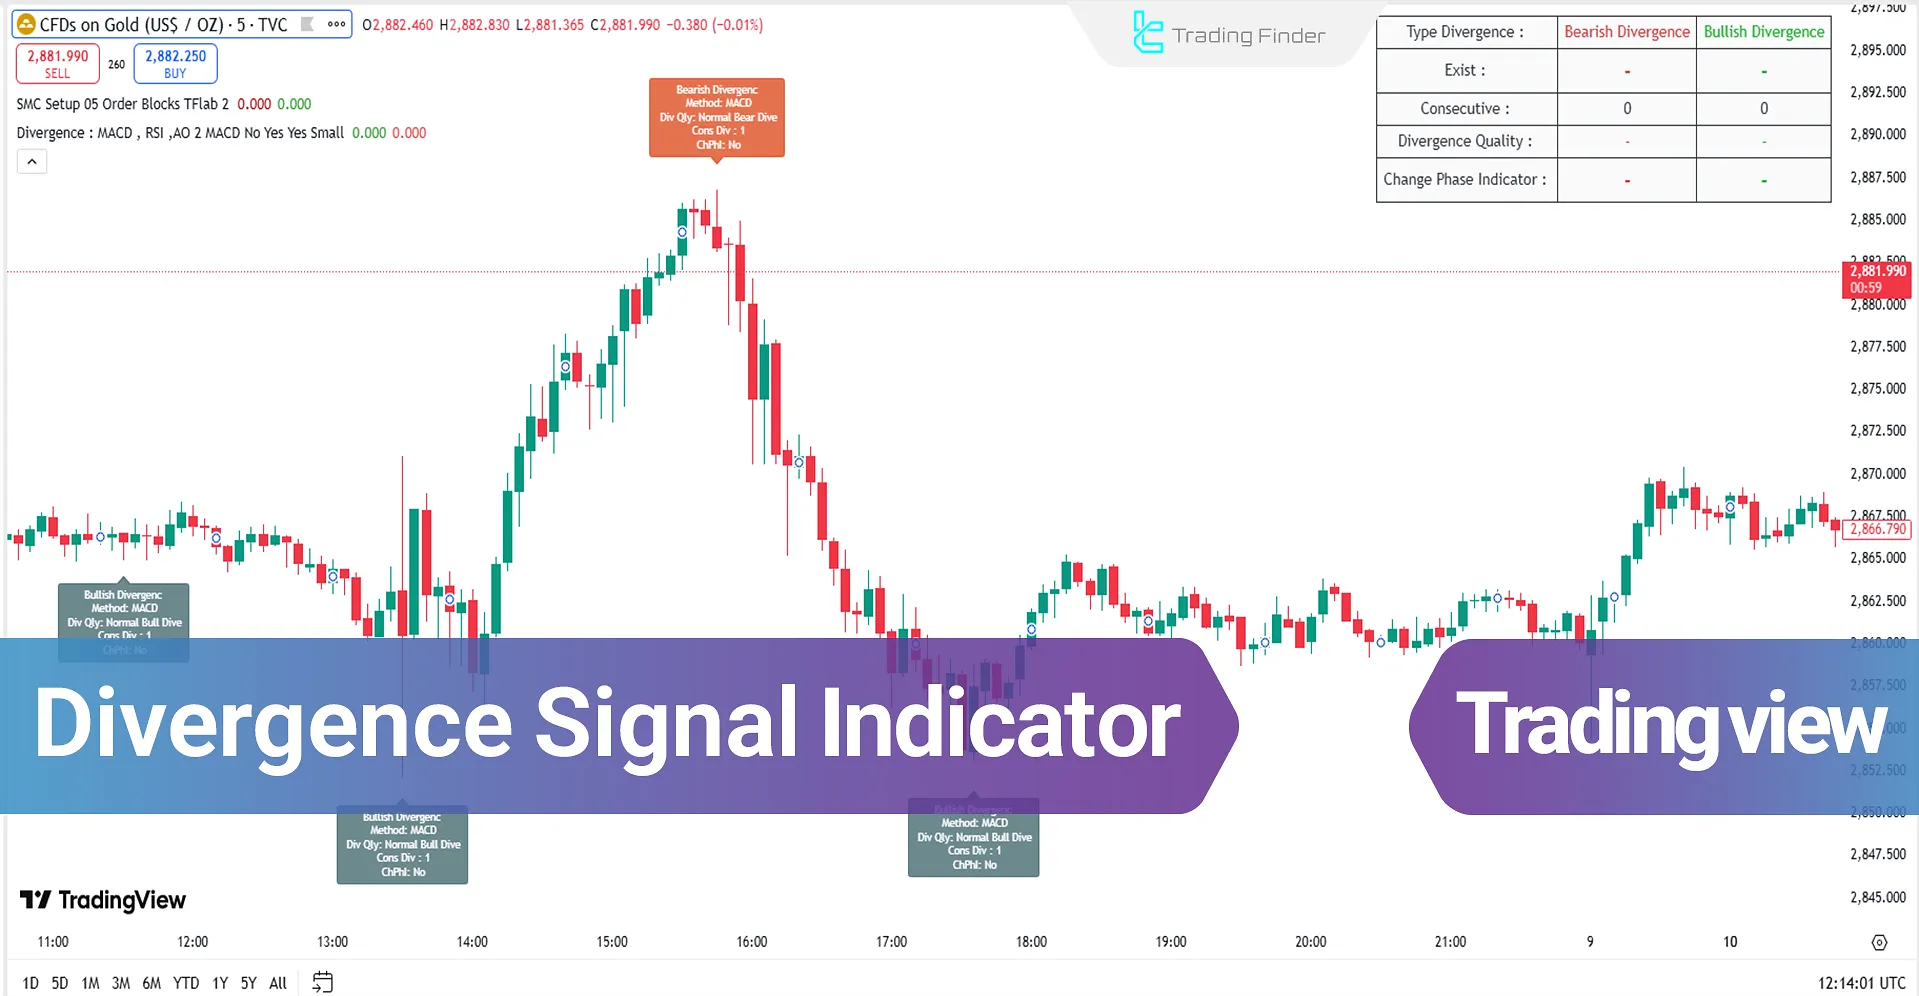
This TradingView Trading Assistant provides signals for identifying trend reversals or continuations of price movements.
Divergence Signal Indicator Specifications
The specifications of the Divergence Signal Indicator are shown in the table below:
Indicator Categories: | Oscillators Tradingview Indicators Currency Strength Tradingview Indicators Trading Assist Tradingview Indicators |
Platforms: | Trading View Indicators |
Trading Skills: | Elementary |
Indicator Types: | Reversal Tradingview Indicators |
Timeframe: | Multi-Timeframe Tradingview Indicators |
Trading Style: | Day Trading Tradingview Indicators |
Trading Instruments: | TradingView Indicators in the Forex Market Cryptocurrency Tradingview Indicators Stock Tradingview Indicators Commodity Tradingview Indicators Indices Tradingview Indicators Forward Tradingview Indicators Share Stocks Tradingview Indicators |
Indicator Overview
The Divergence Signal Indicator on TradingView identifies divergences between price movements and various indicators such as MACD, RSI, and AO.
The volume of trades and price momentum can also be used to confirm the validity of divergence signals for entry and exit points.
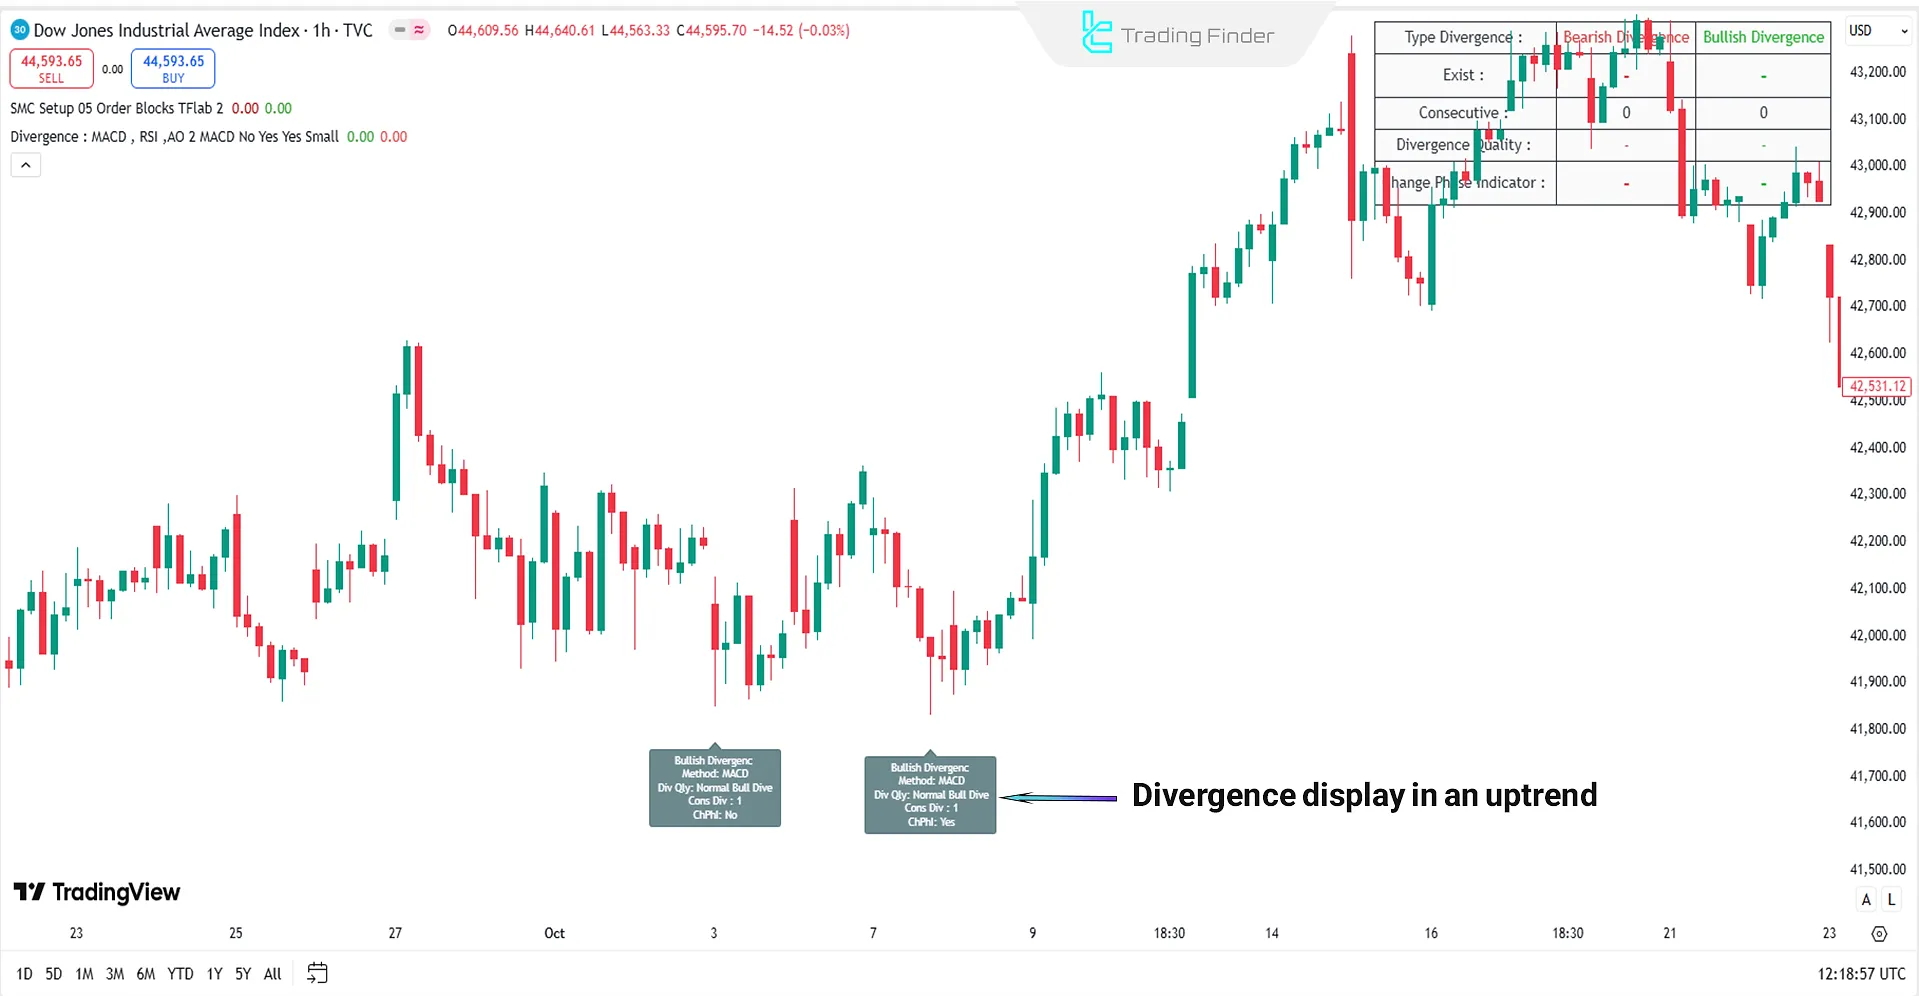
Positive Divergence
In the price chart of the Dow Jones Index (DJI) in a one-hour timeframe, a positive divergence occurs in the Divergence Signal Indicator when the price moves downward and creates a lower low. In comparison, the MACD indicator shows the opposite movement and forms a higher low.
This type of divergence is displayed as gray boxes on the chart and indicates the possibility of a trend reversal from bearish to bullish.
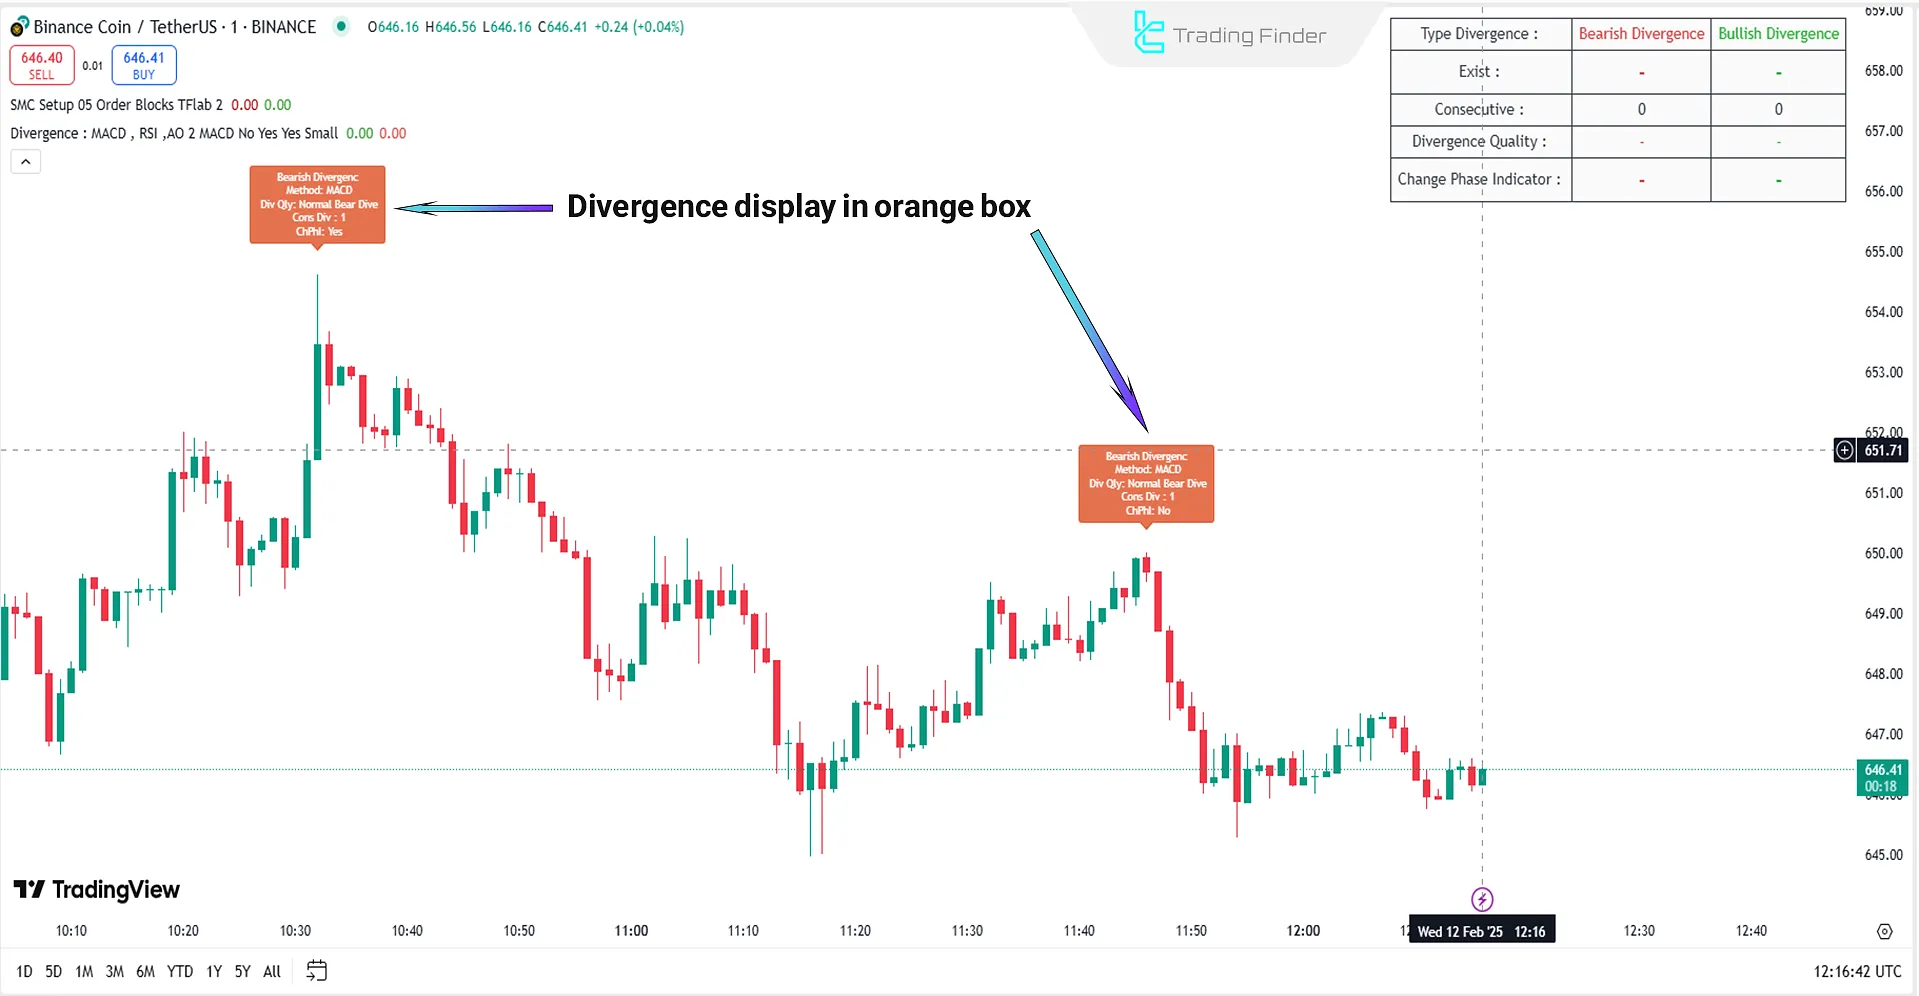
Negative Divergence
The price chart of BNB on a one-minute timeframe in the TradingView Indicator shows a negative divergence at the end of an uptrend between two price peaks.
In this scenario, a new peak is formed in the price chart, but the MACD indicator does not identify this peak or create a new one.
This situation indicates weakness in the uptrend and increases the likelihood of a trend reversal to bearish.
Indicator Settings
The settings panel for the Divergence Signal Indicator is shown in the image below:
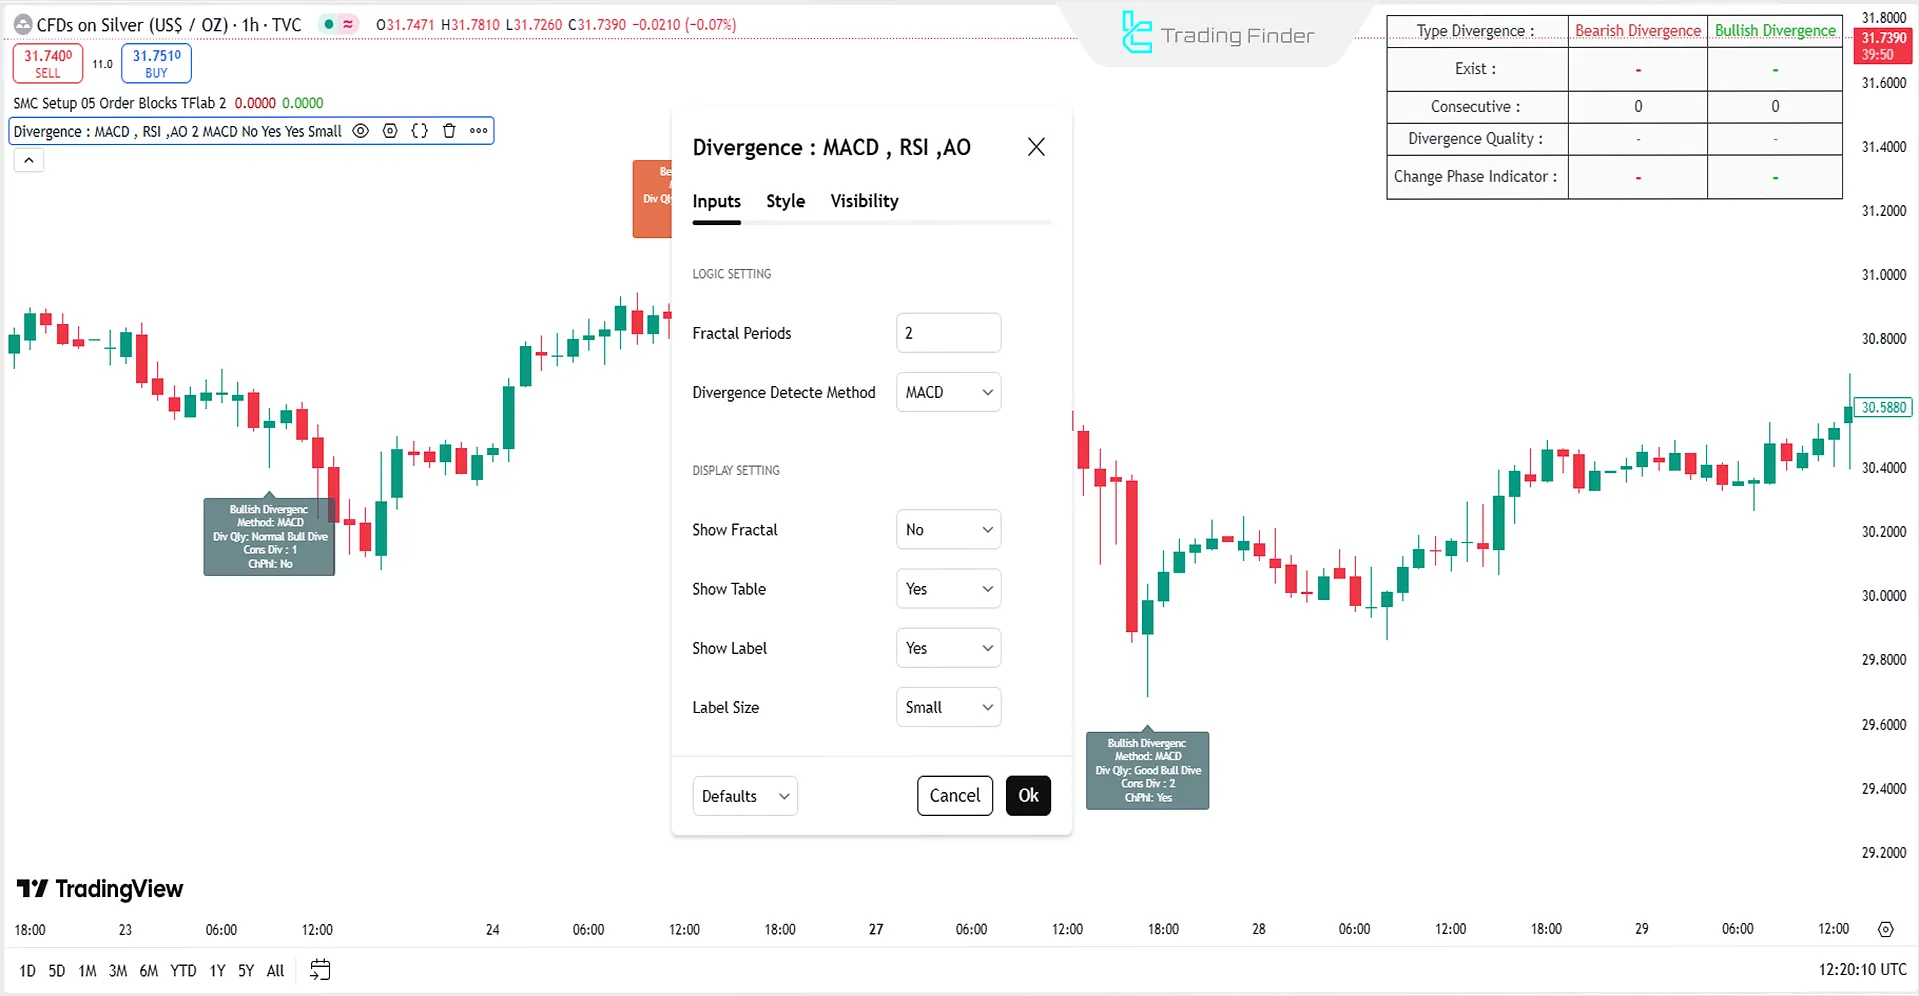
Logic Setting
- Fractal Periods: Fractal periods
- Divergence Detect Method: Divergence detection method
Display Setting
- Show Fractal: Display fractal
- Show Table: Display table
- Show Label: Display label
- Label Size: Label size
Conclusion
The Divergence Signal Indicator on TradingView uses three technical analysis indicators to display information about each divergence precisely at the point of occurrence in a gray or orange box.
This information includes the type of divergence, detection method, and consecutive divergences, which can be used to find appropriate entry or exit points.
On Divergence Signal TradingView PDF
On Divergence Signal TradingView PDF
Click to download On Divergence Signal TradingView PDFIn which timeframes can the Divergence Signal Indicator be used?
This tool can be used in multiple timeframes.
Is this indicator applicable in all financial markets?
This tool can be used in all financial markets, including Forex, cryptocurrencies, commodities, and stocks.


