


TradingView
MetaTrader4
MetaTrader5
The Quarterly Theory ICT 02 Indicator is a TradingView ICT Indicator focused on the Quarterly Theory and 90-minute trading sessions, enabling traders to analyze market structure and identify key entry/exit points.
By leveraging concepts like "True Open" and critical price levels, this indicator helps traders forecast market movements based on real price behavior and analyze bullish and bearish trends with precision.
Quarterly Theory ICT 02 Indicator Table
Below are the general specifications of the indicator.
Indicator Categories: | ICT Tradingview Indicators Smart Money Tradingview Indicators Cycles Tradingview Indicators |
Platforms: | Trading View Indicators |
Trading Skills: | Elementary |
Indicator Types: | Leading Tradingview Indicators Entry & Exit TradingView Indicators |
Timeframe: | Multi-Timeframe Tradingview Indicators |
Trading Style: | Intraday Tradingview Indicators Day Trading Tradingview Indicators Scalper Tradingview Indicators |
Trading Instruments: | TradingView Indicators in the Forex Market Indices Tradingview Indicators Share Stocks Tradingview Indicators |
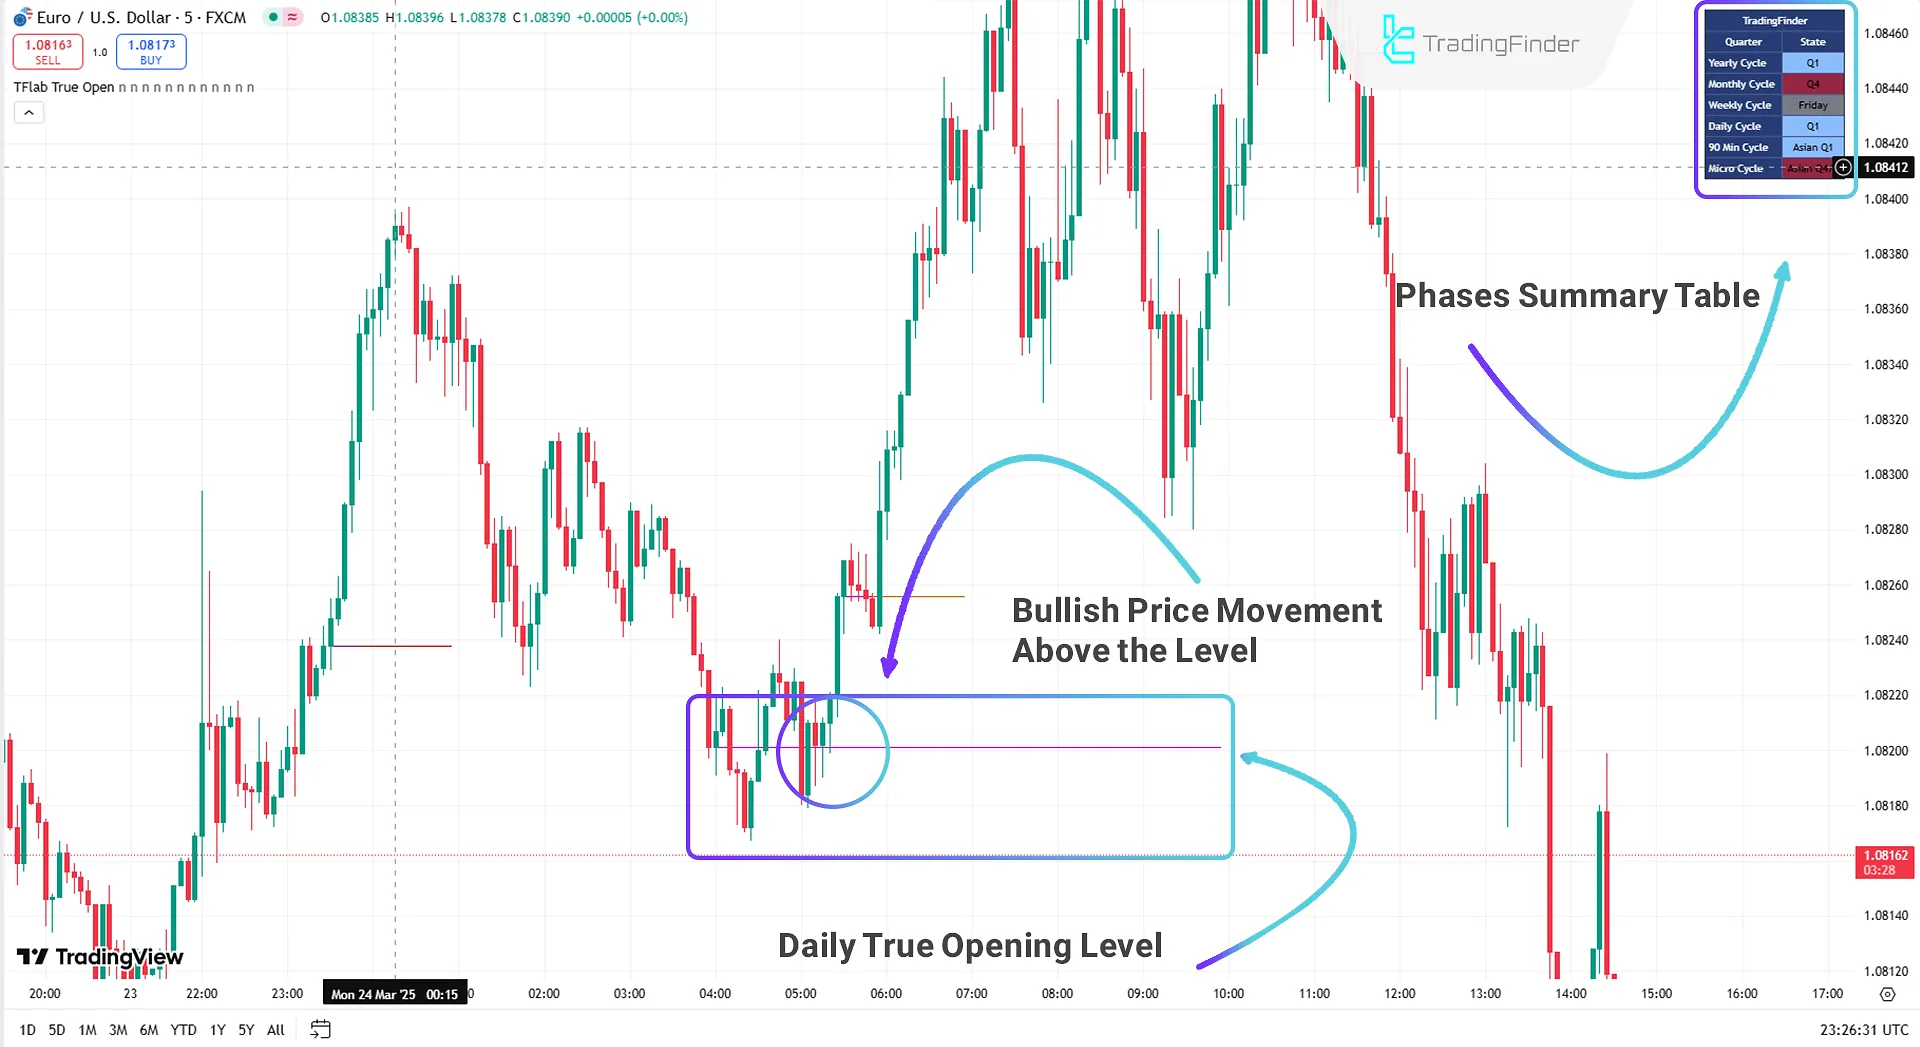
Uptrend
In the 5-minute EUR/USD chart, the Daily True Open level is marked by the Quarterly Theory ICT 02 Indicator. When price sustains above this level, a bullish trend is likely, allowing traders to refine their strategies.
The phase table (top-right of the chart) provides insights into current market conditions, enabling smarter trade decisions. If a favorable setup is confirmed, traders can enter buy positions with higher confidence, improving analytical accuracy.
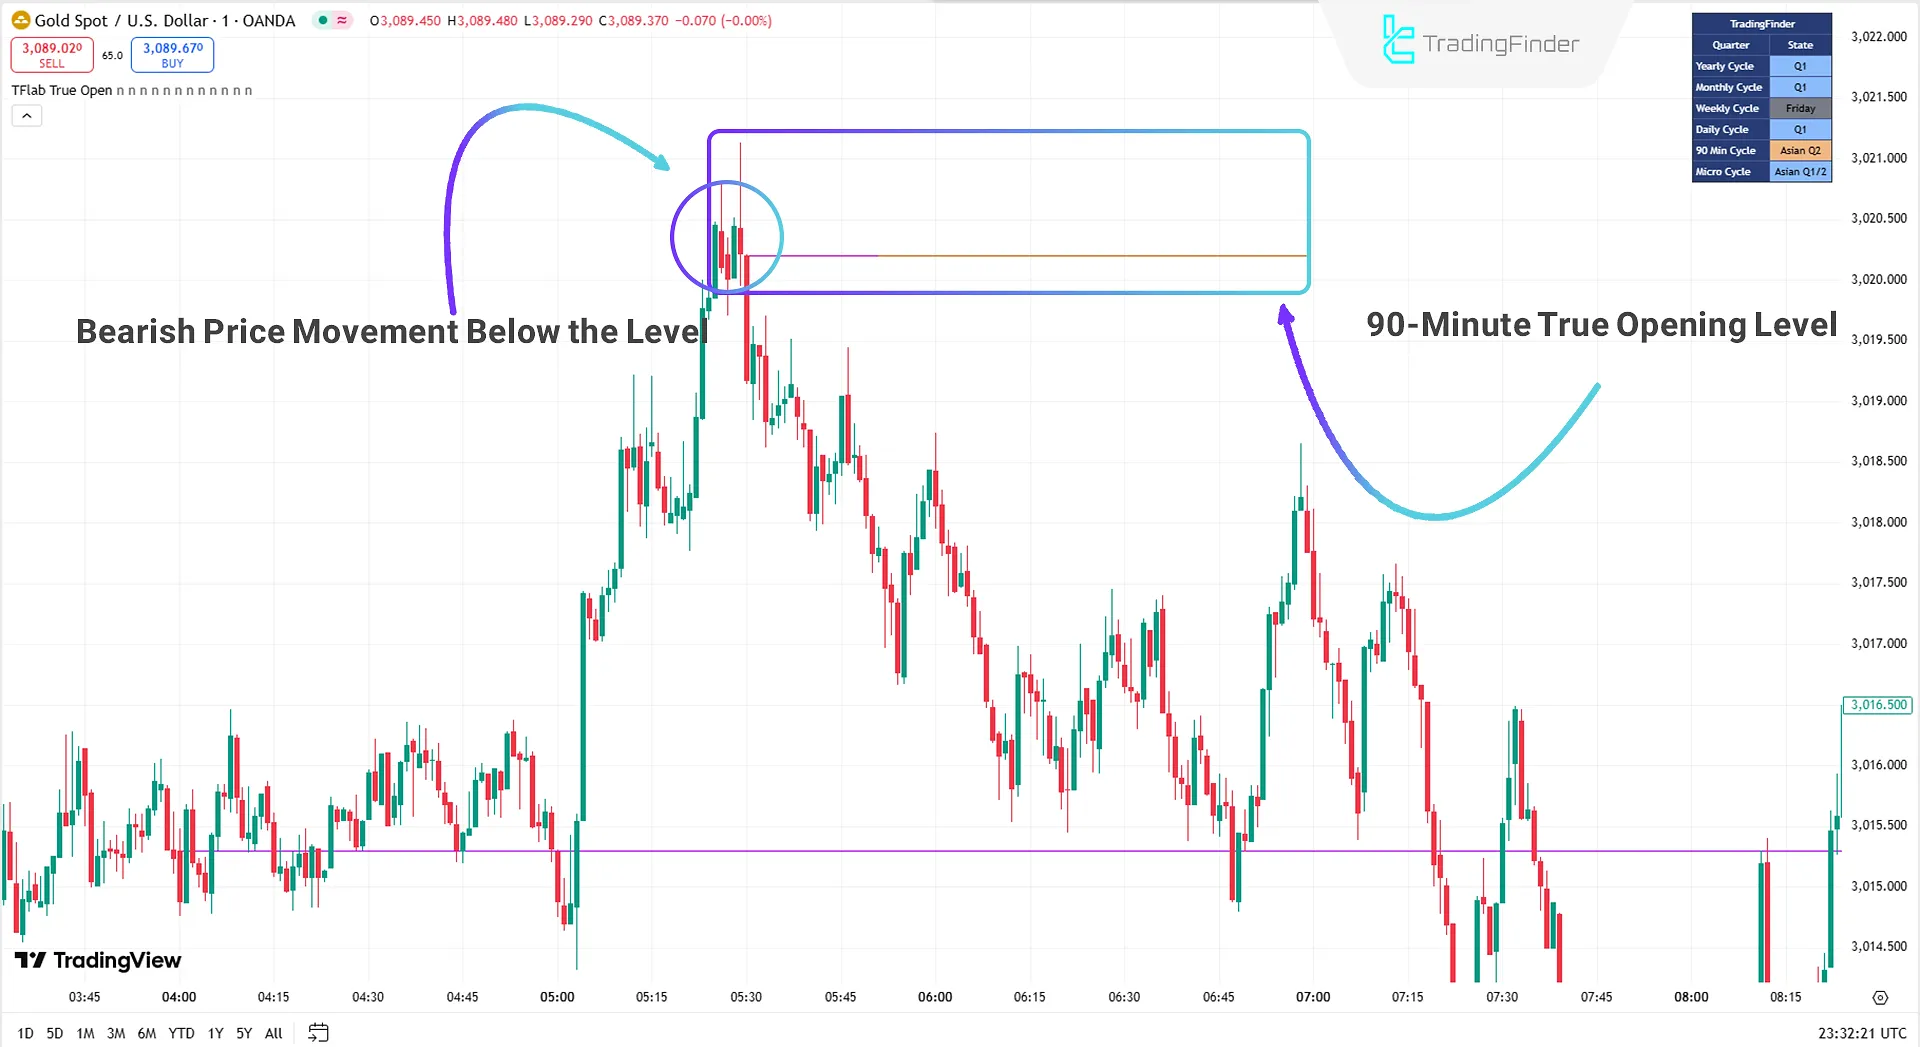
Downtrend
In the 1-minute Gold chart, the indicator identifies the 90-minute True Open level. A price drop below this level suggests a bearish trend, allowing traders to enter sell positions after confirmation.
This strategy helps traders leverage key levels for data-driven decisions.
Quarterly Theory ICT 02 Indicator Settings
Below are the indicator’s customizable settings:
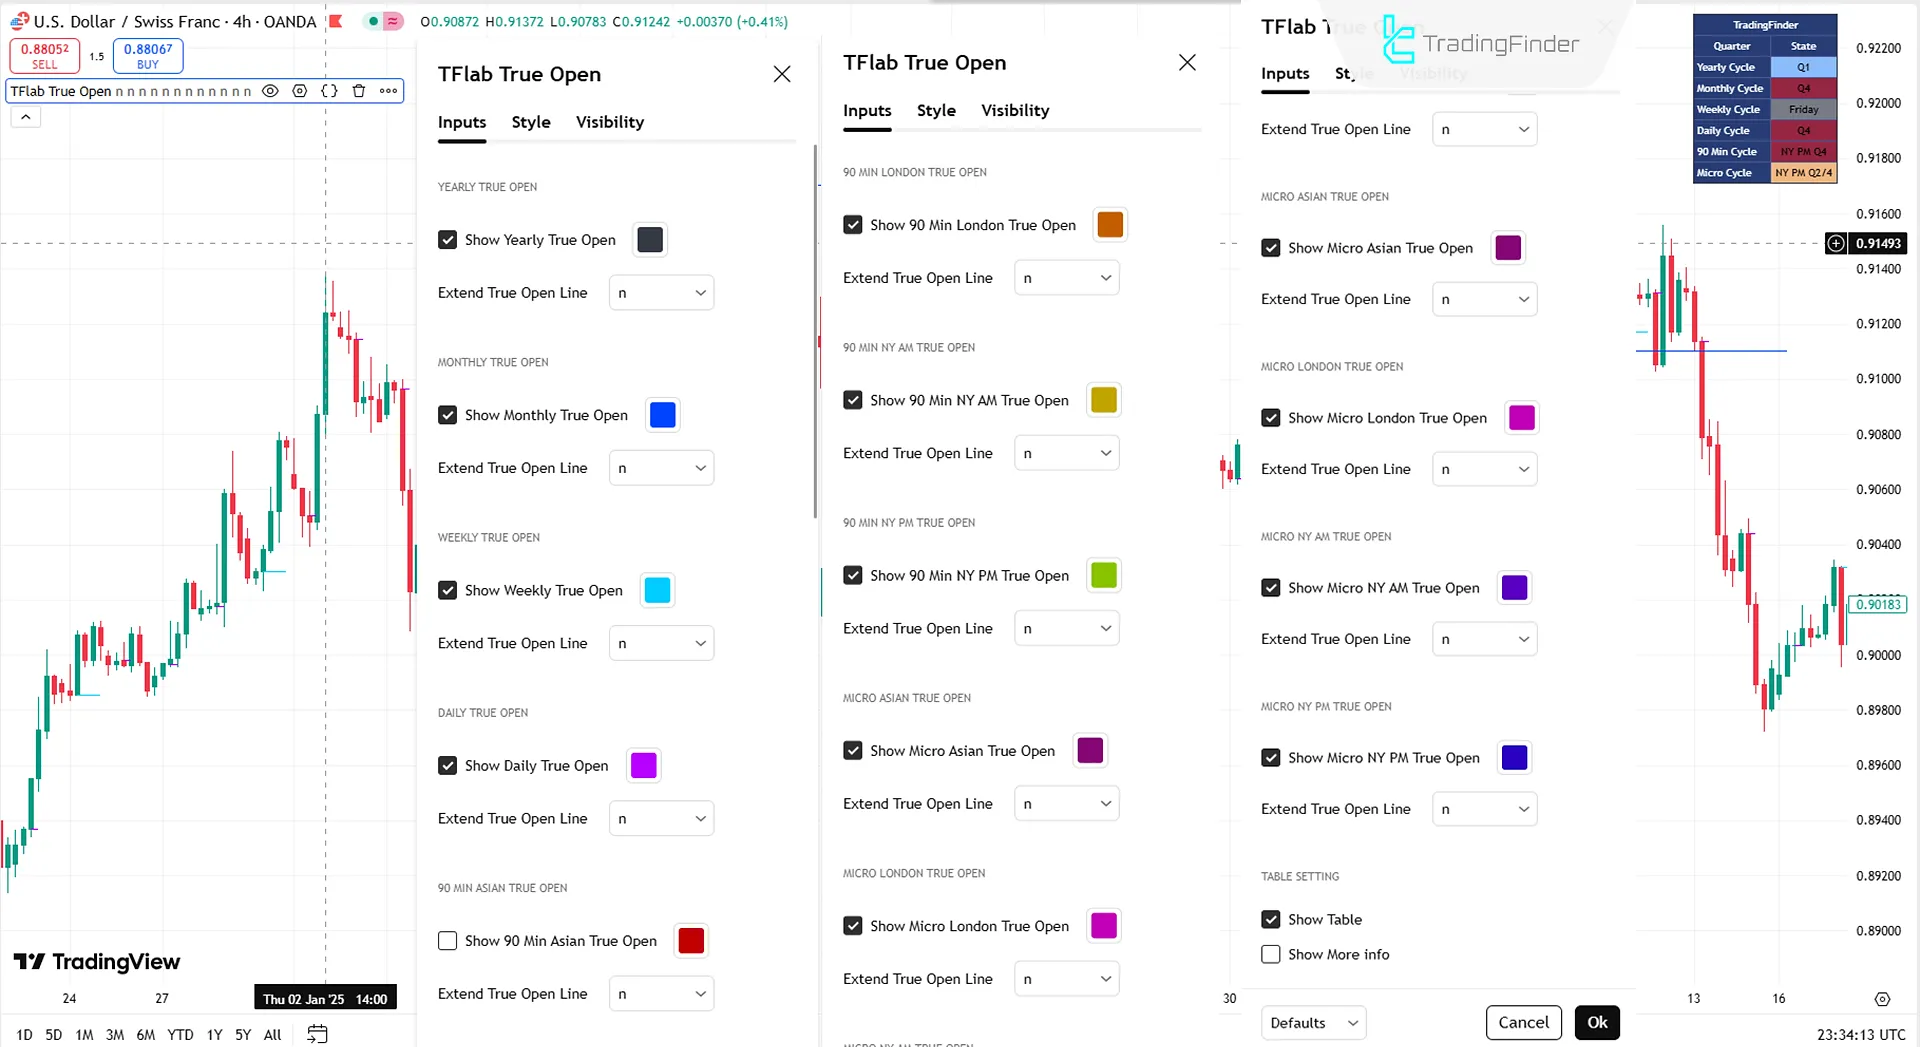
YEARLY TRUE OPEN
- Show Yearly True Open: Toggle visibility of Yearly True Open.
- Extend True Open Line: Extend the line.
MONTHLY TRUE OPEN
- Show Monthly True Open: Toggle visibility of Monthly True Open.
- Extend True Open Line: Extend the line.
WEEKLY TRUE OPEN
- Show Weekly True Open: Toggle visibility of Weekly True Open.
- Extend True Open Line: Extend the line.
DAILY TRUE OPEN
- Show Daily True Open: Toggle visibility of Daily True Open.
- Extend True Open Line: Extend the line.
90 MIN ASIAN TRUE OPEN
- Show 90 Min Asian True Open: Toggle visibility of Asian Session True Open.
- Extend True Open Line: Extend the line.
90 MIN LONDON TRUE OPEN
- Show 90 Min London True Open: Toggle visibility of London Session True Open.
- Extend True Open Line: Extend the line.
90 MIN NY AM TRUE OPEN
- Show 90 Min NY AM True Open: Toggle visibility of NY AM Session True Open.
- Extend True Open Line: Extend the line.
90 MIN NY PM TRUE OPEN
- Show 90 Min NY PM True Open: Toggle visibility of NY PM Session True Open.
- Extend True Open Line: Extend the line.
MICRO ASIAN TRUE OPEN
- Show Micro Asian True Open: Toggle visibility of Micro Asian Session True Open.
- Extend True Open Line: Extend the line.
MICRO LONDON TRUE OPEN
- Show Micro London True Open: Toggle visibility of Micro London Session True Open.
- Extend True Open Line: Extend the line.
MICRO NY AM TRUE OPEN
- Show Micro NY AM True Open: Toggle visibility of Micro NY AM Session True Open.
- Extend True Open Line: Extend the line.
MICRO NY PM TRUE OPEN
- Show Micro NY PM True Open: Toggle visibility of Micro NY PM Session True Open.
- Extend True Open Line: Extend the line.
TABLE SETTINGS
- Show Table: Toggle the phase table.
- Show More Info: Display additional details.
Conclusion
The Quarterly Theory ICT 02 Indicator is a Smart Money TradingView Indicator designed to analyze market structure in the ICT trading style. By focusing on 90-minute sessions and True Open levels, it helps traders understand market trends.
This tool identifies key entry/exit points. When combined with price action analysis, traders can align their strategies with real market dynamics.
Quarterly Theory ICT 02 TradingView PDF
Quarterly Theory ICT 02 TradingView PDF
Click to download Quarterly Theory ICT 02 TradingView PDFWhat is the Quarterly Theory ICT 02 Indicator?
It is a TradingView tool based on Quarterly Theory and 90-minute sessions, used to analyze market structure and identify trade opportunities.
What principles does this indicator follow?
It adheres to the ICT Trading Strategy, utilizing "True Open" and critical price levels to predict market movements.


