


TradingView
MetaTrader4
MetaTrader5
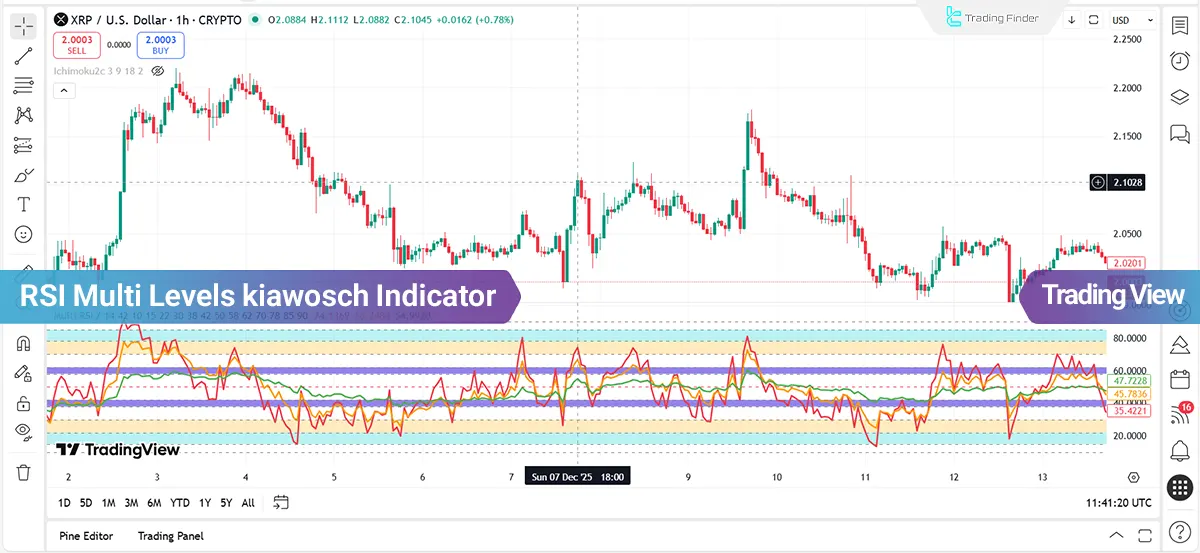
The RSI Multi Levels kiawosch indicator is designed based on the analysis of momentum behavior within predefined zones and utilizes three Relative Strength Index values with periods of 7, 14, and 42.
This multi layered structure enables simultaneous observation of short term, mid term, and long term momentum and shifts analytical focus from raw numerical values to the structural behavior of momentum.
When the RSI with a 7 period records the fastest reaction to price changes, it forms the core of the signal generation process.
Additionally, the RSI with a 14 period and the RSI with a 42 period provide a broader perspective on momentum and define the strength or weakness of price movement across higher time frames.
RSI Multi Levels kiawosch Indicator Specifications Table
The table below presents the features and capabilities of the RSI Multi Levels kiawosch indicator on the TradingView platform:
Indicator Categories: | Supply & Demand Tradingview Indicators Trading Assist Tradingview Indicators |
Platforms: | Trading View Indicators |
Trading Skills: | Intermediate |
Indicator Types: | Reversal Tradingview Indicators Breakout Tradingview Indicators |
Timeframe: | Multi-Timeframe Tradingview Indicators |
Trading Style: | Intraday Tradingview Indicators |
Trading Instruments: | TradingView Indicators in the Forex Market Cryptocurrency Tradingview Indicators Stock Tradingview Indicators Commodity Tradingview Indicators Indices Tradingview Indicators Share Stocks Tradingview Indicators |
RSI Multi Levels kiawosch Indicator at a Glance
This indicator is designed for analysts who focus on momentum, price structure, and market movement phases.
The logic of the tool is based on identifying differences between trending, corrective, and ranging markets, and it interprets signals according to RSI behavior within potential zones.
The main applications of this indicator include the following:
- Trend continuation detection after shallow corrections;
- Identification of momentum deceleration near significant highs and lows;
- Differentiation between trend structures and ranges or channels;
- Evaluation of the quality of reversal moves after deep corrections.
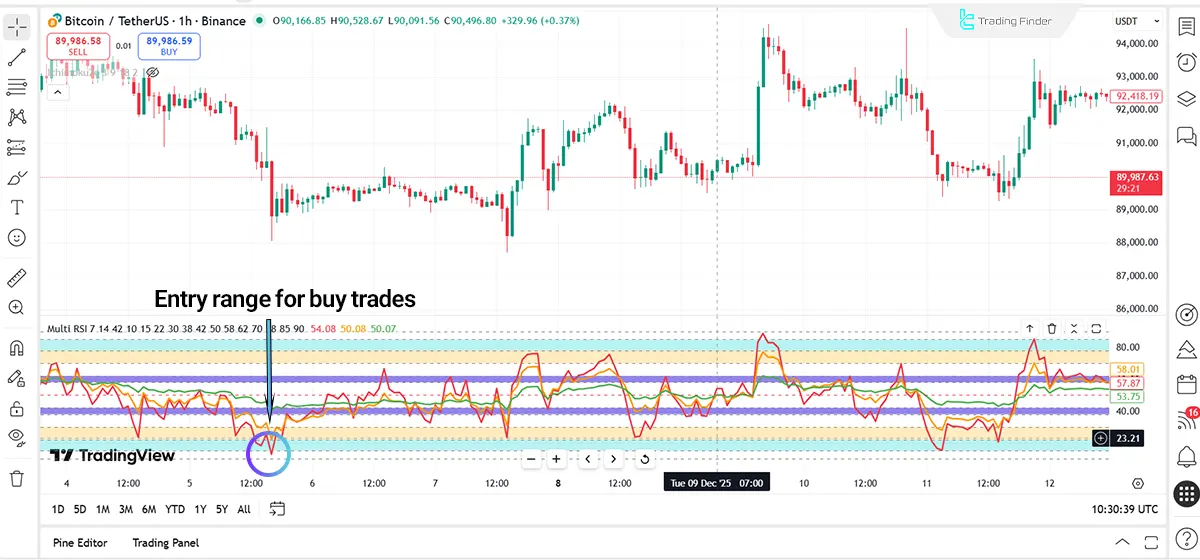
Indicator Performance in an Uptrend
In downtrends, the entry of RSI 7 into the high potential zone in the lower section of the numerical scale, simultaneously with the formation of a new low, indicates dominance of bearish momentum.
Short term corrections under these conditions guide the RSI indicator toward the mid potential zone, and as long as the low structure remains intact, selling pressure continues to prevail.
The exit of RSI 7 from the high potential zone near previous lows reflects weakness in bearish momentum and ultimately results in a slowdown of the decline or a short term corrective phase in the market.
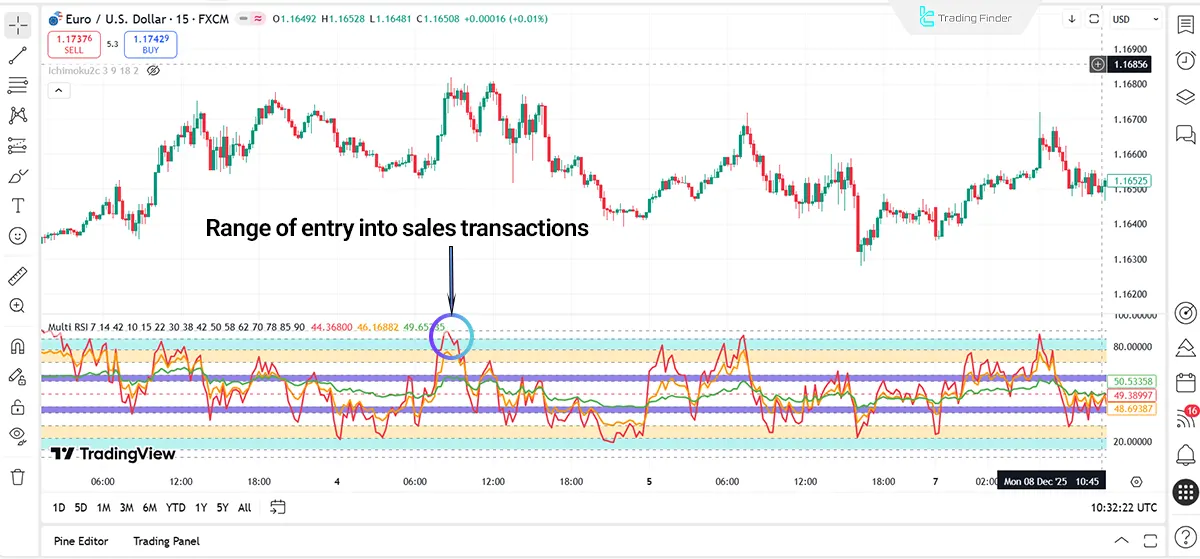
Indicator Performance in a Downtrend
In downtrends, the entry of RSI 7 into the high potential zone in the lower section of the numerical scale, along with the formation of a new low, indicates the dominance of selling momentum.
Short term corrections in this scenario move the RSI toward the mid potential zone, and as long as the low structure is preserved, selling pressure remains persistent; as a result, a suitable zone for entering sell trades is formed.
RSI Multi Levels kiawosch Indicator Settings
The image below displays the detailed settings of the RSI Multi Levels kiawosch indicator:
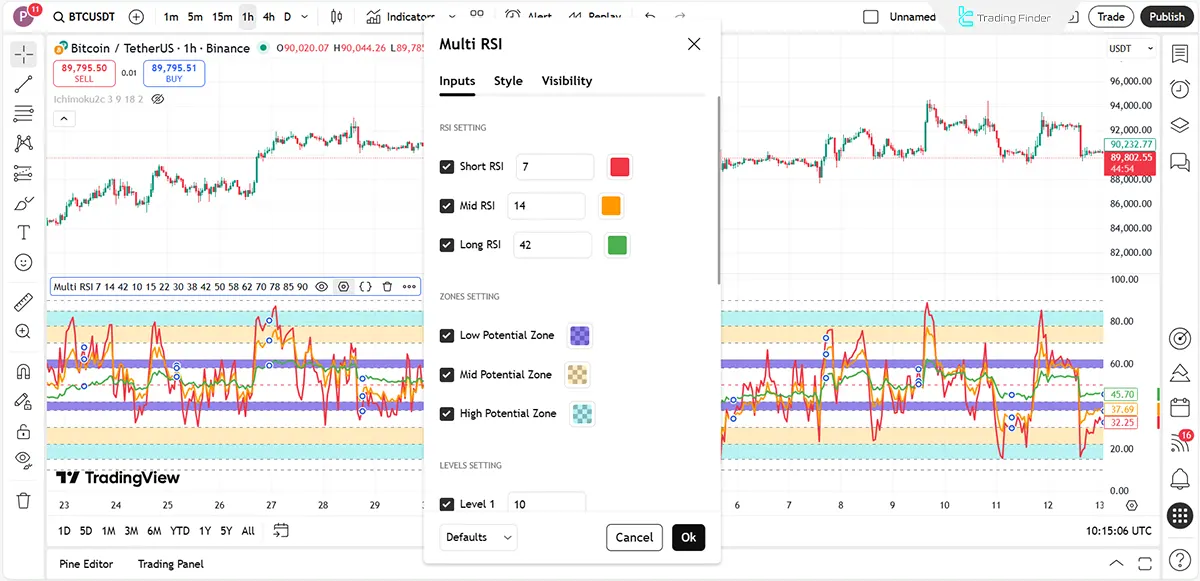
RSI Setting
- Short RSI: Short period Relative Strength Index
- Mid RSI: Mid period Relative Strength Index
- Long RSI: Long period Relative Strength Index
Zones Setting
- Low Potential Zone: Low potential zone
- Mid Potential Zone: Mid potential zone
- High Potential Zone: High potential zone
Levels Setting
- Level 1: Display of the first level
Conclusion
The RSI Multi Levels kiawosch indicator is considered a structurally momentum-oriented tool that focuses on RSI behavior within potential zones.
This approach provides a clearer understanding of the market position within the price movement cycle and delivers a distinct differentiation between trend continuation, correction, and range conditions.
RSI Multi Levels kiawosch Indicator PDF
RSI Multi Levels kiawosch Indicator PDF
Click to download RSI Multi Levels kiawosch Indicator PDFWhat does the RSI Multi Levels kiawosch indicator analyze?
This indicator examines price momentum behavior within defined behavioral zones and focuses on RSI reactions throughout the market movement cycle.
What is the difference between the RSI Multi Levels kiawosch indicator and the classic RSI indicator?
This tool interprets RSI behavior within high, mid, and low potential zones instead of relying on traditional overbought and oversold levels.


