


TradingView
MetaTrader4
MetaTrader5
The Smart Money Concept Indicator is an advanced analytical tool based on the behavior of large financial institutions. It focuses on market structure, liquidity flows, and supply-demand levels.
This indicator visually identifies smart money entry points through colored bars, displaying patterns such as Break of Structure (BoS), Order Blocks (OB), and Liquidity Zones .
Smart Money Concept Indicator Specifications
The general specifications and features of the "Smart Money Concept" indicator are shown in the table below:
Indicator Categories: | ICT Tradingview Indicators Smart Money Tradingview Indicators Liquidity Tradingview Indicators |
Platforms: | Trading View Indicators |
Trading Skills: | Advanced |
Indicator Types: | Breakout Tradingview Indicators |
Timeframe: | Multi-Timeframe Tradingview Indicators |
Trading Style: | Intraday Tradingview Indicators |
Trading Instruments: | TradingView Indicators in the Forex Market Cryptocurrency Tradingview Indicators Stock Tradingview Indicators Commodity Tradingview Indicators Indices Tradingview Indicators Forward Tradingview Indicators Share Stocks Tradingview Indicators |
Bullish Trend
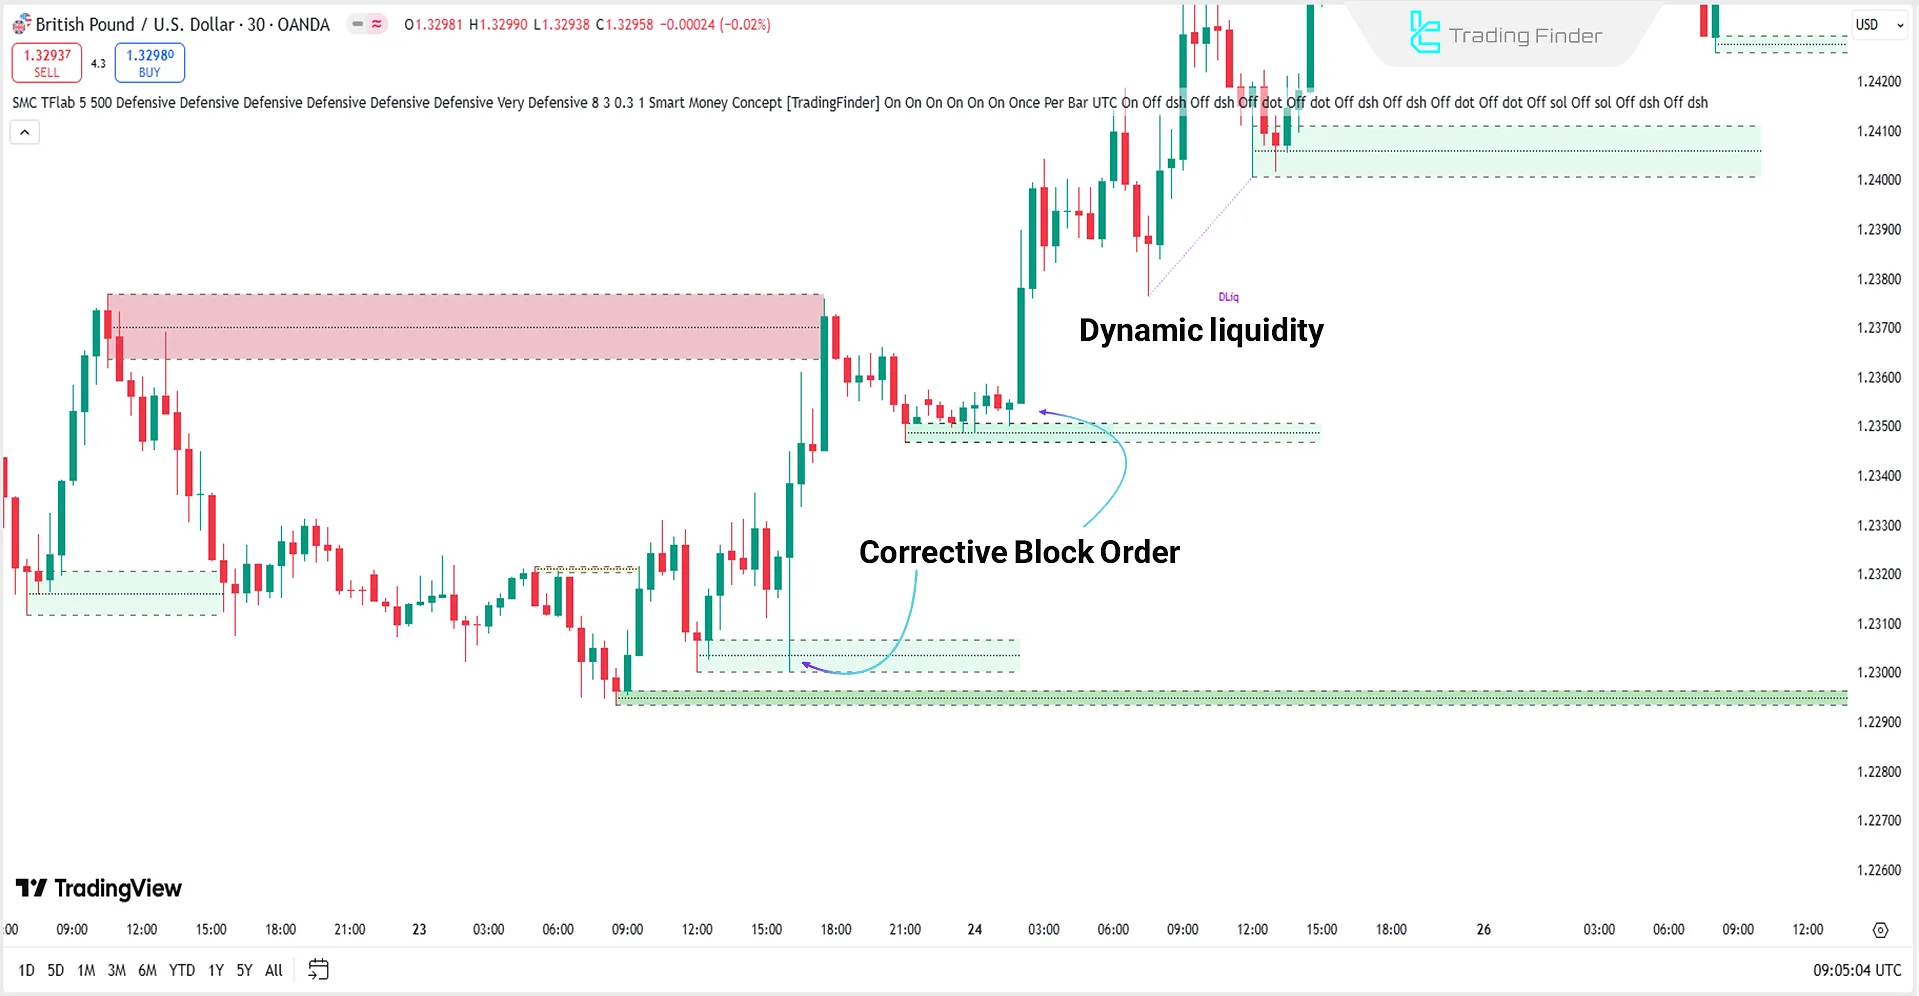
The chart below displays the GBP/USD currency pair in a 30-minute timeframe.
A buy signal in the Smart Money Concept Indicator (SMC) is issued when the market structure transitions into an uptrend, and a Change of Character (CHOCH) pattern forms in the bullish direction.
The Break of Structure(BoS) confirms this trend change, and the price reacts to the demand order block.
This combination and the Fair Value Gap (FVG) filling signals smart money entry, providing an ideal point for entering a buy trade.
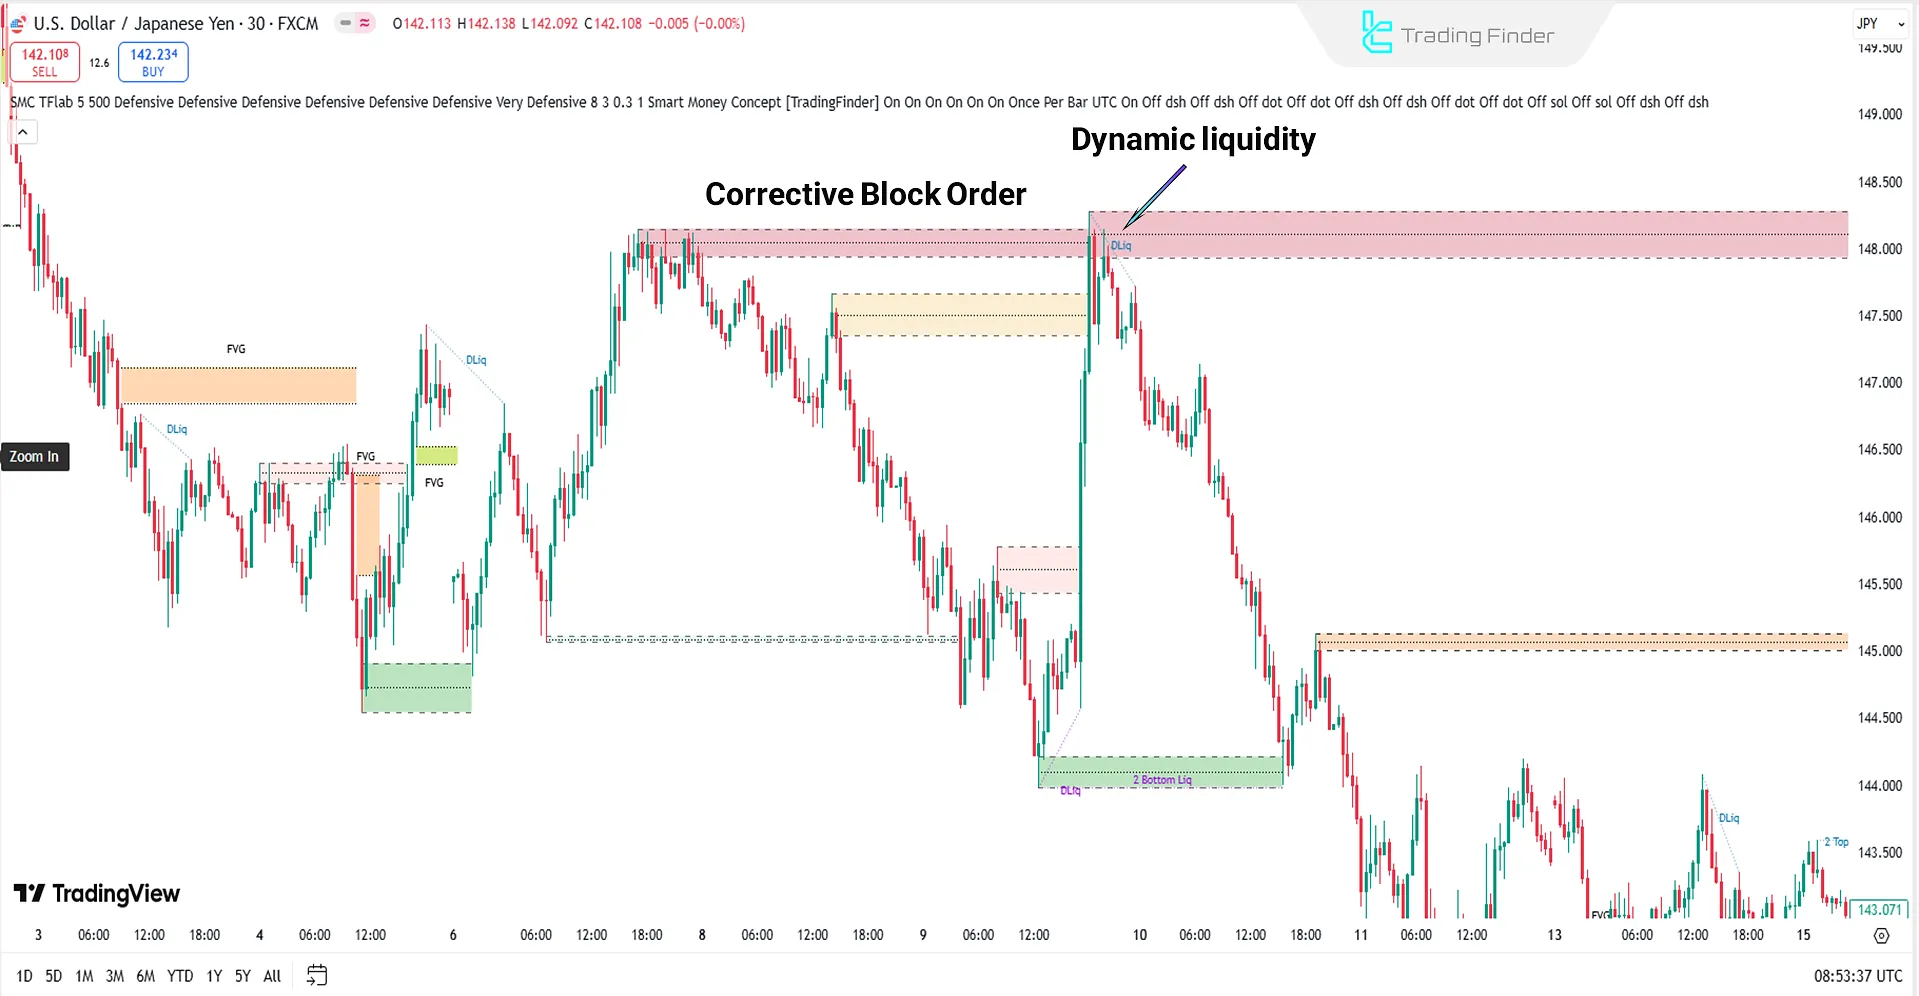
Bearish Trend
In the 30-minute chart of USD/JPY, after an uptrend, the appearance of bearish structure change signals along with a Break of Structure (BoS) confirm a trend reversal.
In this situation, the price enters the Order Block or Premium Zone, increasing the likelihood of a price reaction.
Simultaneously, the presence of a descending FVG near the selling liquidity zones significantly strengthens the validity of the sell signal.
Indicator Settings
The image below shows the settings of the Smart Money Concept indicator:
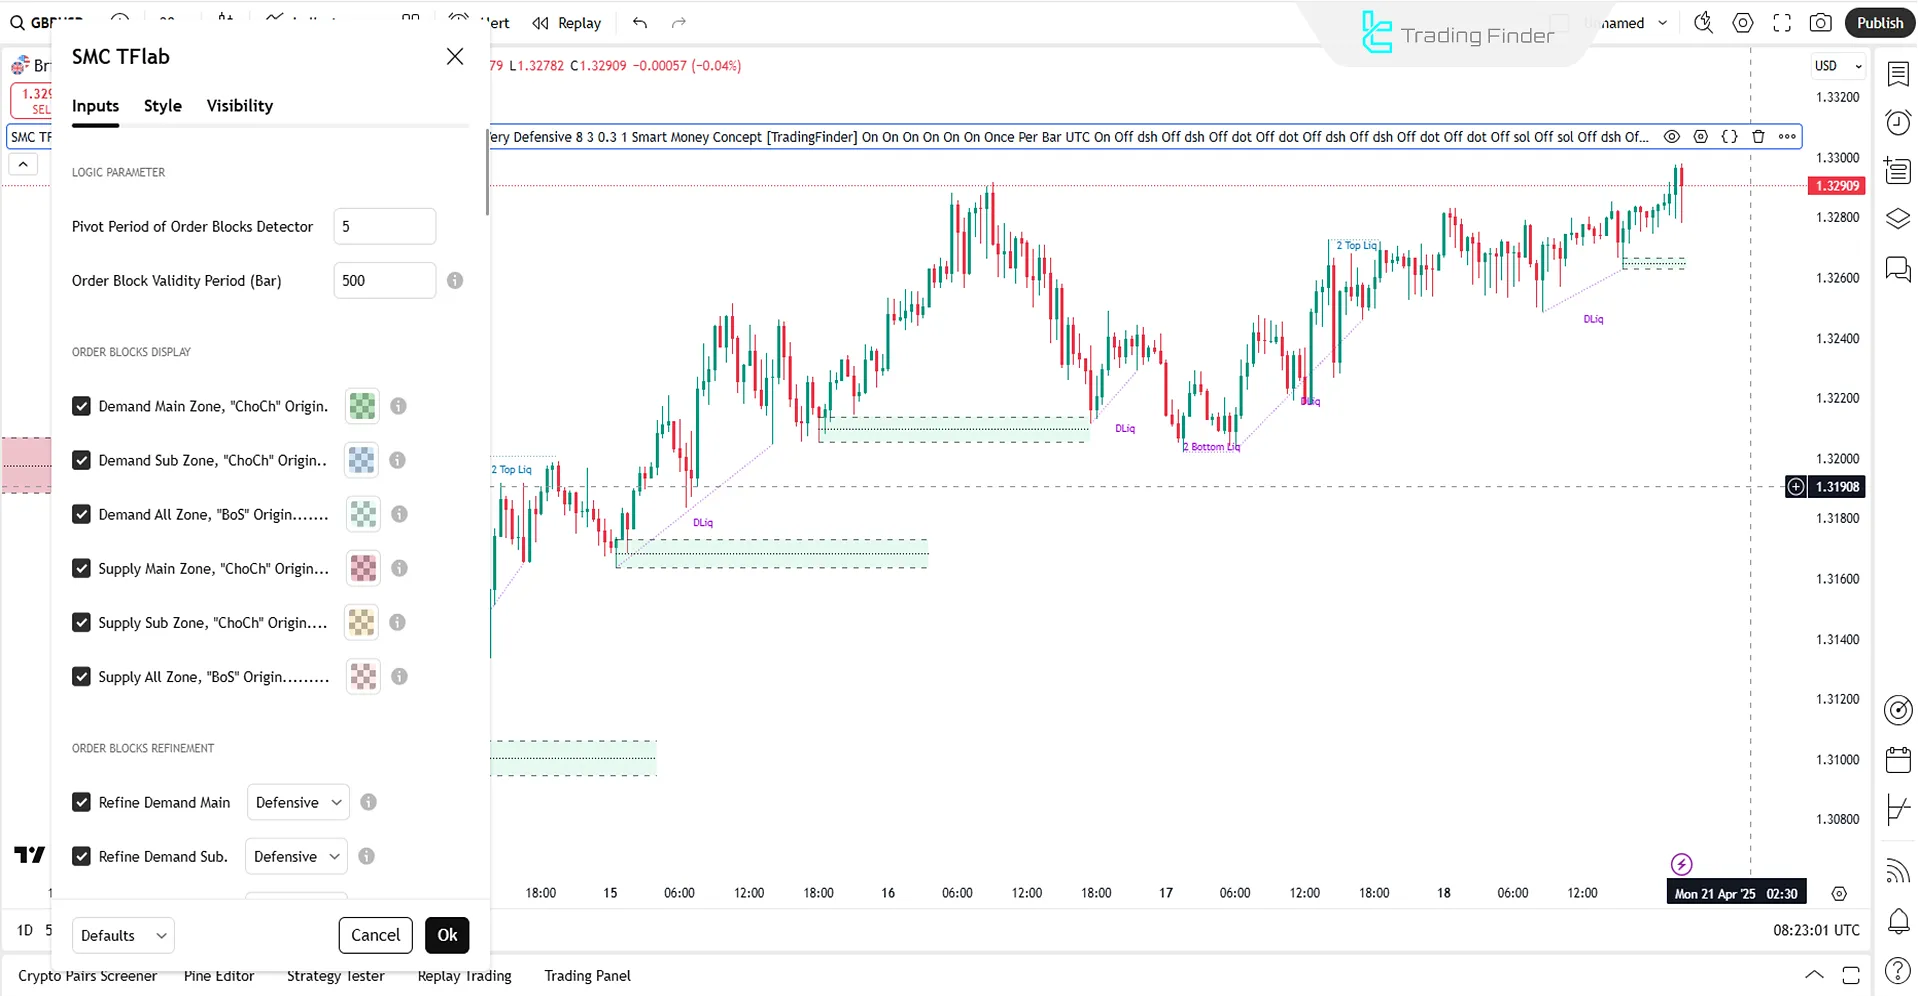
Logic Parameters
- Pivot Period of Order Blocks Detector: Pivot period for detecting order blocks;
- Order Block Validity Period (Bar): Validity period for order blocks (number of candles).
Order Blocks Display
- Demand Main Zone "CHOCH" Origin: Display the central demand zone originating from trend change;
- Demand Sub Zone "CHOCH" Origin: Display sub-demand zone originating from trend change;
- Demand All Zone "BoS" Origin: Display all demand zones originating from structure break;
- Supply Main Zone "CHOCH" Origin: Display the central supply zone originating from trend change;
- Supply Sub Zone, "CHOCH" Origin: Display sub-supply zone originating from trend change;
- Supply All Zone, "BoS" Origin: Display all supply zones originating from structure break.
Order Blocks Refinement
- Refine Demand Main: Refine main demand block;
- Refine Demand Sub: Refine sub-demand zone;
- Refine Demand BoS: Refine demand block originating from BoS;
- Refine Supply Main: Refine main supply block;
- Refine Supply Sub: Refine sub-supply zone;
- Refine Supply BoS: Refine supply block originating from BoS.
FVG (Fair Value Gap)
- Show Demand FVG: Display demand FVG;
- Show Supply FVG: Display supply FVG;
- FVG Filter: Display fair value gap filter.
Liquidity
- Show Statics High Liquidity Line: Display static high liquidity lines;
- Show Statics Low Liquidity Line: Display static low liquidity lines;
- Show Dynamics High Liquidity Line: Display dynamic high liquidity lines;
- Show Dynamics Low Liquidity Line: Display dynamic low liquidity lines;
- Statics Period Pivot: Pivot period for static liquidity;
- Dynamics Period Pivot: Pivot period for dynamic liquidity;
- Statics Liquidity Line Sensitivity: Sensitivity of static liquidity lines.
Conclusion
The Smart Money Concept Indicator is a specialized tool for the smart money style. It focuses on market structure, order blocks, and liquidity zones to identify potential entry and exit points.
Smart Money Concept TradingView PDF
Smart Money Concept TradingView PDF
Click to download Smart Money Concept TradingView PDFWhat basis does the SMC indicator use to issue signals
This trading tool issues buy and sell signals based on market structure analysis, price breaks, and intelligent money behavior.
Is this indicator only applicable in the forex market?
The Smart Money Concept indicator is relevant across all financial markets, including cryptocurrency, stocks, commodities, and forex.


