


TradingView
MetaTrader4
MetaTrader5
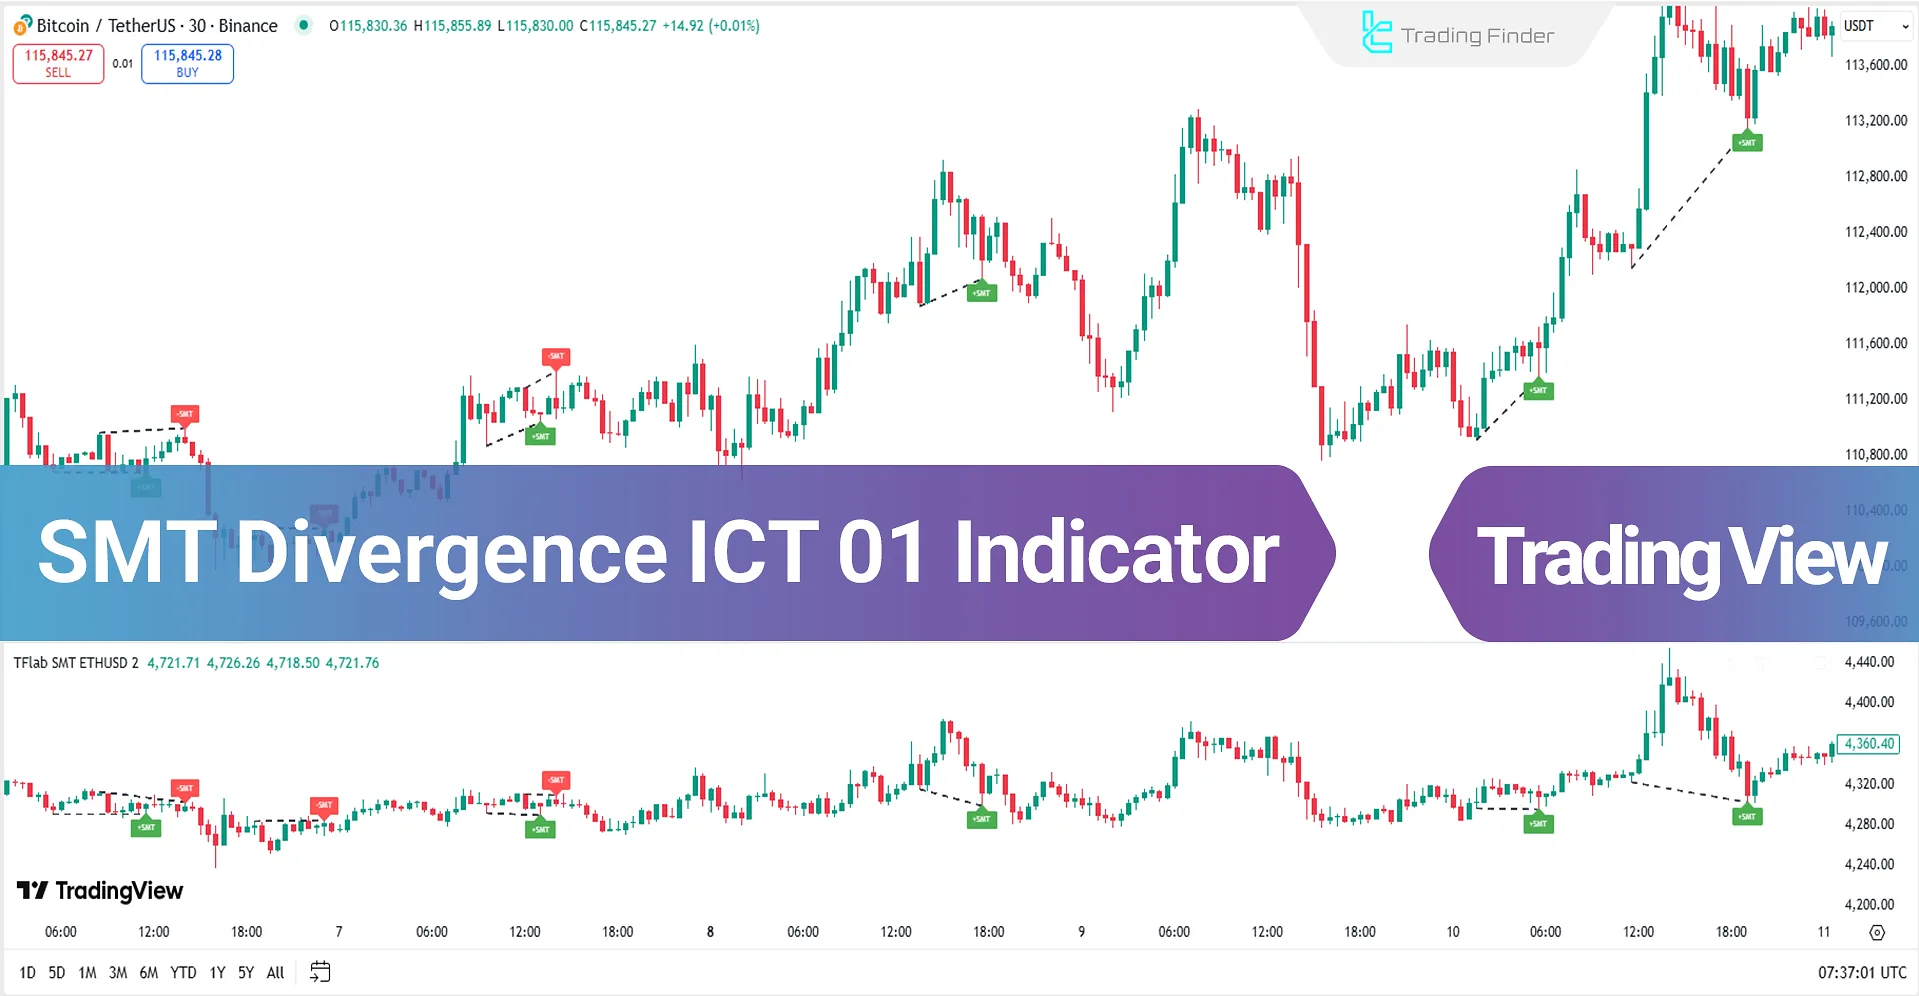
The SMT Divergence ICT 01 Indicator is a specialized tool within the ICT style, designed to detect imbalances and movement discrepancies between two correlated assets.
This indicator highlights the moments when smart money flows in or out of the primary asset while the corresponding correlated asset does not yet reflect the same movement.
By leveraging behavioral differences, this trading tool identifies sensitive price zones and provides sharper insight into potential trend reversal points.
By leveraging behavioral differences, this trading tool identifies sensitive price zones and provides sharper insight into potential trend reversal points.
SMT Divergence ICT 01 Specifications Table
The table below presents the features and capabilities of the SMT Divergence ICT 01 tool:
Indicator Categories: | ICT Tradingview Indicators Smart Money Tradingview Indicators Liquidity Tradingview Indicators |
Platforms: | Trading View Indicators |
Trading Skills: | Advanced |
Indicator Types: | Reversal Tradingview Indicators Breakout Tradingview Indicators |
Timeframe: | Multi-Timeframe Tradingview Indicators |
Trading Style: | Intraday Tradingview Indicators |
Trading Instruments: | TradingView Indicators in the Forex Market Cryptocurrency Tradingview Indicators Stock Tradingview Indicators Commodity Tradingview Indicators Indices Tradingview Indicators Share Stocks Tradingview Indicators |
SMT Divergence ICT 01 at a Glance
The SMT Divergence ICT 01 Indicator is displayed as an analytical layer on the chart, visually marking divergence points. Its graphical features are as follows:
- Diagonal dotted lines: These connect two key points (highs or lows) and illustrate the divergence structure;
- +SMT Label (Green): Appears for bullish divergence near lows, indicating a potential upward reversal;
- –SMT Label (Red): Placed for bearish divergence near highs, signaling a possible downward reversal;
- Simultaneous comparison of two charts: A secondary chart window displays the correlated asset and plots divergence lines between the highs or lows of both charts;
- Clear separation of correlated assets: Thanks to visual presentation and clear labeling, traders can easily spot behavioral differences between the two assets and identify sensitive entry and exit points.
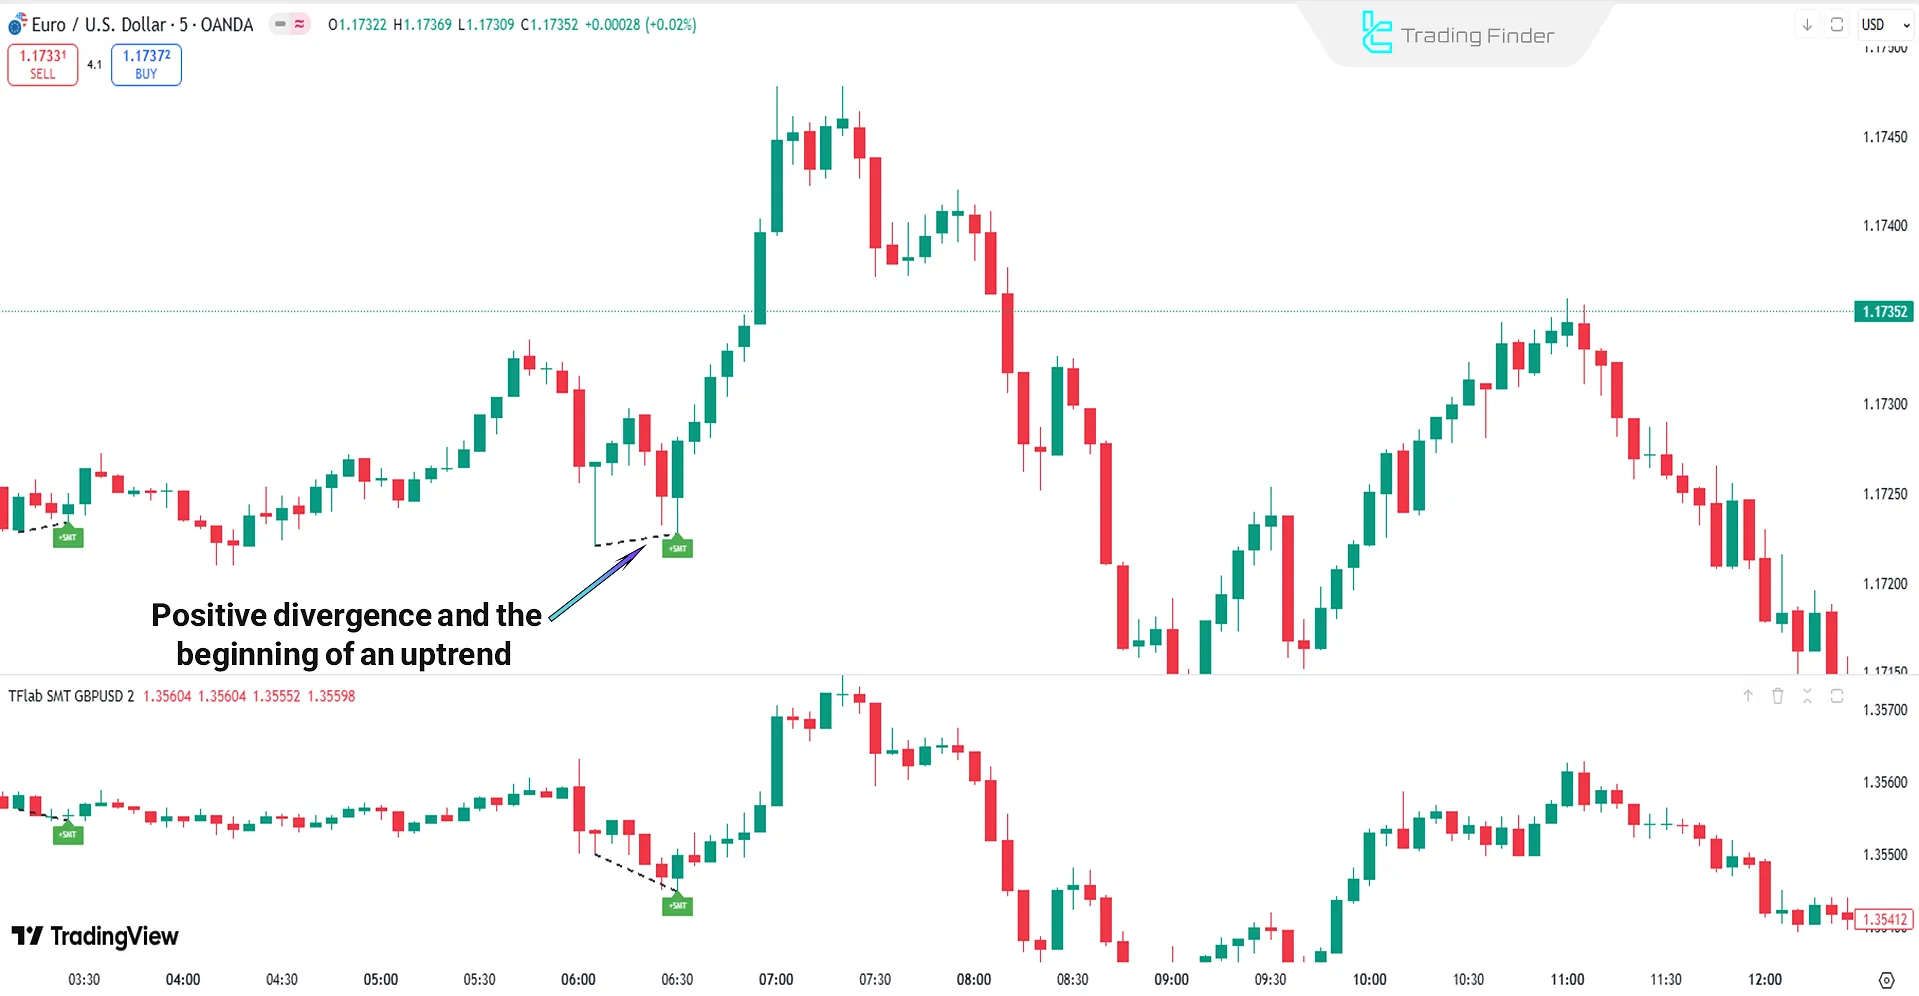
Indicator Performance in an Uptrend
In the chart, bullish divergence is marked with the green +SMT label. This situation occurs when:
- In the primary chart, a higher low is formed
- In the correlated chart (below), a lower low is formed
This behavioral discrepancy indicates reduced selling pressure and the beginning of new demand inflow.
The result of such divergence often leads to a price reversal to the upside or the start of a bullish correction.
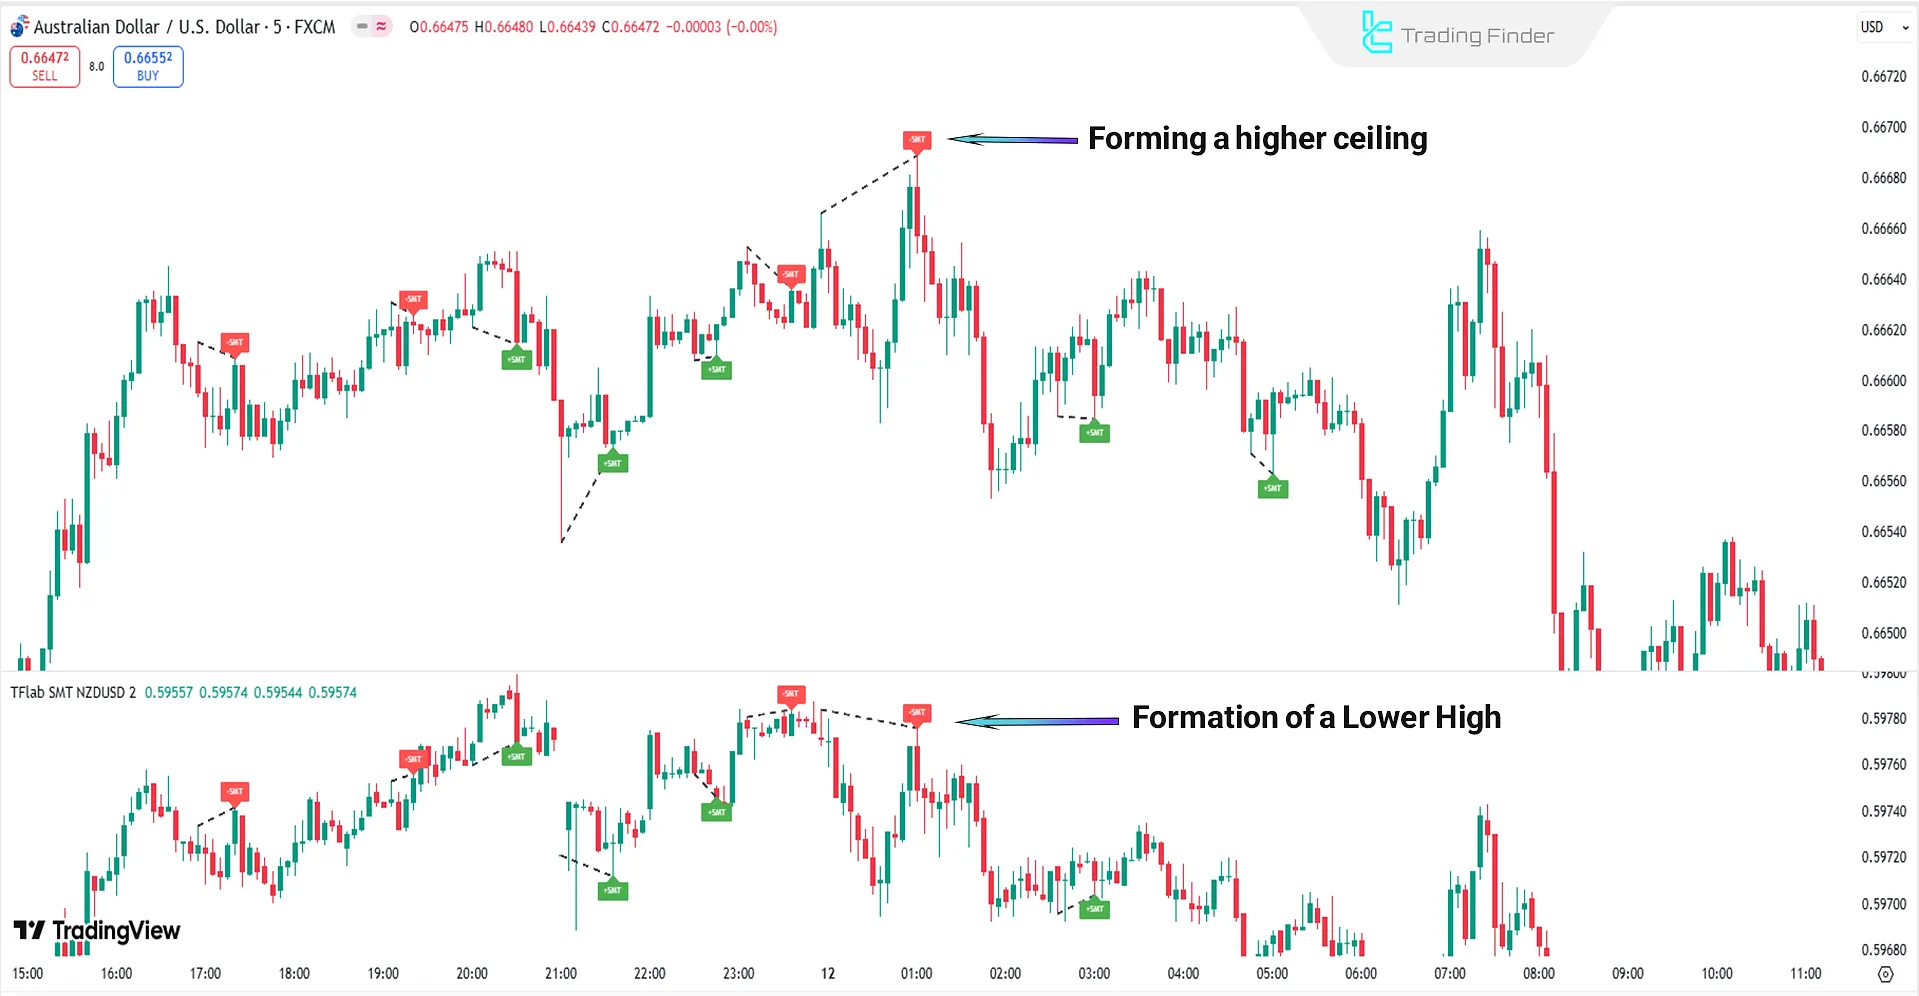
Indicator Performance in a Downtrend
Bearish divergence occurs when the primary chart records a new high, but the correlated asset fails to confirm this move, instead stalling at the same level or lower.
This inconsistency reflects a decrease in demand and strengthening bearish momentum; therefore, it provides an appropriate zone for entering short trades.
Settings of SMT Divergence ICT 01 Indicator
The image below displays the configuration details of the SMT Divergence ICT 01 Indicator:
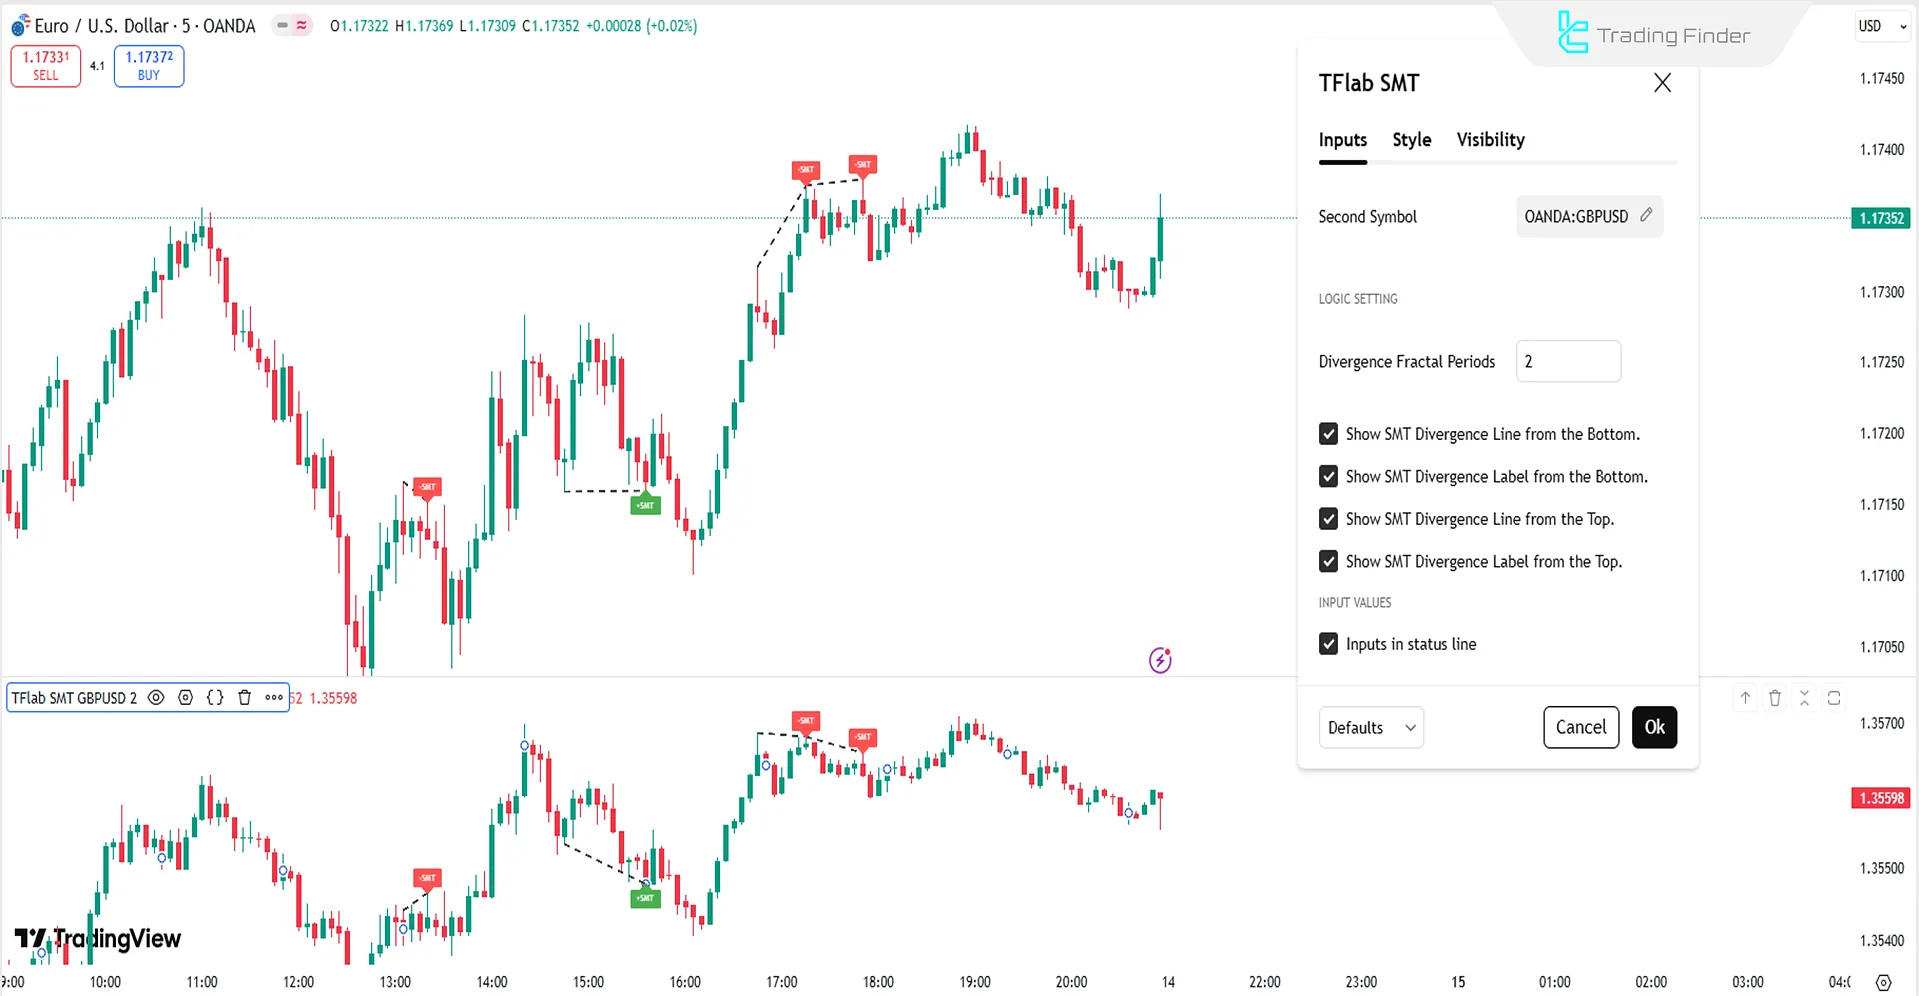
- Second Symbol: Selection of the correlated asset
Logical settings
- Divergence Fractal Periods: Display divergence fractal periods
- Show SMT Divergence Line from the Bottom: Display SMT divergence line from lows
- Show SMT Divergence Label from the Bottom: Display SMT label from lows
- Show SMT Divergence Line from the Top: Display SMT divergence line from highs
- Show SMT Divergence Label from the Top: Display SMT label from highs
Conclusion
The SMT Divergence ICT 01 Indicator serves as an advanced analytical tool, comparing the highs and lows of two correlated assets to identify potential trend-reversal zones and smart money entry points.
It filters out false breakouts and more accurately defines trade entry and exit conditions.
SMT Divergence ICT 01 Indicator on TradingView PDF
SMT Divergence ICT 01 Indicator on TradingView PDF
Click to download SMT Divergence ICT 01 Indicator on TradingView PDFIn which markets can the SMT Divergence ICT 01 Indicator be applied?
This trading tool can be utilized in all markets where correlated assets are present.
What is the purpose of the SMT Divergence ICT 01 Indicator?
This indicator identifies both positive and negative divergences by comparing the highs and lows of two correlated assets, and visually represents potential trend-reversal points on the chart through lines and labels (+SMT and –SMT).


