


TradingView
MetaTrader4
MetaTrader5
The SMT Divergence ICT 02 Indicator displays divergences between two or more correlated trading symbols. This TradingViewliquidityindicator is designed based on ICT strategy and Smart Money trading concepts.
This tool identifies points at which price action diverges from the Market Structure.
This divergence can be an early sign of a trend reversal or a confirmation of the main market direction.
SMT Divergence Setup 02 Indicator Specifications
The table below outlines the features of the SMT Divergence Setup 02 Indicator:
Indicator Categories: | ICT Tradingview Indicators Smart Money Tradingview Indicators Signal & Forecast Tradingview Indicators |
Platforms: | Trading View Indicators |
Trading Skills: | Intermediate |
Indicator Types: | Reversal Tradingview Indicators |
Timeframe: | Multi-Timeframe Tradingview Indicators |
Trading Style: | Intraday Tradingview Indicators |
Trading Instruments: | TradingView Indicators in the Forex Market Cryptocurrency Tradingview Indicators Stock Tradingview Indicators |
Smart Money Setup 02 Indicator at a Glance
The Smart Money Setup 02 Indicator highlights order block (OB) zones using colored boxes. Green boxes represent demand order blocks, and red boxes indicate supply order blocks.
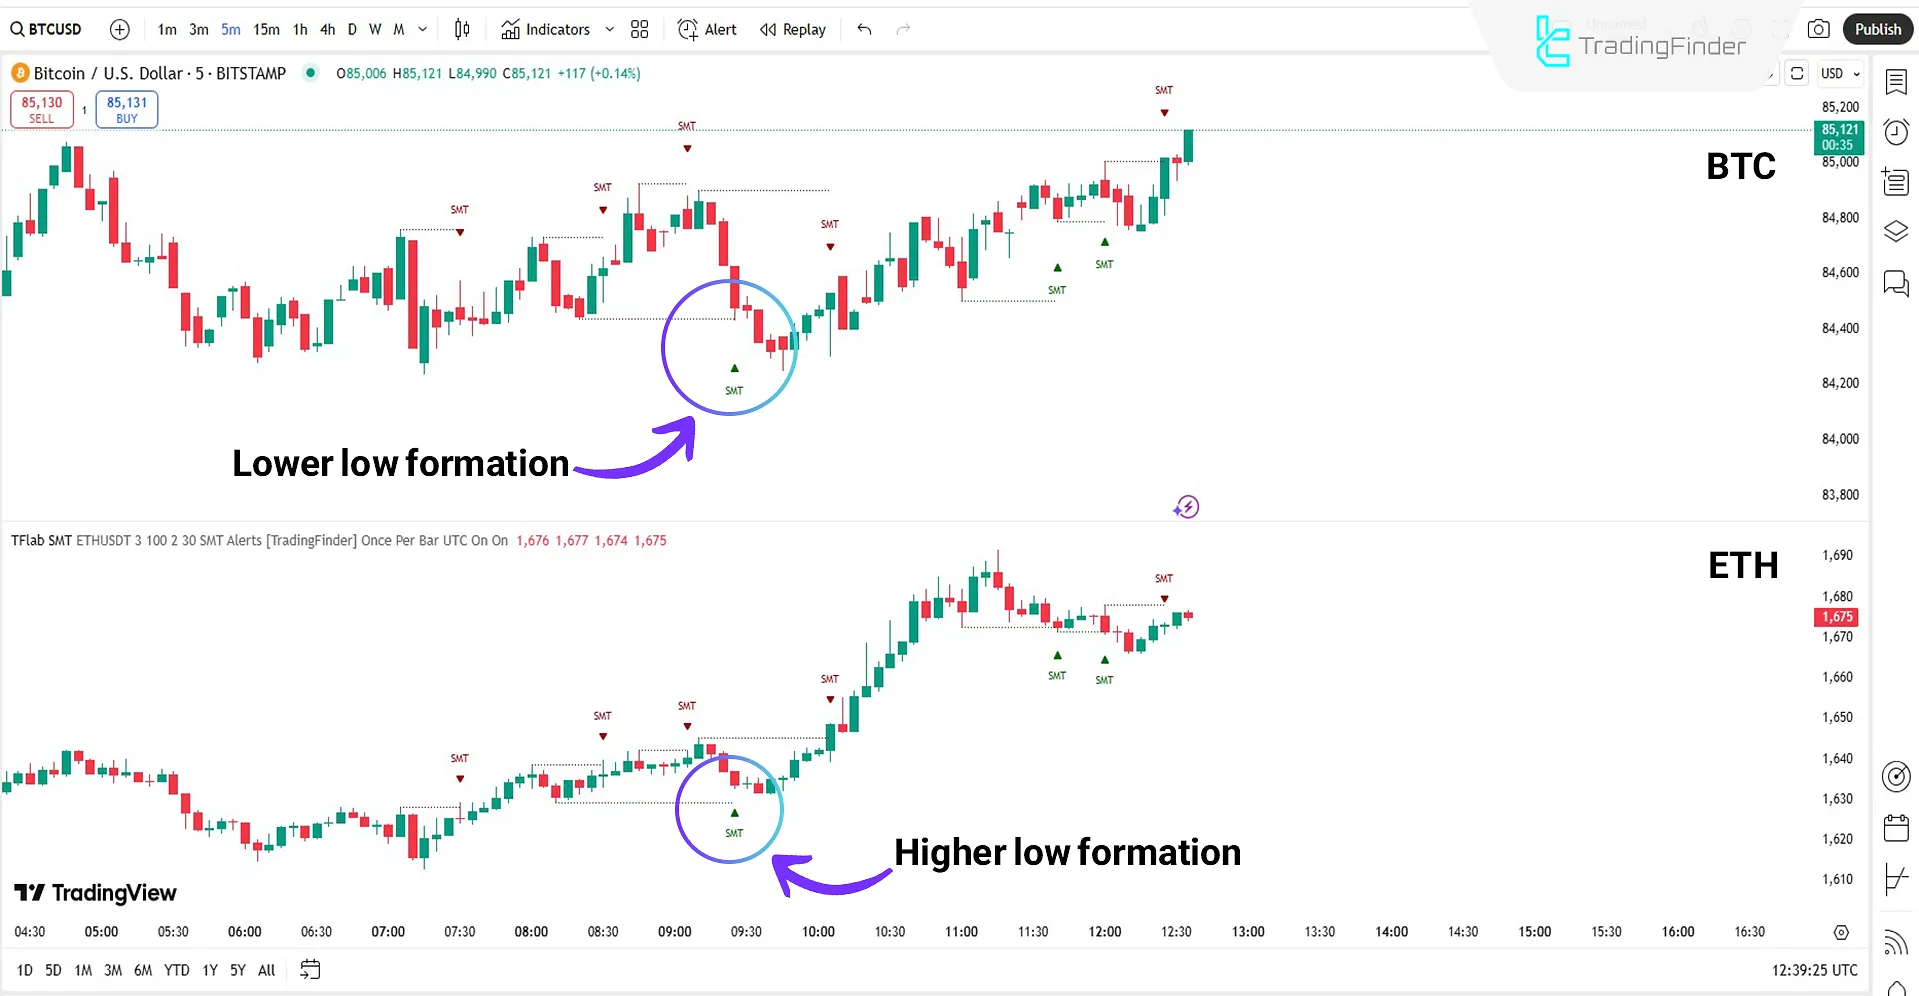
Bullish Divergence
Based on an analysis ofthe Bitcoin (BTC) and Ethereum (ETH) charts over a 5-minute timeframe, Bitcoin forms a lower low and breaks the green line.
In contrast, Ethereum creates a higher low, and the indicator detects the divergence and marks it with an arrow.
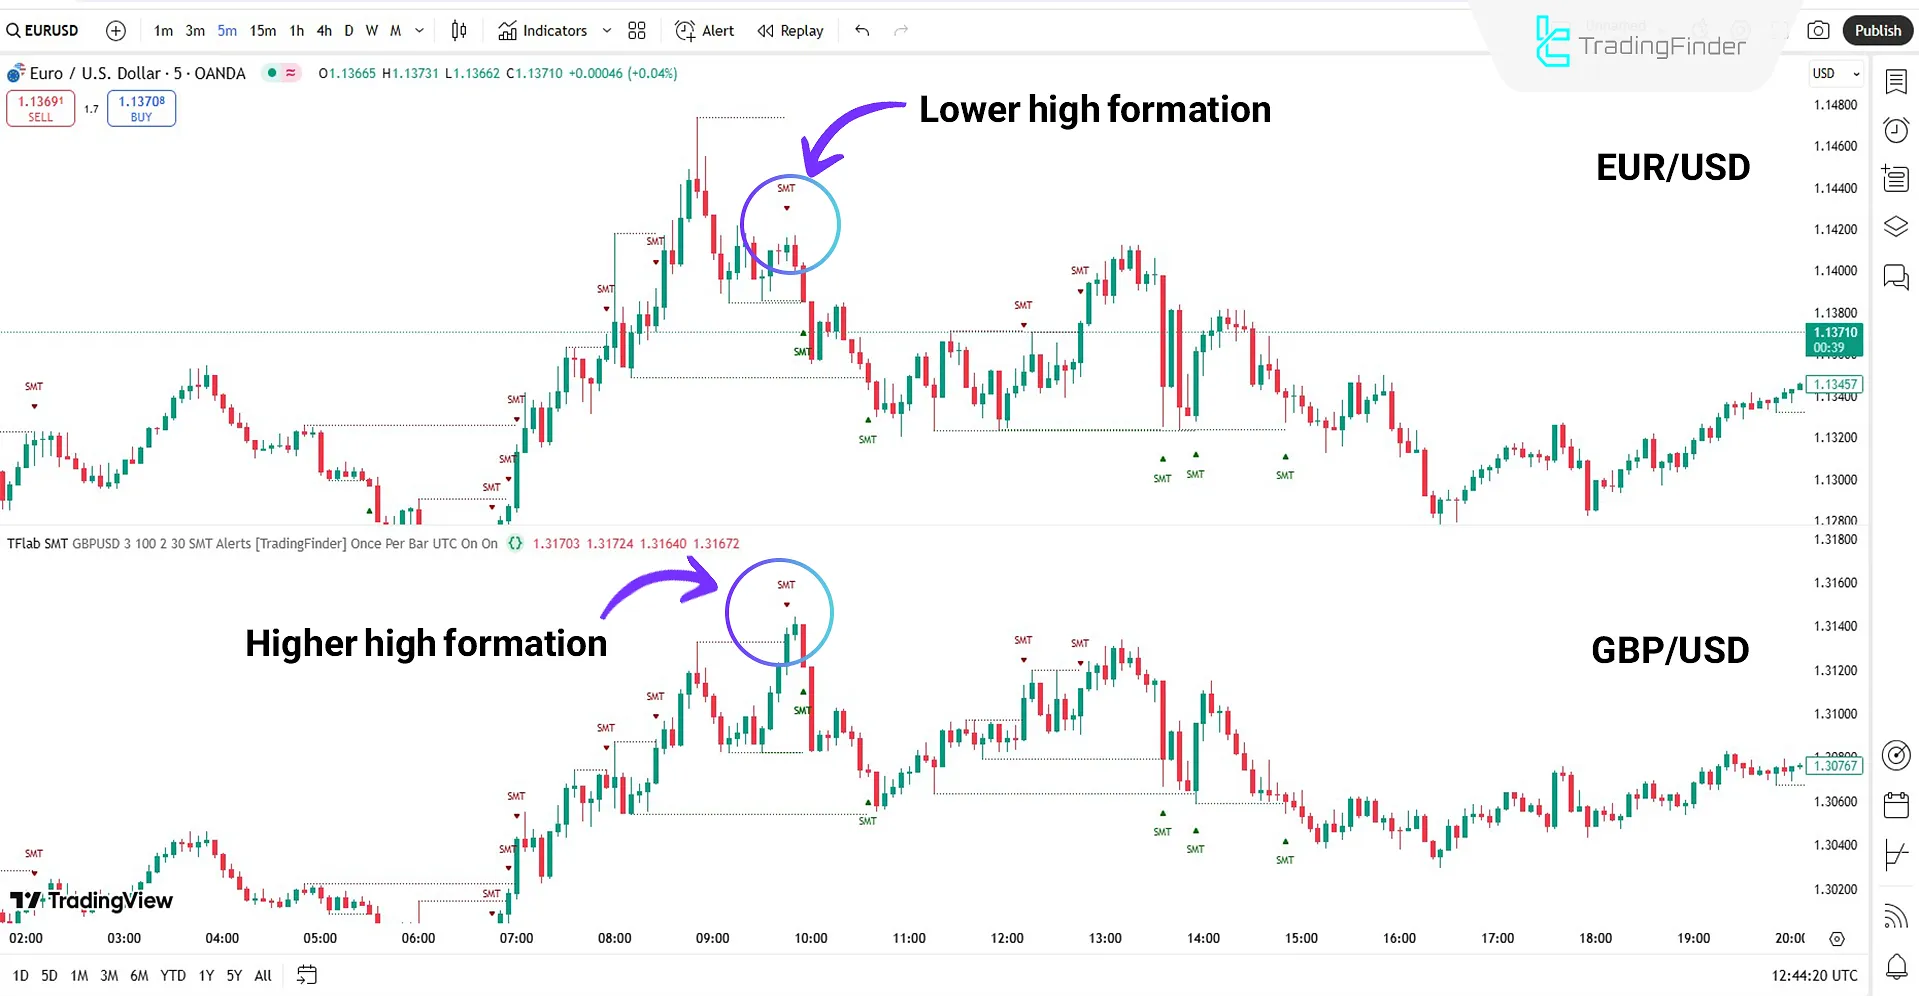
Bearish Divergence
According to the chart analysis, the GBP/USD pair forms a higher high, breaking above the red line. Meanwhile, the EUR/USD pair, at the same moment, forms a lower high.
After identifying the divergence between these correlated pairs, the indicator issues a bearishdivergence signal with a red arrow.
SMT Divergence ICT 02 Indicator Settings
The image below shows the settings panel for the SMT Divergence Setup 02 Indicator:
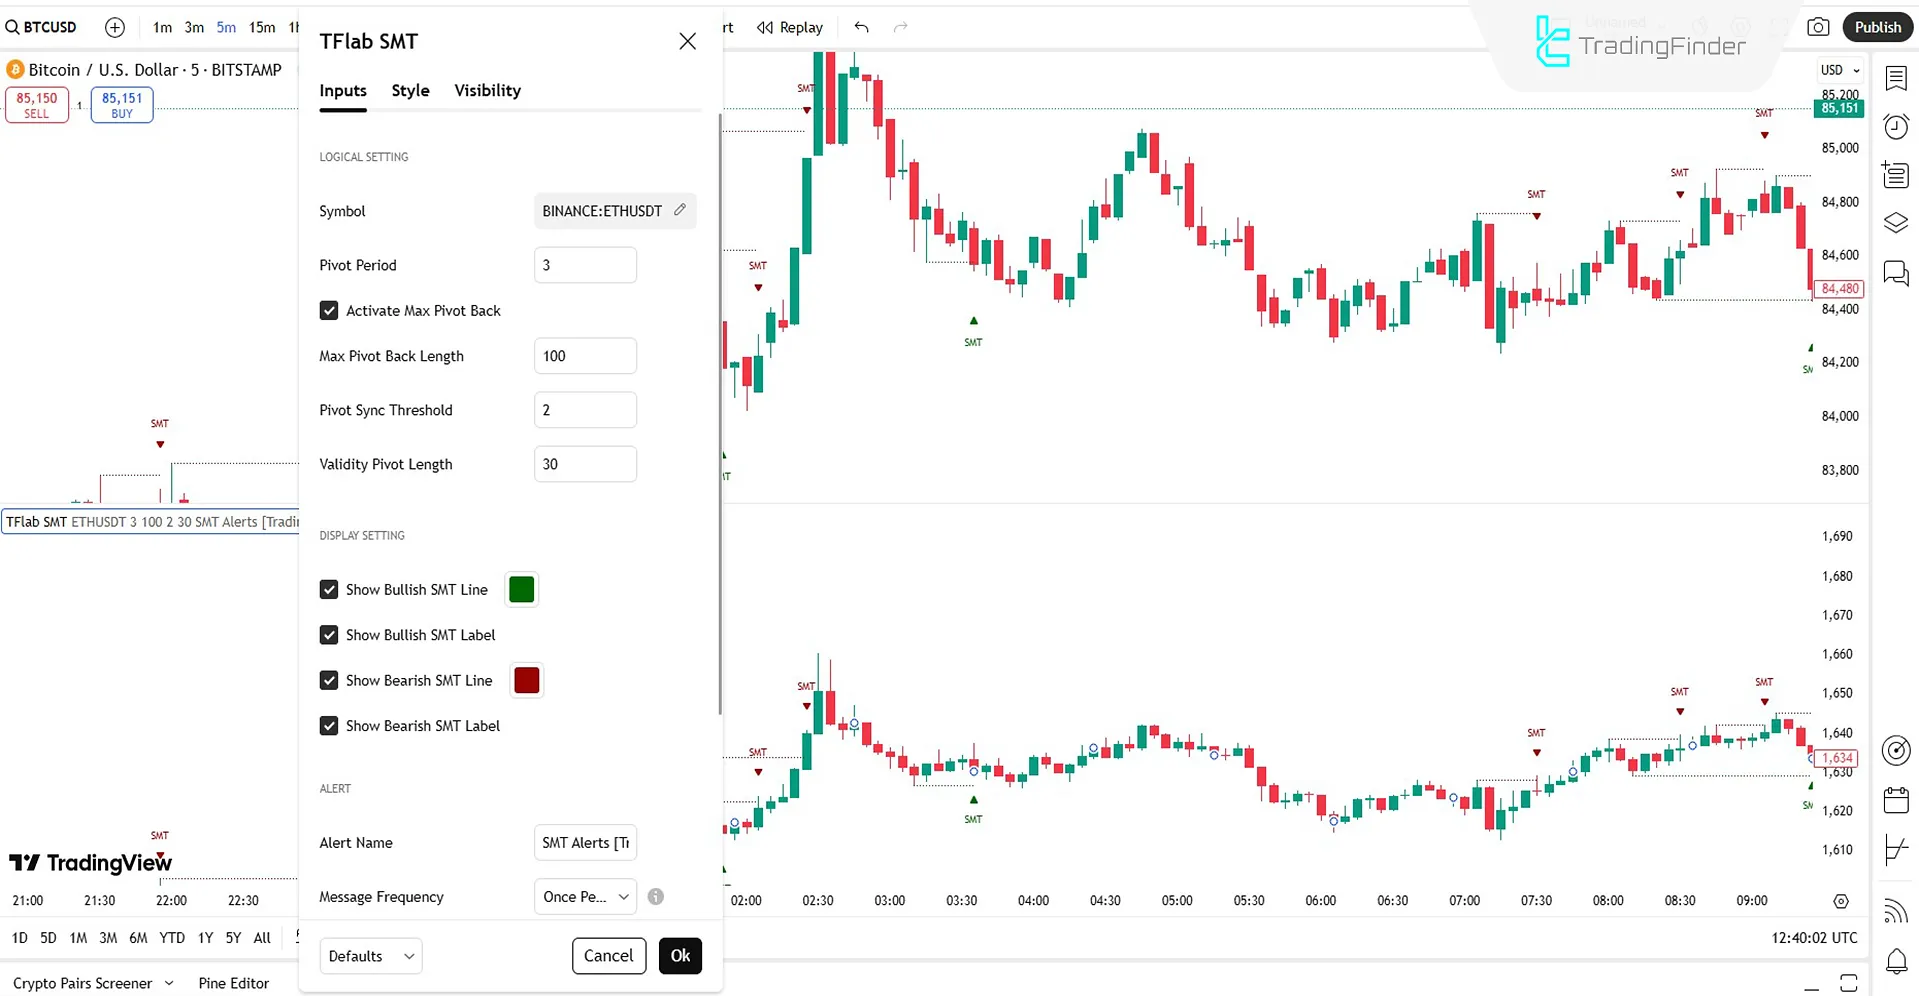
Logical Setting
- Symbol: The second symbol used for comparison with the primary one
- Pivot Period: Number of candles used to determine highs and lows
- Activate Max Pivot Back: Number of past candles for calculations
- Max Pivot Back Length: Maximum number of candles to find pivots
- Pivot Sync Threshold: Allowed deviation between pivots of both symbols
- Validity Pivot Length: Time range for validating identified pivots
Display Setting
- Show Bullish SMT Line: Display bullish SMT line
- Show Bullish SMT Label: Show "SMT" label for bullish divergences
- Show Bearish SMT Line: Display bearish SMT line
- Show Bearish SMT Label: Show the "SMT" label for bearish divergences
Alert
- Alert Name: Name of the alert
- Message Frequency: Alert sending frequency
- Show Alert Time by Time Zone: Alert time based on UTC zone
- Bullish SMT Divergence: Enable alert for bullish divergences
- Bearish SMT Divergence: Enable alert for bearish divergences
- Inputs in the status line: Show indicator settings in the top toolbar of the chart
Conclusion
The SMT Divergence ICT 02 Indicator displays divergences between correlated trading symbols using colored lines and arrows.
Without limitations, this indicator can be used across all symbols, including Forex, cryptocurrencies, stocks, and commodities. It can also be used alongside fundamentalanalysis for more comprehensive insights.
SMT Divergence ICT 02 TradingView PDF
SMT Divergence ICT 02 TradingView PDF
Click to download SMT Divergence ICT 02 TradingView PDFCan this indicator be used on a daily timeframe?
Yes, it supports multi-timeframe use and works across all timeframes.
Can this tool be used for index symbols or metals?
Yes, this indicator is capable of showing divergences across all trading symbols.


