


TradingView
MetaTrader4
MetaTrader5
The Trailing Stop Loss indicator is one of the most advanced and practical tools in the TradingView platform, enabling traders to identify optimal entry and exit points.
By analyzing market trends and dynamically calculating the stop loss, this indicator provides professional risk management capabilities.
Using this tool, traders can determine the best entry point and automatically calculate/displays a trailing stop loss (see Stop Loss & Take Profit).
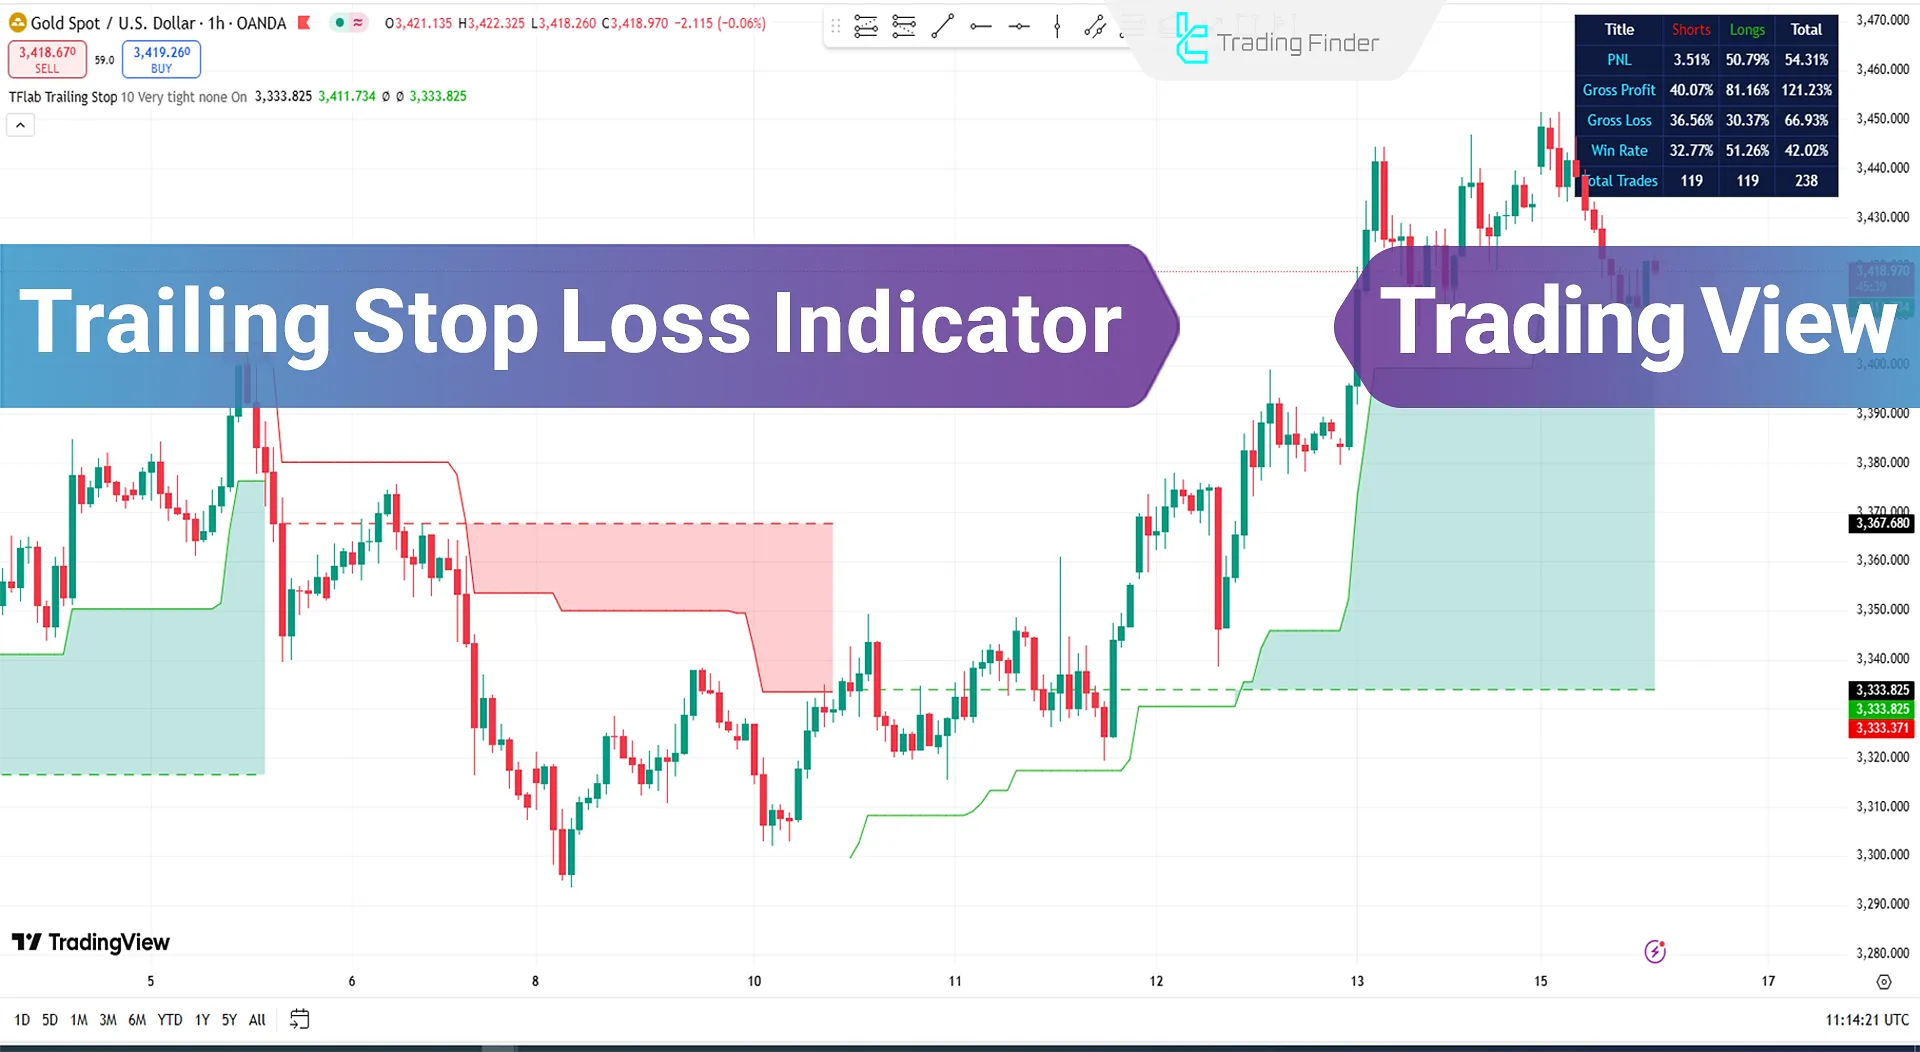
This feature is particularly useful in volatile markets, as the stop loss updates in real-time to protect traders’ capital from unexpected price swings.
Trailing Stop Loss Indicator Overview Table
Below are the key specifications of the Trailing Stop Loss Indicator:
Indicator Categories: | Trading Assist Tradingview Indicators Risk Management Tradingview Indicators Cycles Tradingview Indicators |
Platforms: | Trading View Indicators |
Trading Skills: | Intermediate |
Indicator Types: | Leading Tradingview Indicators Entry & Exit TradingView Indicators |
Timeframe: | Multi-Timeframe Tradingview Indicators |
Trading Style: | Intraday Tradingview Indicators Day Trading Tradingview Indicators Scalper Tradingview Indicators |
Trading Instruments: | TradingView Indicators in the Forex Market Stock Tradingview Indicators Indices Tradingview Indicators Share Stocks Tradingview Indicators |
Indicator at a Glance
The Trailing Stop Loss is an advanced tool that functions as a trailing stop, enabling smart risk management. It dynamically calculates the stop loss based on price movements, helping traders make optimal decisions in various market conditions.
When a trader enters a buy or sell position, the indicator dynamically sets and updates the stop loss. This mechanism is highly effective in strong trends, as it locks in profits while protecting capital against sudden reversals.
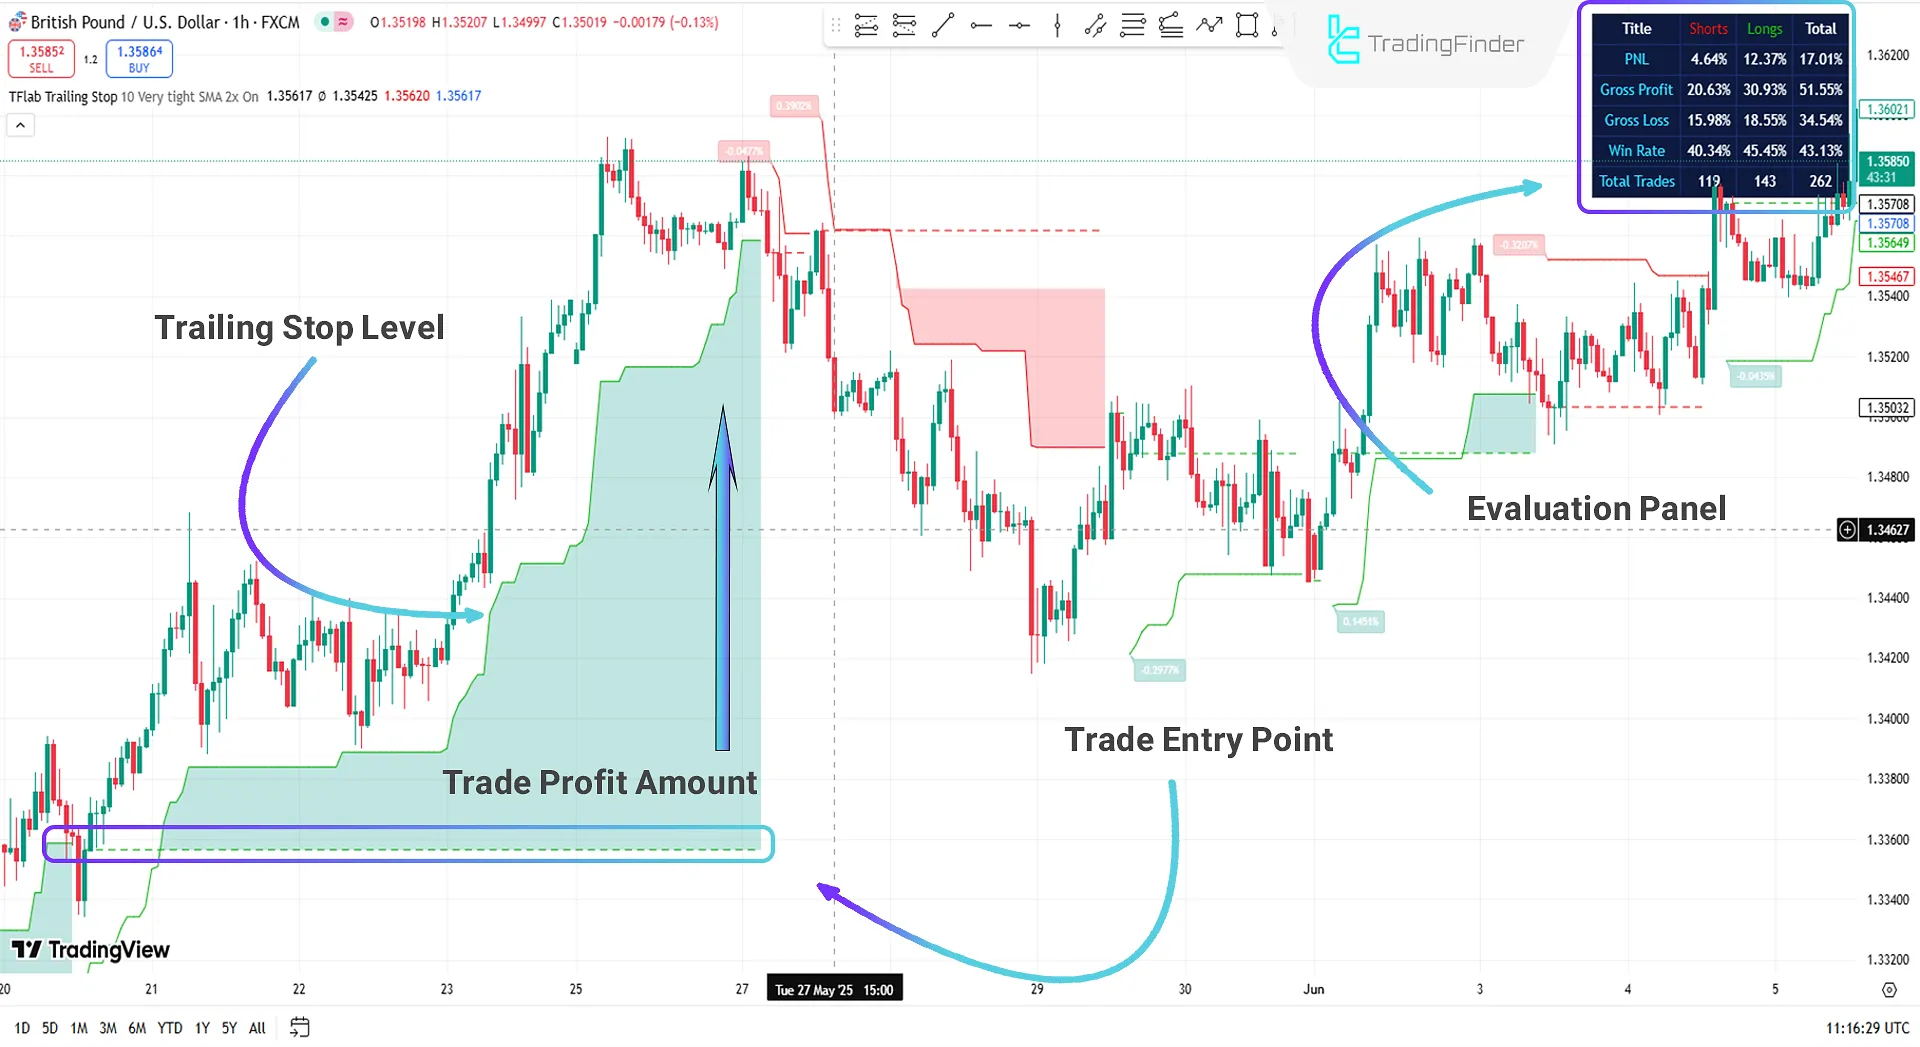
Uptrend Example
On the 1-hour chart of GBP/USD, the Trailing Stop Loss Indicator identifies the optimal entry point and displays it as a dotted line.
After entering the trade, the trader can rely on the green line to set the stop loss. As the price moves, this line shifts upward to protect profits and minimize losses. This mechanism allows traders to enhance performance through intelligent risk management.
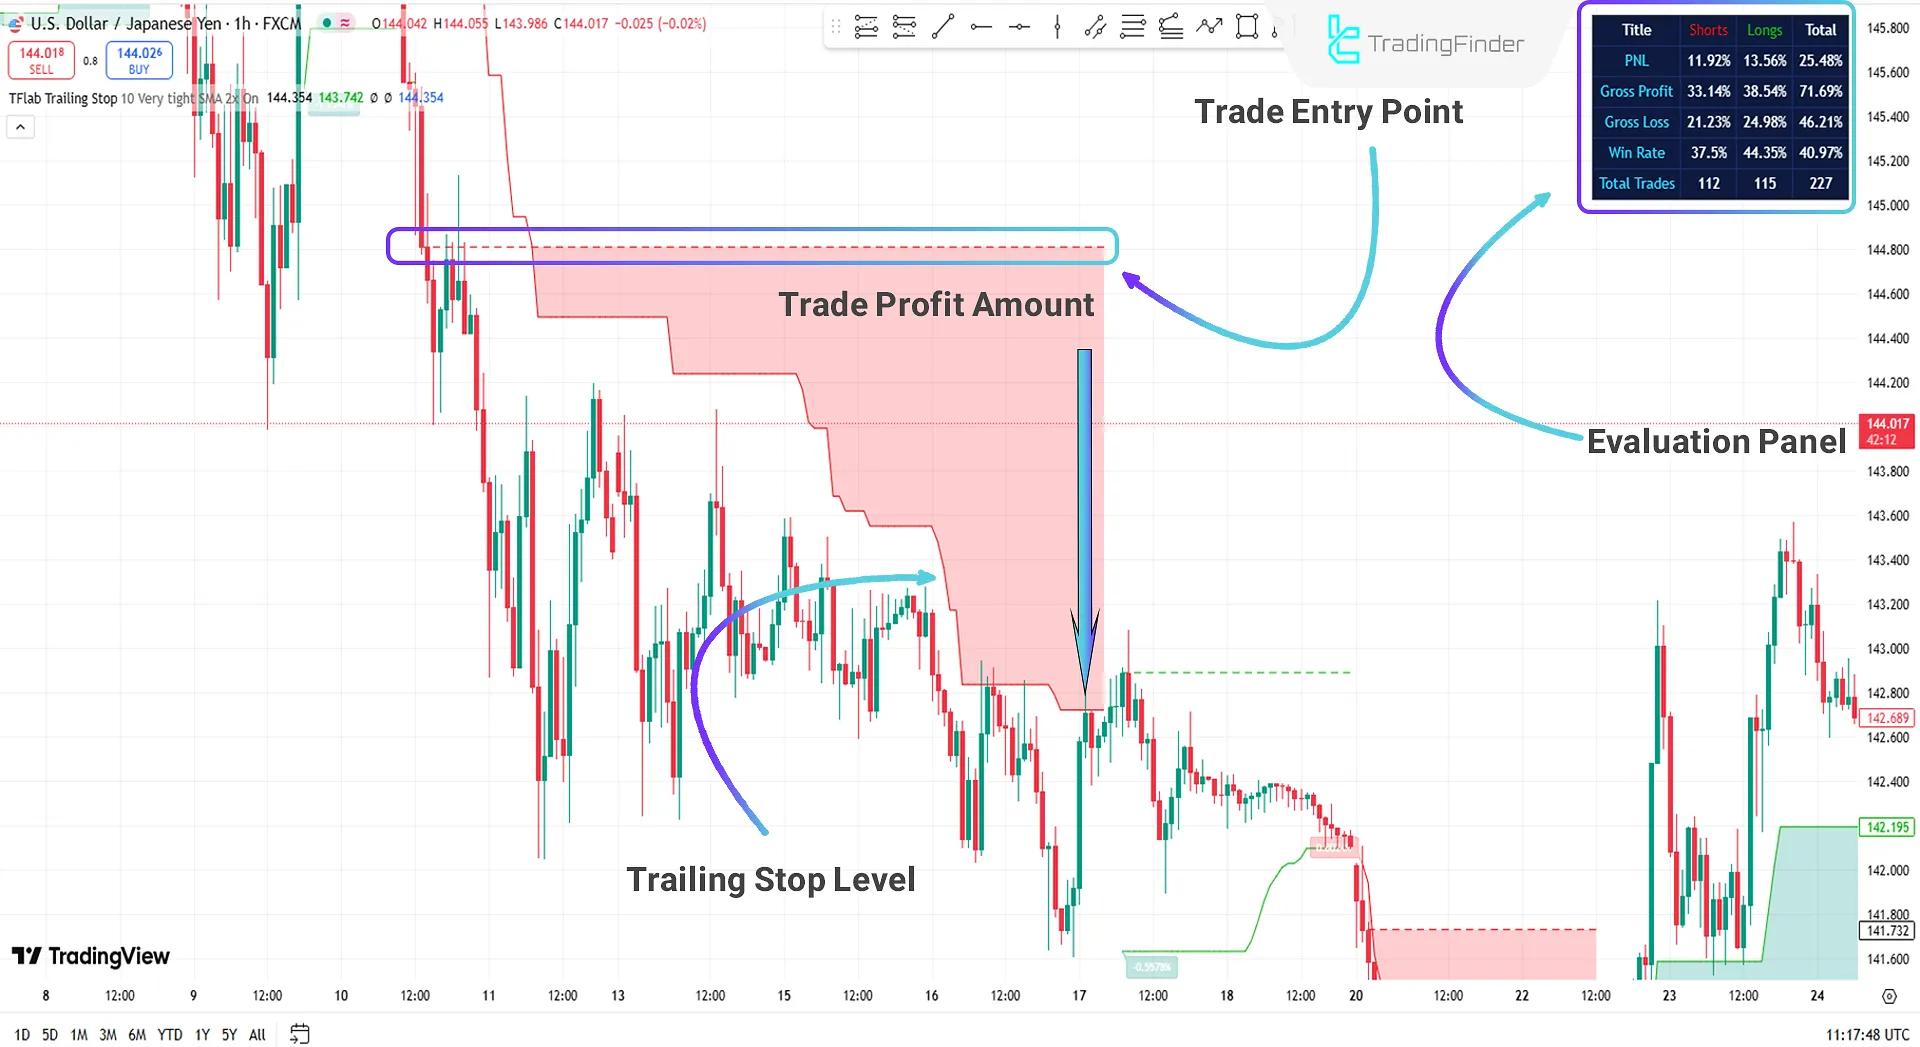
Downtrend Example
On the 1-hour chart of USD/JPY, traders can use the Trailing Stop Loss Indicator to identify the best entry point for a short position. The indicator automatically calculates the stop loss and displays it as a red line on the chart, enabling precise risk management.
The top-right panel displays critical data such as P&L, Win Rate, and Profit/Loss Percentage, allowing traders to quickly analyze their positions and make informed decisions.
Trailing Stop Loss Indicator Settings
Below are the customizable settings for the indicator:
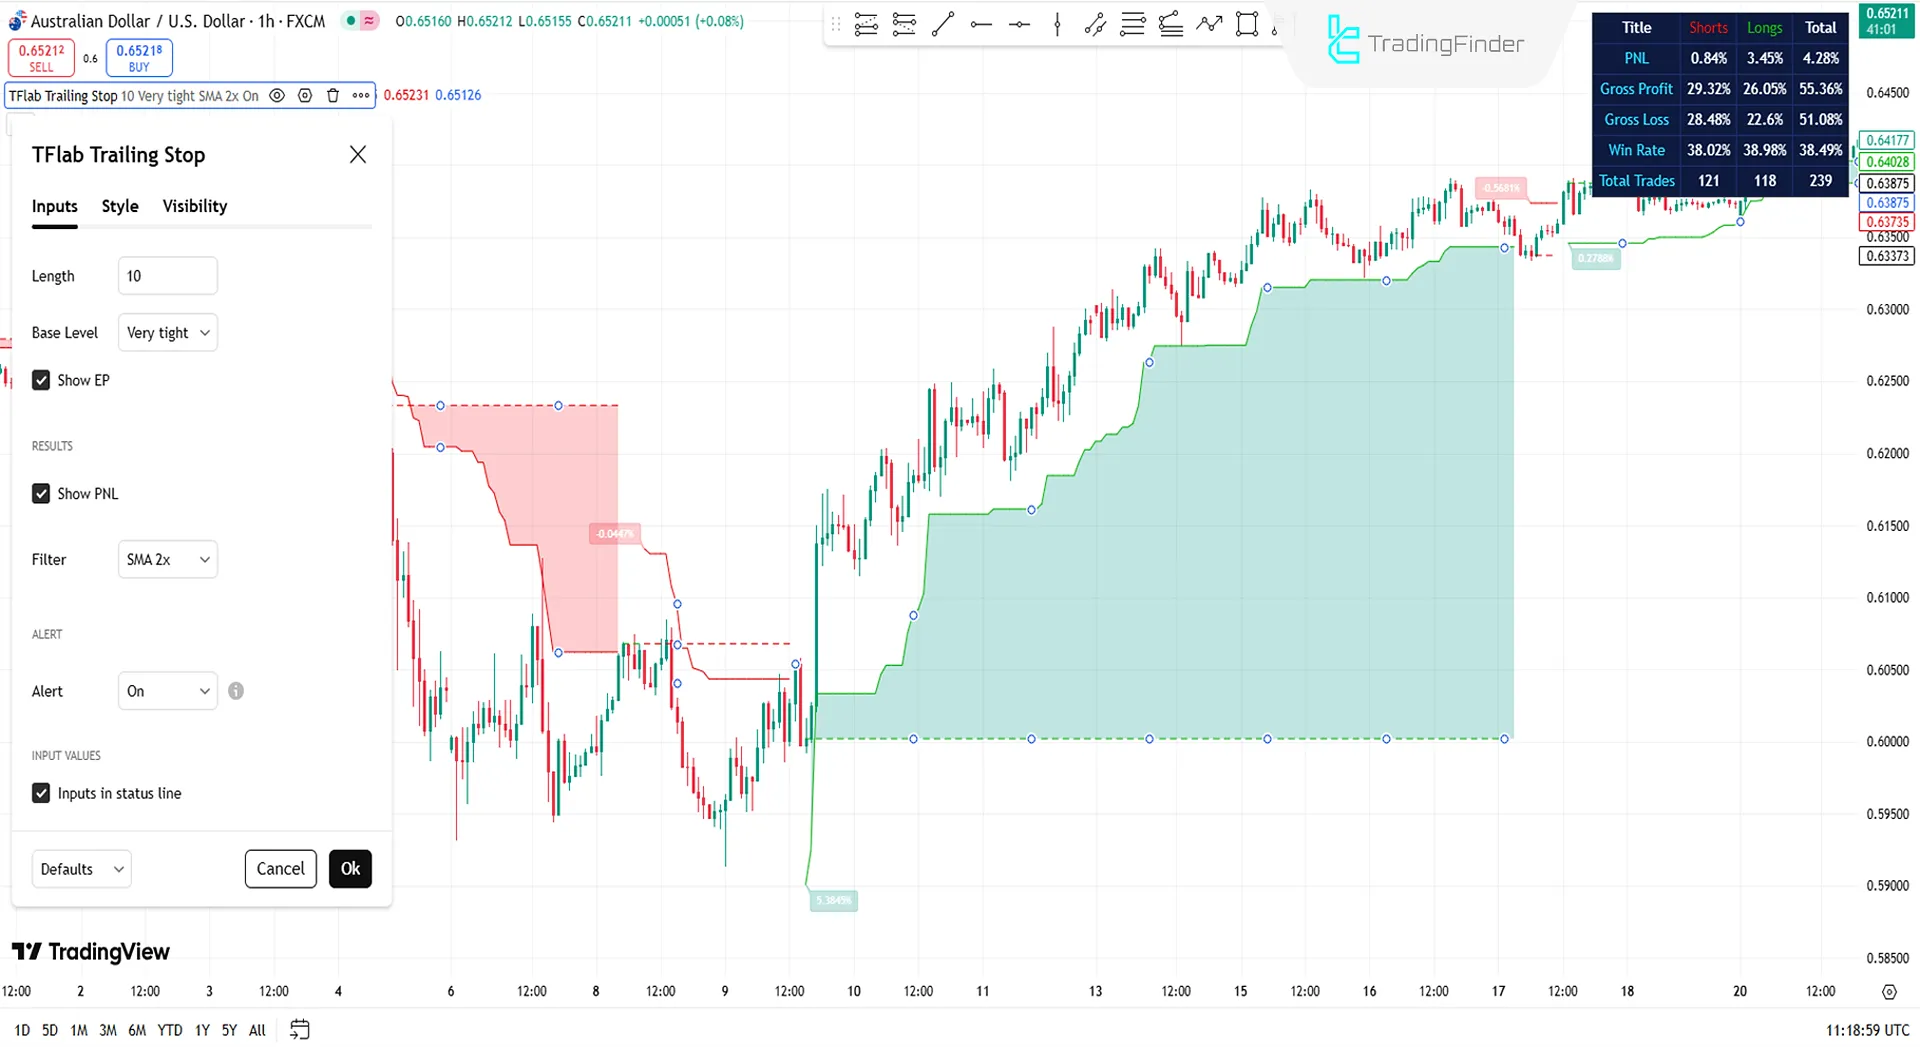
- Length: Sets the calculation period
- Base Level: Adjusts the calculation method
- Show EP: Toggles entry point visibility
- Show PNL: Displays the profit/loss panel
- Filter: Selects the calculation filter type
- ALERT: Enables/disables alert notifications
- Inputs in Status Line: Shows/hides input values in the status line
Conclusion
The Trailing Stop Loss Indicator is a specialized tool in Technical Analysis that uses advanced algorithms to identify optimal entry points and dynamically adjusts the stop loss to protect against sudden reversals.
This feature allows traders to manage risk intelligently, lock in profits, and maximize efficiency. By leveraging this indicator, traders can navigate market volatility with greater confidence.
Adding The Trailing Stop Loss TradingView PDF
Adding The Trailing Stop Loss TradingView PDF
Click to download Adding The Trailing Stop Loss TradingView PDFWhat is the Trailing Stop Loss Indicator?
A dynamic technical analysis tool that calculates and updates the stop loss in real-time, helping traders identify optimal exit points.
What are its key advantages?
- Smart Risk Management: Automatically adjusts the stop loss to protect capital from unexpected volatility.
- Profit Maximization: Locks in gains during strong trends by trailing the stop loss.


