


The Twitter Model ICT Indicator is an advanced tool among TradingView indicators. It is used for market structure analysis, liquidity evaluation, and identifying daily high/low levels. This indicator also provides trade entry signals.
The Twitter Model functions in both bullish and bearish directions. It utilizes ICT concepts like CISD to confirm entry points and identify potential trading setups.
Indicator Specifications Table
The table below summarizes the key specifications of this indicator:
Indicator Categories: | ICT Tradingview Indicators Signal & Forecast Tradingview Indicators Liquidity Tradingview Indicators |
Platforms: | Trading View Indicators |
Trading Skills: | Intermediate |
Indicator Types: | Reversal Tradingview Indicators |
Timeframe: | M1-M5 Time Tradingview Indicators M30-M15 Time Tradingview Indicators H4-H1 Time Tradingview Indicators |
Trading Style: | Intraday Tradingview Indicators |
Trading Instruments: | TradingView Indicators in the Forex Market Cryptocurrency Tradingview Indicators Forward Tradingview Indicators |
Overview of the Indicator
The Twitter Model ICT is a liquidity-based trading strategy that analyzes price movements relative to the Previous Day's High (PDH) and Previous Day's Low (PDL). It also integrates the Fair Value Gap (FVG) concept to identify key entry points.
Combining these elements makes the Twitter Model ICT Indicator a valuable tool for market structure analysis and liquidity zone assessment.
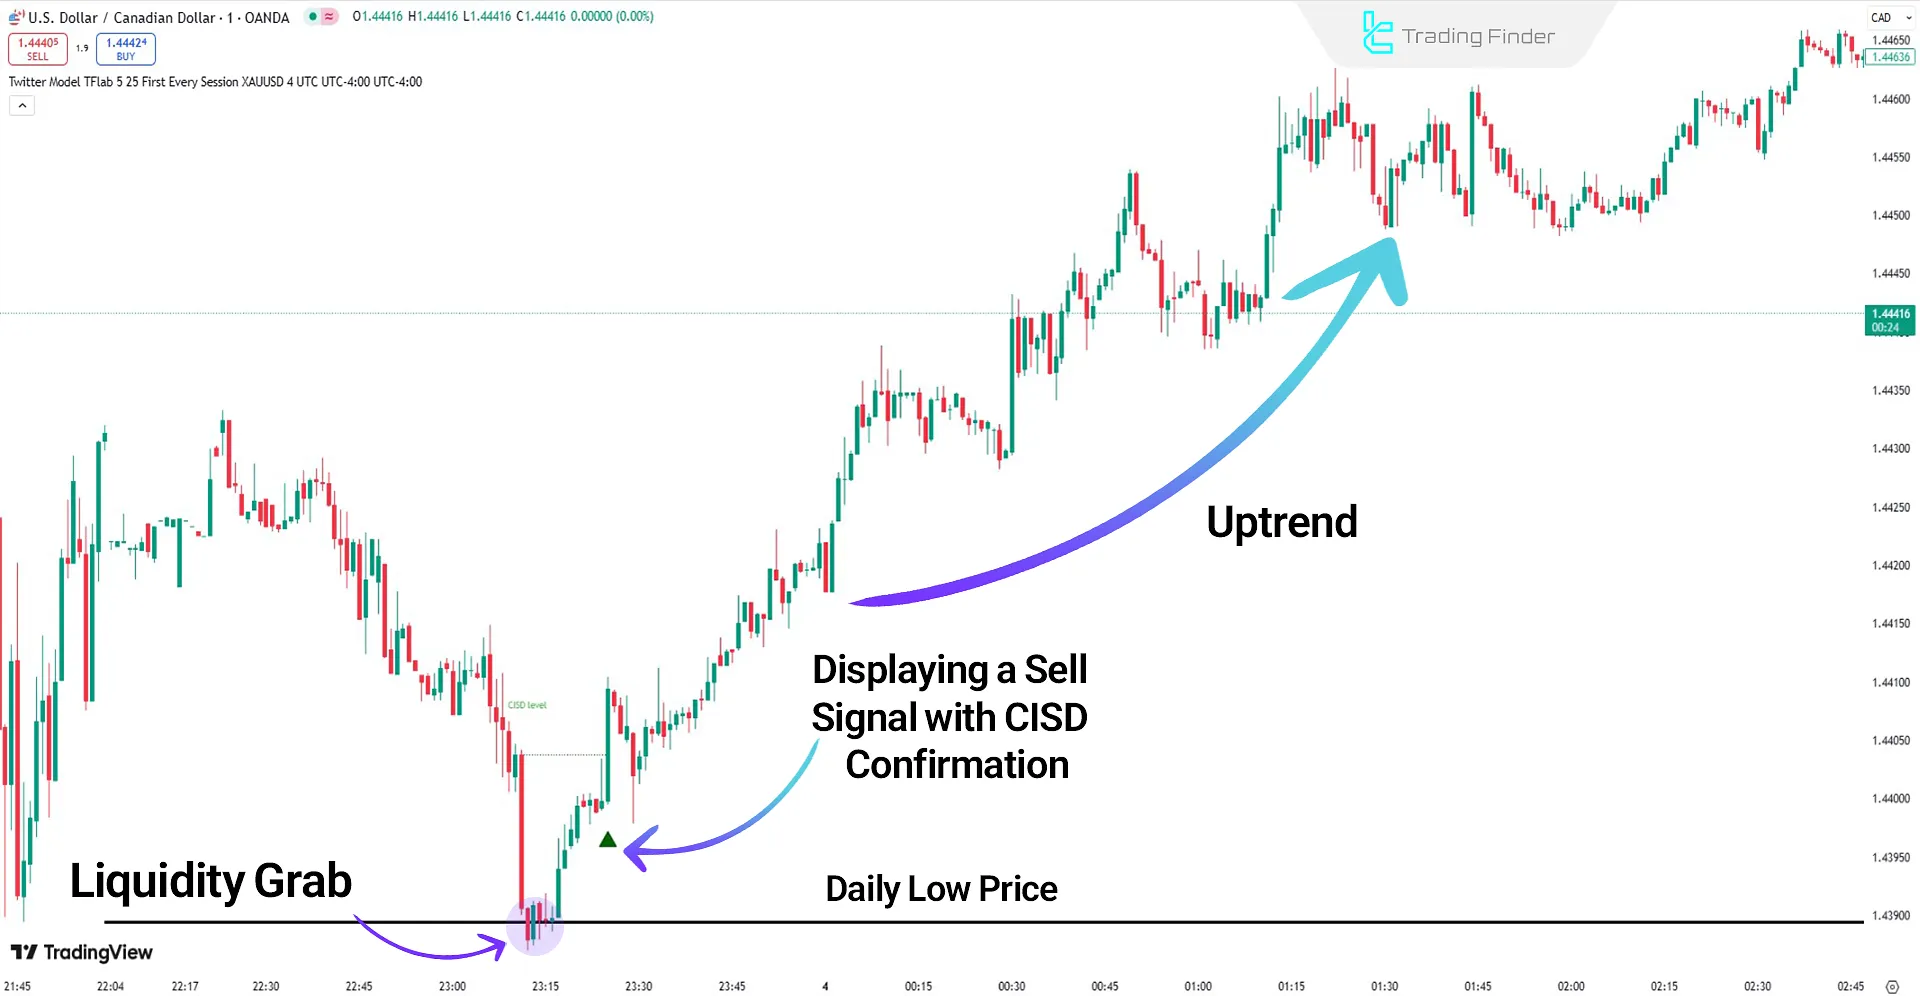
Indicator in an Uptrend
Based on the USD/CAD 1-minute chart, this indicator's bullish setup first captures liquidity below the Previous Day's Low (PDL).
The price returns to the daily range, generating a buy entry signal following CISD confirmation.
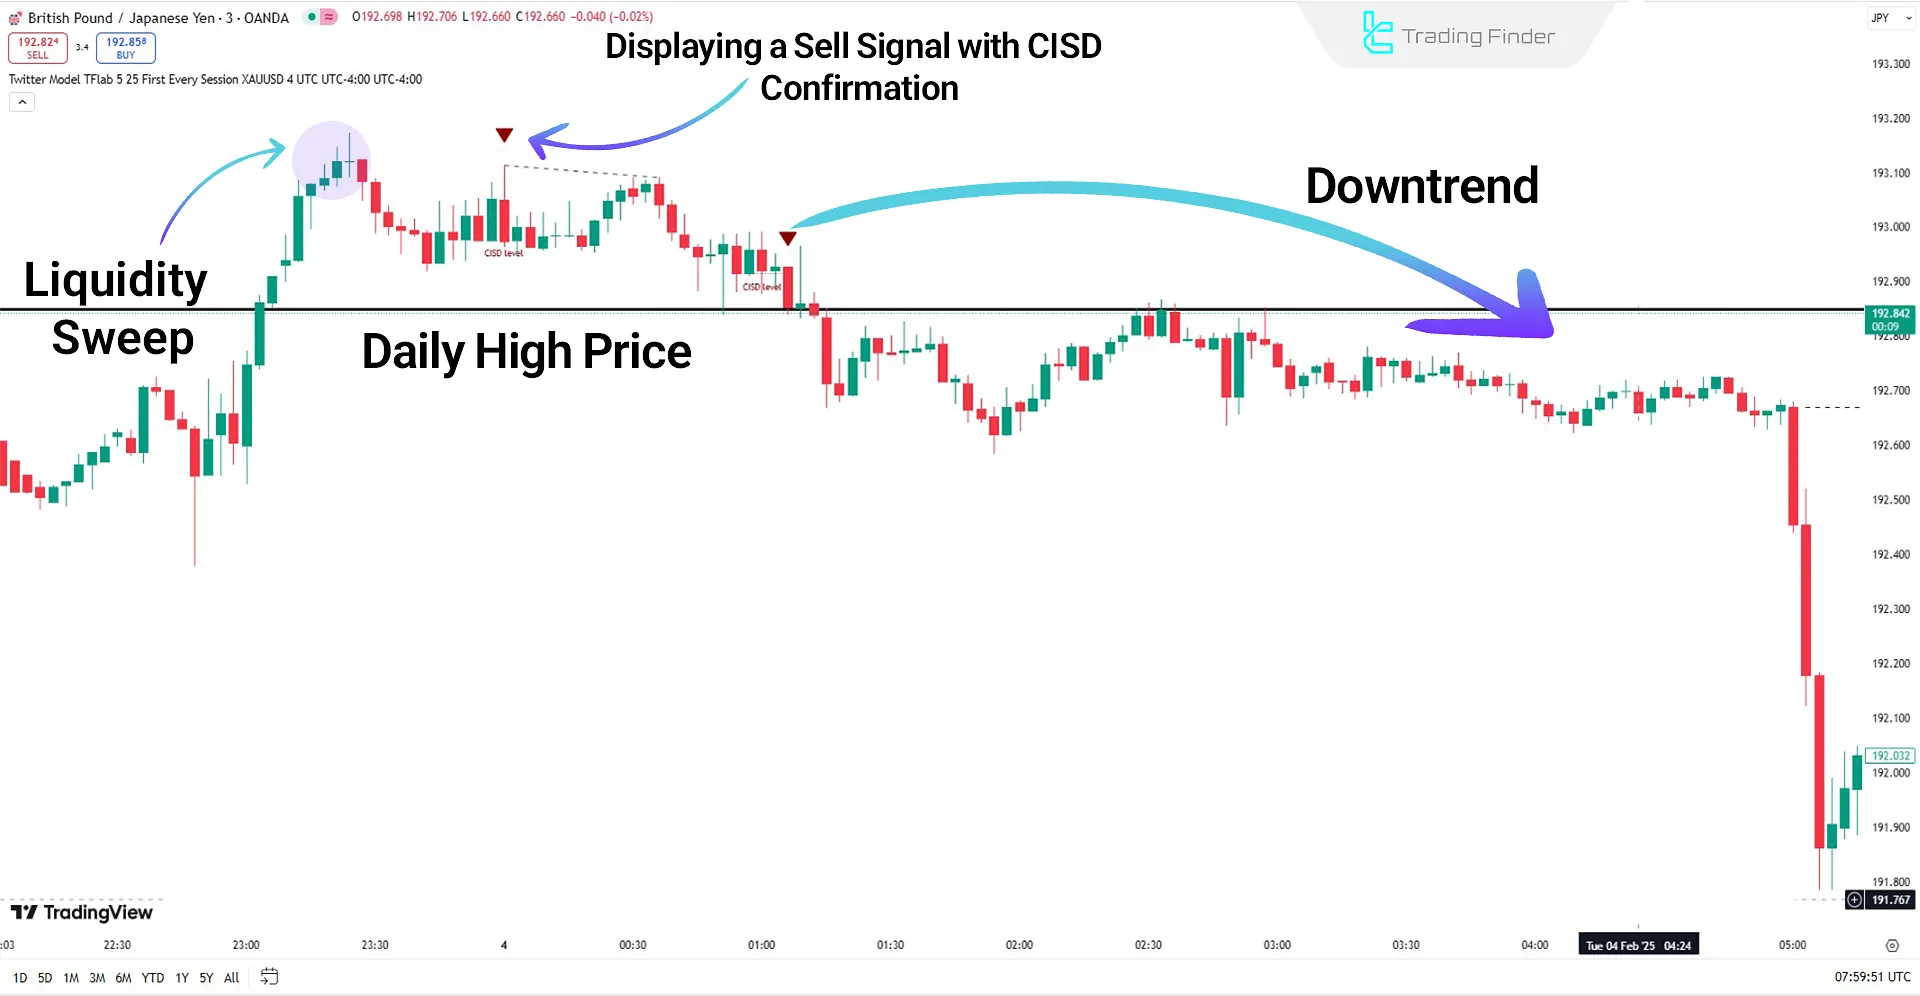
Indicator in a Downtrend
In a downtrend on the GBP/JPY pair, liquidity is absorbed once the price reaches the Previous Day's High (PDH).
As the price returns to the daily price range, a Short entry signal is triggered upon CISD confirmation.
Indicator Settings
The image below displays the full indicator settings:
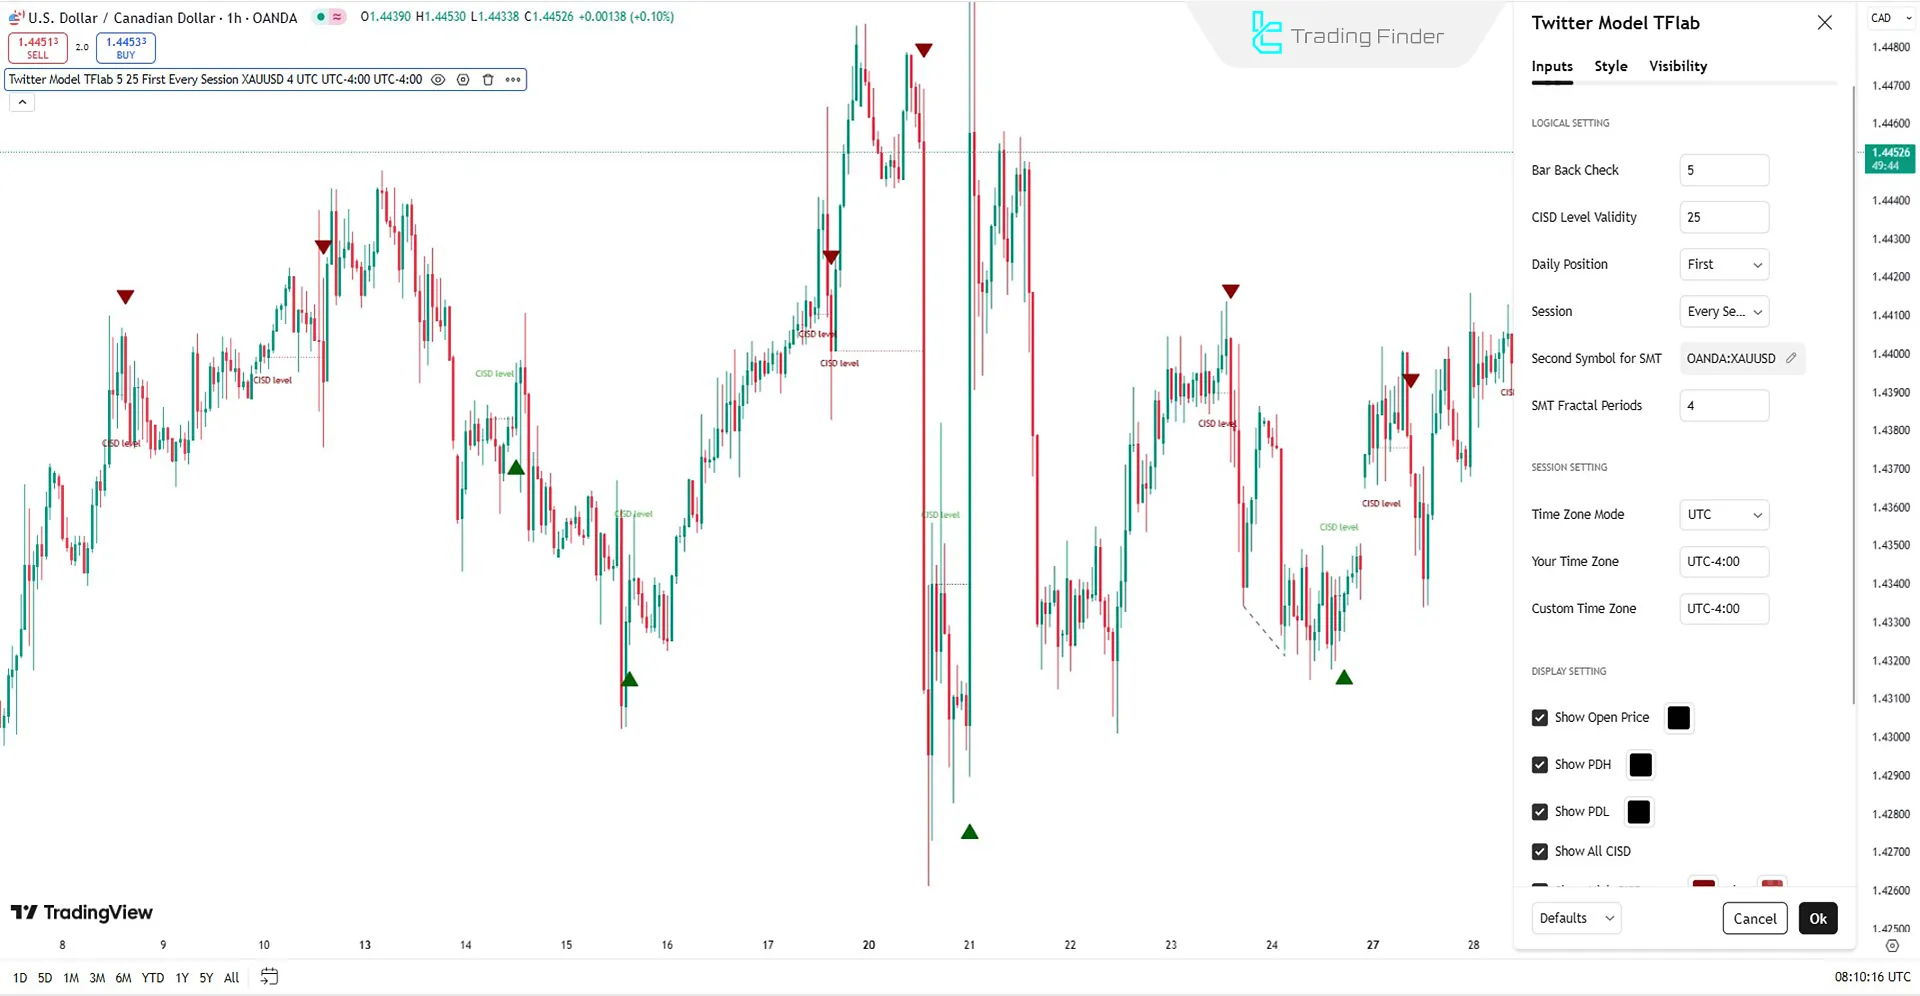
Logical Setting
- Bar Back Check: Number of previous candlesticks to check
- CISD Level Validity: Duration of CISD level validity
- Daily Position: Daily positioning
- Session: Trading session
- Second Symbol for SMT: Second symbol for divergence
- SMT Fractal Periods: Fractal period calculation
Session Setting
- Time Zone Mode: Time zone mode
- Your Time Zone: User's time zone
- Custom Time Zone: Custom time zone
Display Setting
- Show Open Price: Display opening price
- Show PDH: Display the Previous Day's High
- Show PDL: Display Previous Day's Low
- Show All CISD: Display all CISD levels
- Show High CISD Name: Display high CISD level name
- Show Low CISD Line: Display low CISD level name
- Show SMT Divergence Line from the Bottom: Display SMT divergence line from below
- Show SMT Divergence Label from the Bottom: Display SMT divergence label from below
- Show SMT Divergence Line from the Top: Display SMT divergence line from above
- Show SMT Divergence Label from the Top: Display SMT divergence label from above
Conclusion
The Twitter Model ICT Indicator is a comprehensive market analysis tool based on the ICT model. It examines Market Structure (MS), Liquidity Zones, and Change in the Delivery of Price (CISD).
Twitter Model ICT TradingView PDF
Twitter Model ICT TradingView PDF
Click to download Twitter Model ICT TradingView PDFWhat is the Twitter Model ICT Indicator?
The Twitter Model ICT Indicator is an advanced tool in TradingView, designed based on the ICT (Inner Circle Trader) model. It is used for market structure analysis, liquidity zone identification, and daily high/low levels visualization.
Which markets is this indicator suitable for?
The Twitter Model ICT Indicator can be used in Forex, Cryptocurrency, and other financial markets.


