


In addition to the TradingView version, Formula X Master MetaTrader 5 Indicator also available. These versions provide advanced customization options for traders using these platforms.
$4FreeFor a limited time
17K
1
Modified:
The Xmaster Formula Indicator is a powerful tool for Forex trading and is one of the indicators available in Trading View Indicators. This indicator is highly valued for generating Buy and Sell signals.
Key components of this indicator include Exponential Moving Averages (EMA) for identifying trends and price movements, and the Moving Average Convergence Divergence (MACD) for analyzing the strength and direction of trends.
One TradingFinder Developer said:
"There is an indicator called Xmaster that is used for identifying market trends, but some users mistakenly search for XHmaster. This mistake has led to confusion regarding its functionality and availability. However, the correct name is Xmaster."
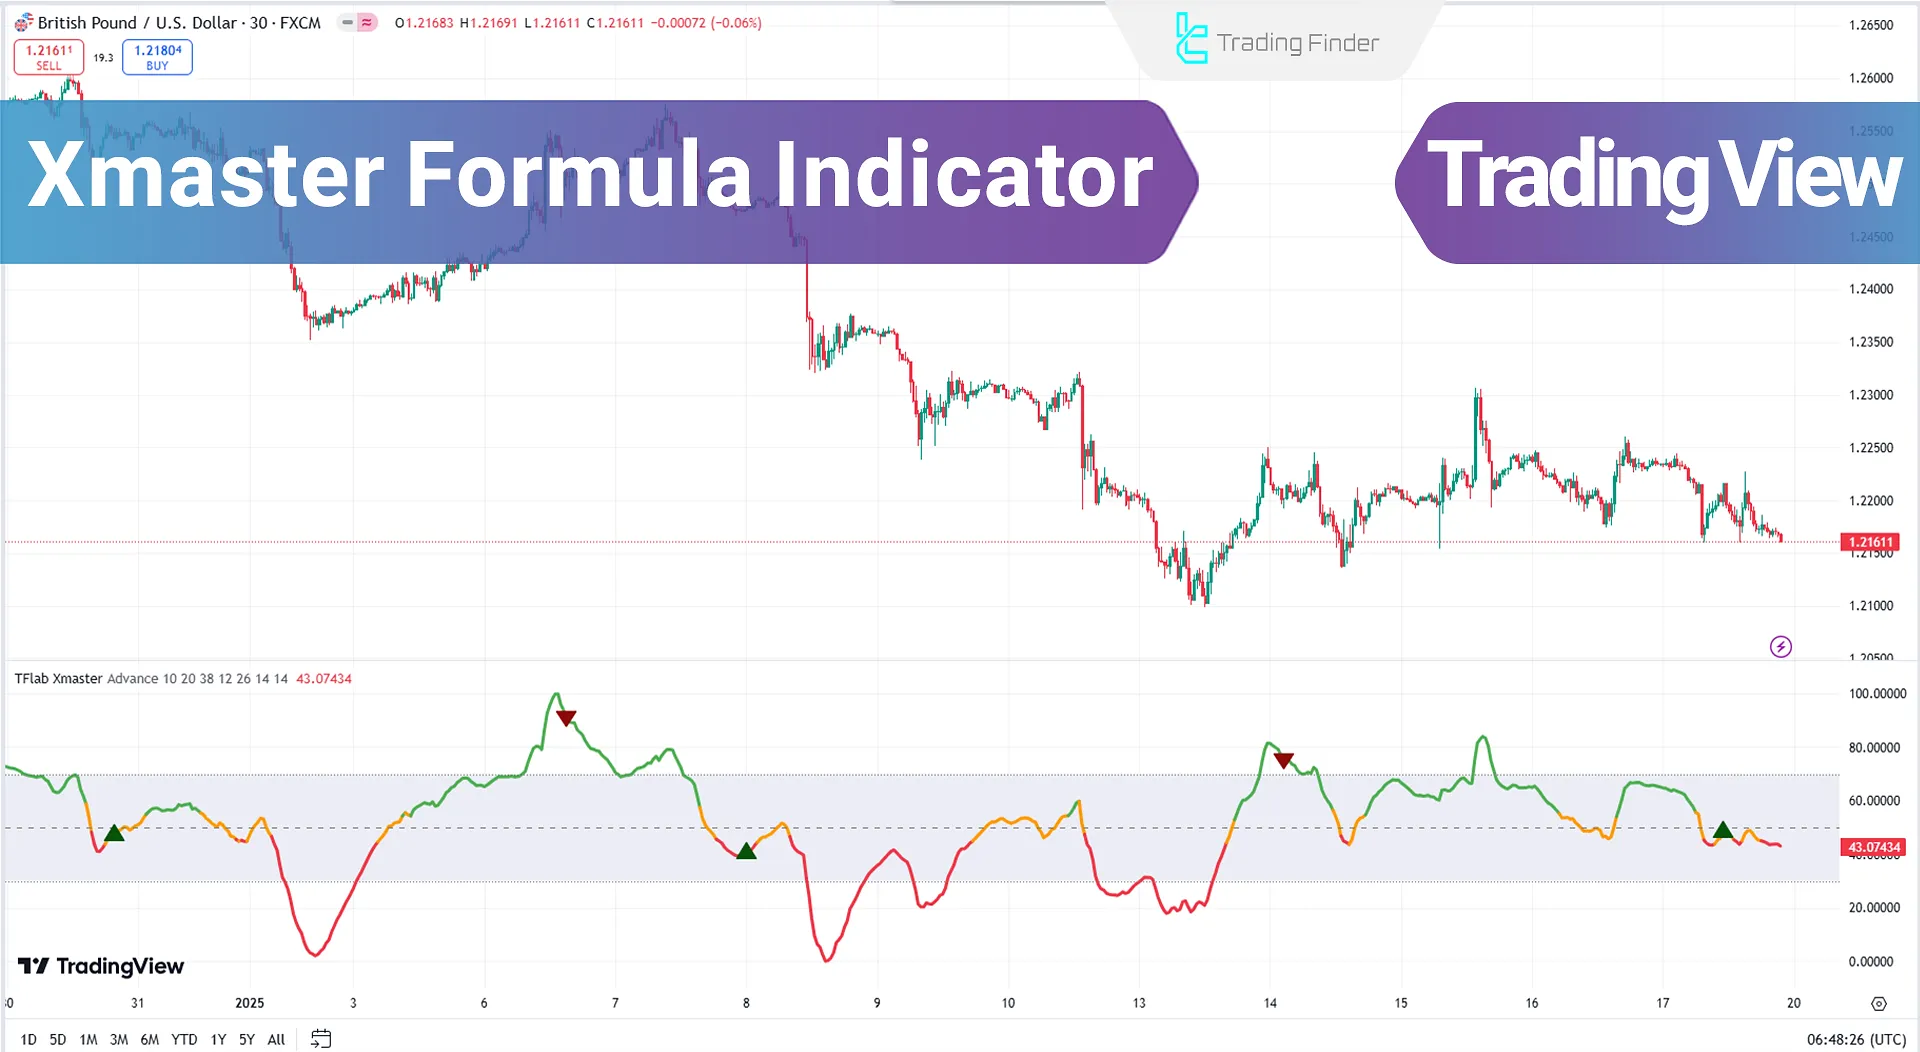
The Stochastic Oscillator and Relative Strength Index (RSI) enhance the analysis by providing probable price reversal signals.
Additionally, Parabolic SAR plays a crucial role in identifying trend changes and managing risks.
Indicator Table
Below is a summary of the indicator's specifications.
Indicator Categories: | Oscillators Tradingview Indicators Signal & Forecast Tradingview Indicators Volatility Tradingview Indicators |
Platforms: | Trading View Indicators |
Trading Skills: | Intermediate |
Indicator Types: | Reversal Tradingview Indicators Leading Tradingview Indicators Entry & Exit TradingView Indicators |
Timeframe: | Multi-Timeframe Tradingview Indicators |
Trading Style: | Intraday Tradingview Indicators Day Trading Tradingview Indicators Scalper Tradingview Indicators |
Trading Instruments: | TradingView Indicators in the Forex Market Stock Tradingview Indicators Indices Tradingview Indicators Binary Option Tradingview Indicators |
Overview of the Indicator
The Xmaster Formula Indicator provides two distinct methods for generating signals: the Standard Mode and the Advanced Mode. Each method is suitable for different trading styles and strategies.
The Xmaster (XHMaster) Formula supports ICT, Smart Money, and other liquidity-based strategies.
- Standard Mode: Signals are generated based on normalized moving average data, which is ideal for quick trades and instant decision-making;
- Buy Signal: Generated when the normalized value exceeds 55, and the trendline turns green;
- Sell Signal: Triggered when the normalized value falls below 45, and the trendline turns red;
- This mode is simple and suitable for traders looking for straightforward signals without additional confirmations.
Indicator in an Uptrend
On the 4-hour chart (NZD/USD), the Standard Mode of the Xmaster (XHMaster) Formula Indicator displays Buy and Sell signals on the chart.
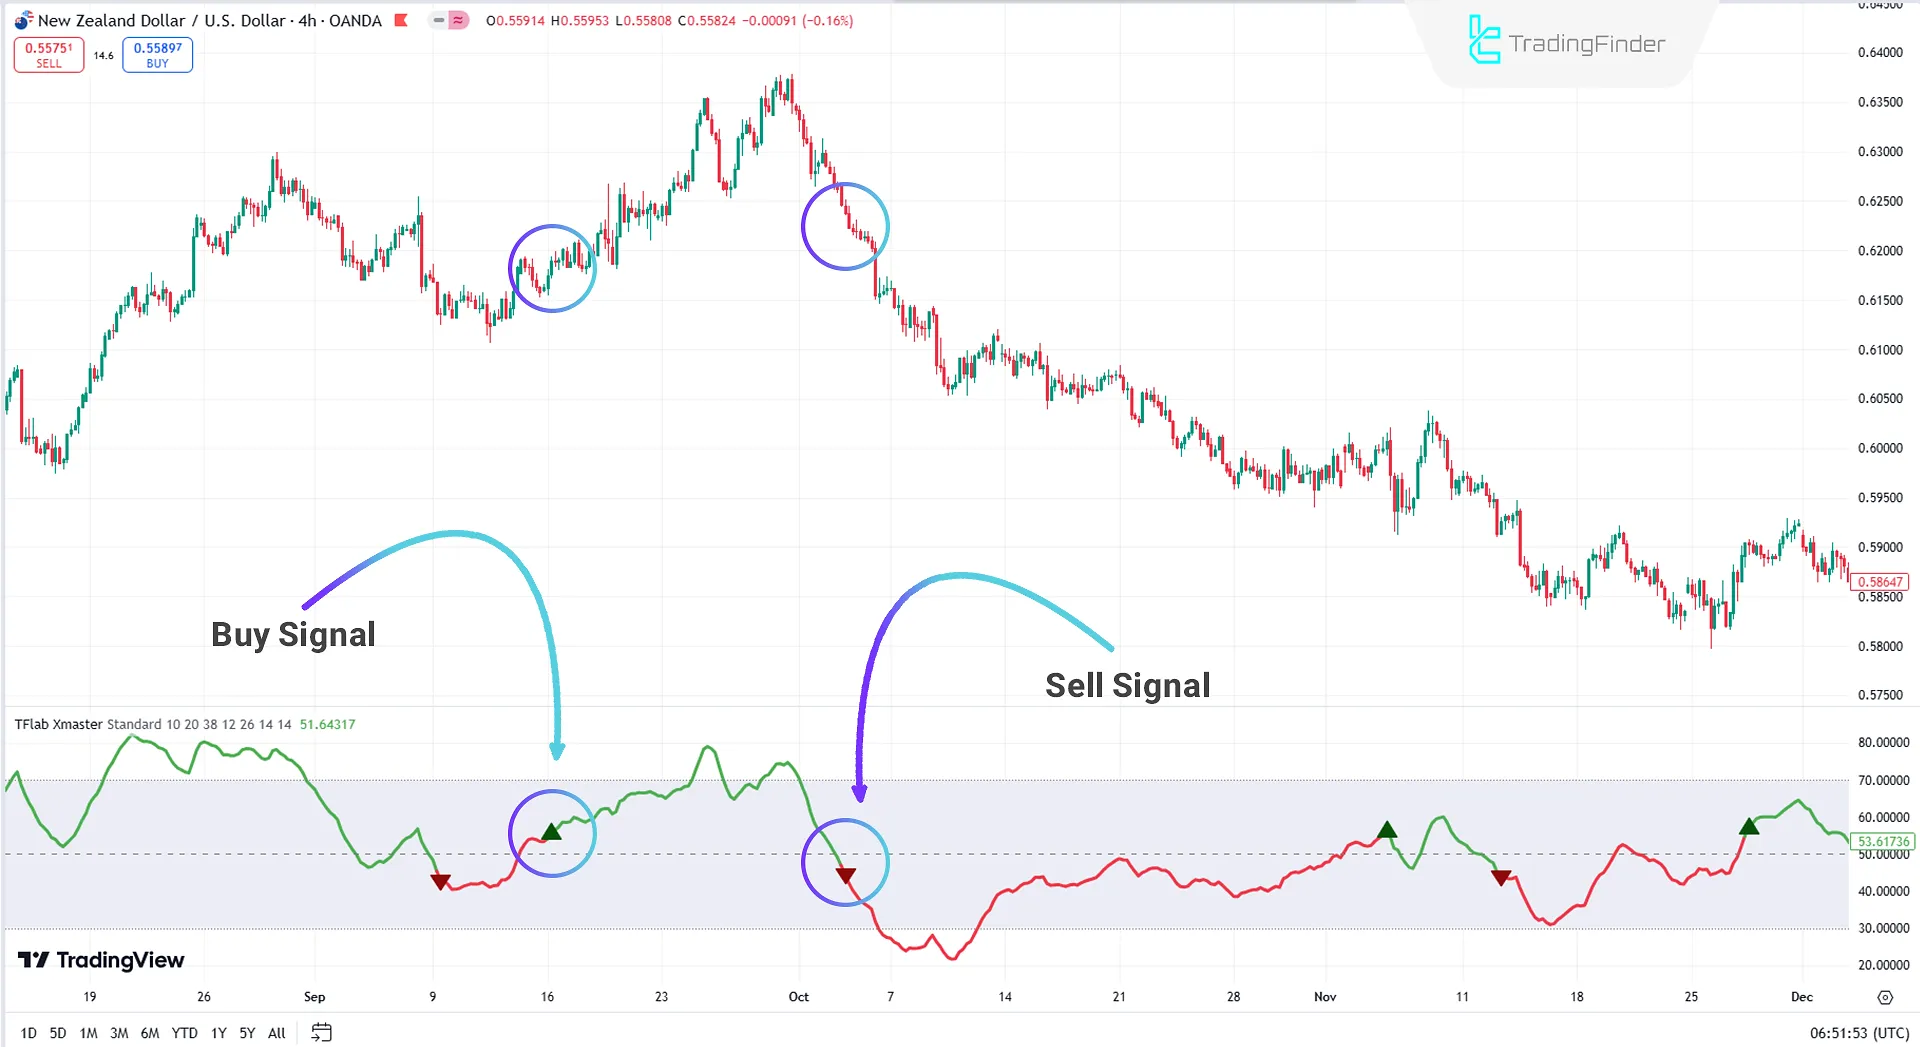 Examining Xmaster (XHMaster) Formula Indicator in an Uptrend, 4-hour NZD/USD chart
In Standard Mode, the indicator calculates the difference between the 10-period short-term EMA and the 38-period long-term EMA and normalizes it to a 0-100 scale.
Indicator in an Downtrend
On the 1-hour chart (CAD/JPY), the Advanced Mode of the Xmaster Formula Indicator demonstrates Buy and Sell signals.
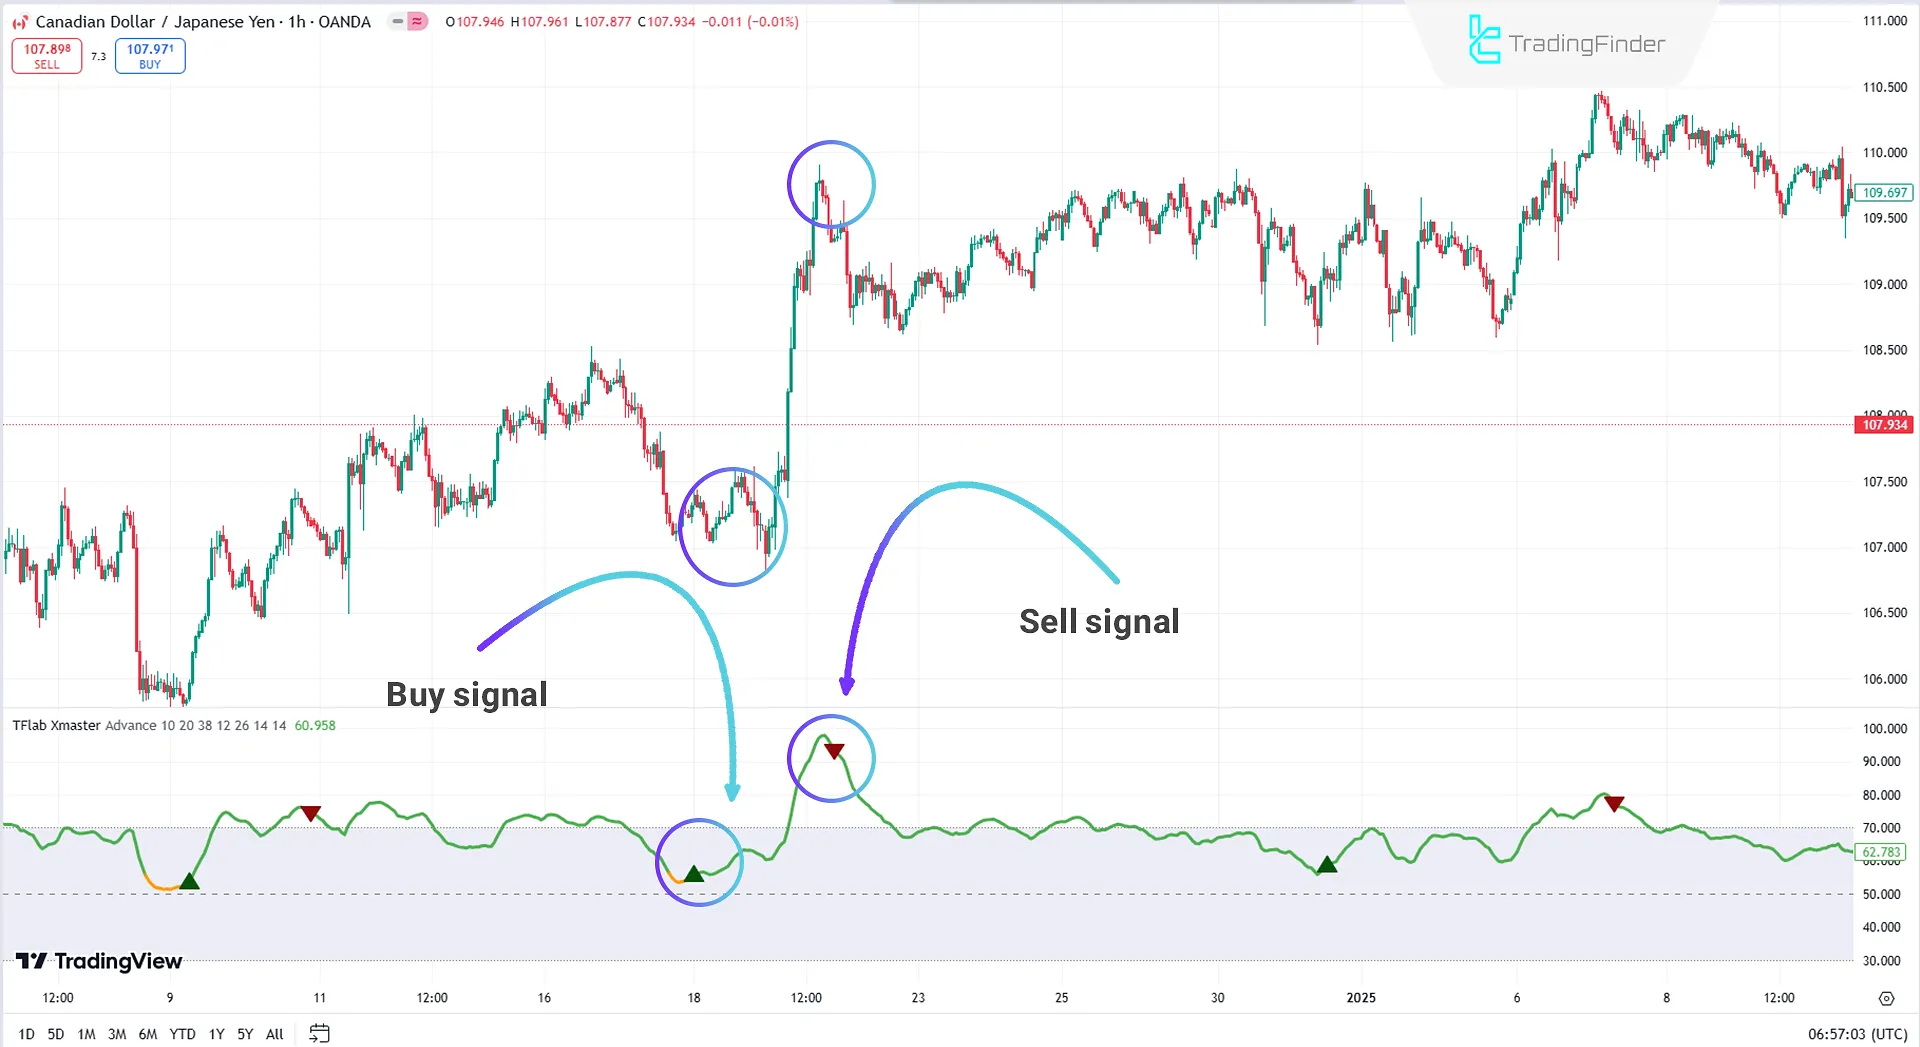
In Advanced Mode, the indicator combines multiple technical indicators to provide more accurate and robust signals.
Tools used in this mode include:
MACD:
- Sell Signal: When MACD histogram bars are negative;
- Buy Signal: When MACD histogram bars are positive.
RSI:
- Sell Signal: When RSI exceeds 70 (overbought);
- Buy Signal: When RSI is below 30 (oversold).
Stochastic Oscillator:
- Sell Signal: When Stochastic value exceeds 80;
- Buy Signal: When Stochastic value falls below 20.
Parabolic SAR:
- Sell Signal: When SAR points are above the price;
- Buy Signal: When SAR points are below the price.
Indicator Settings
The image below shows the settings for the Xmaster Formula Indicator:
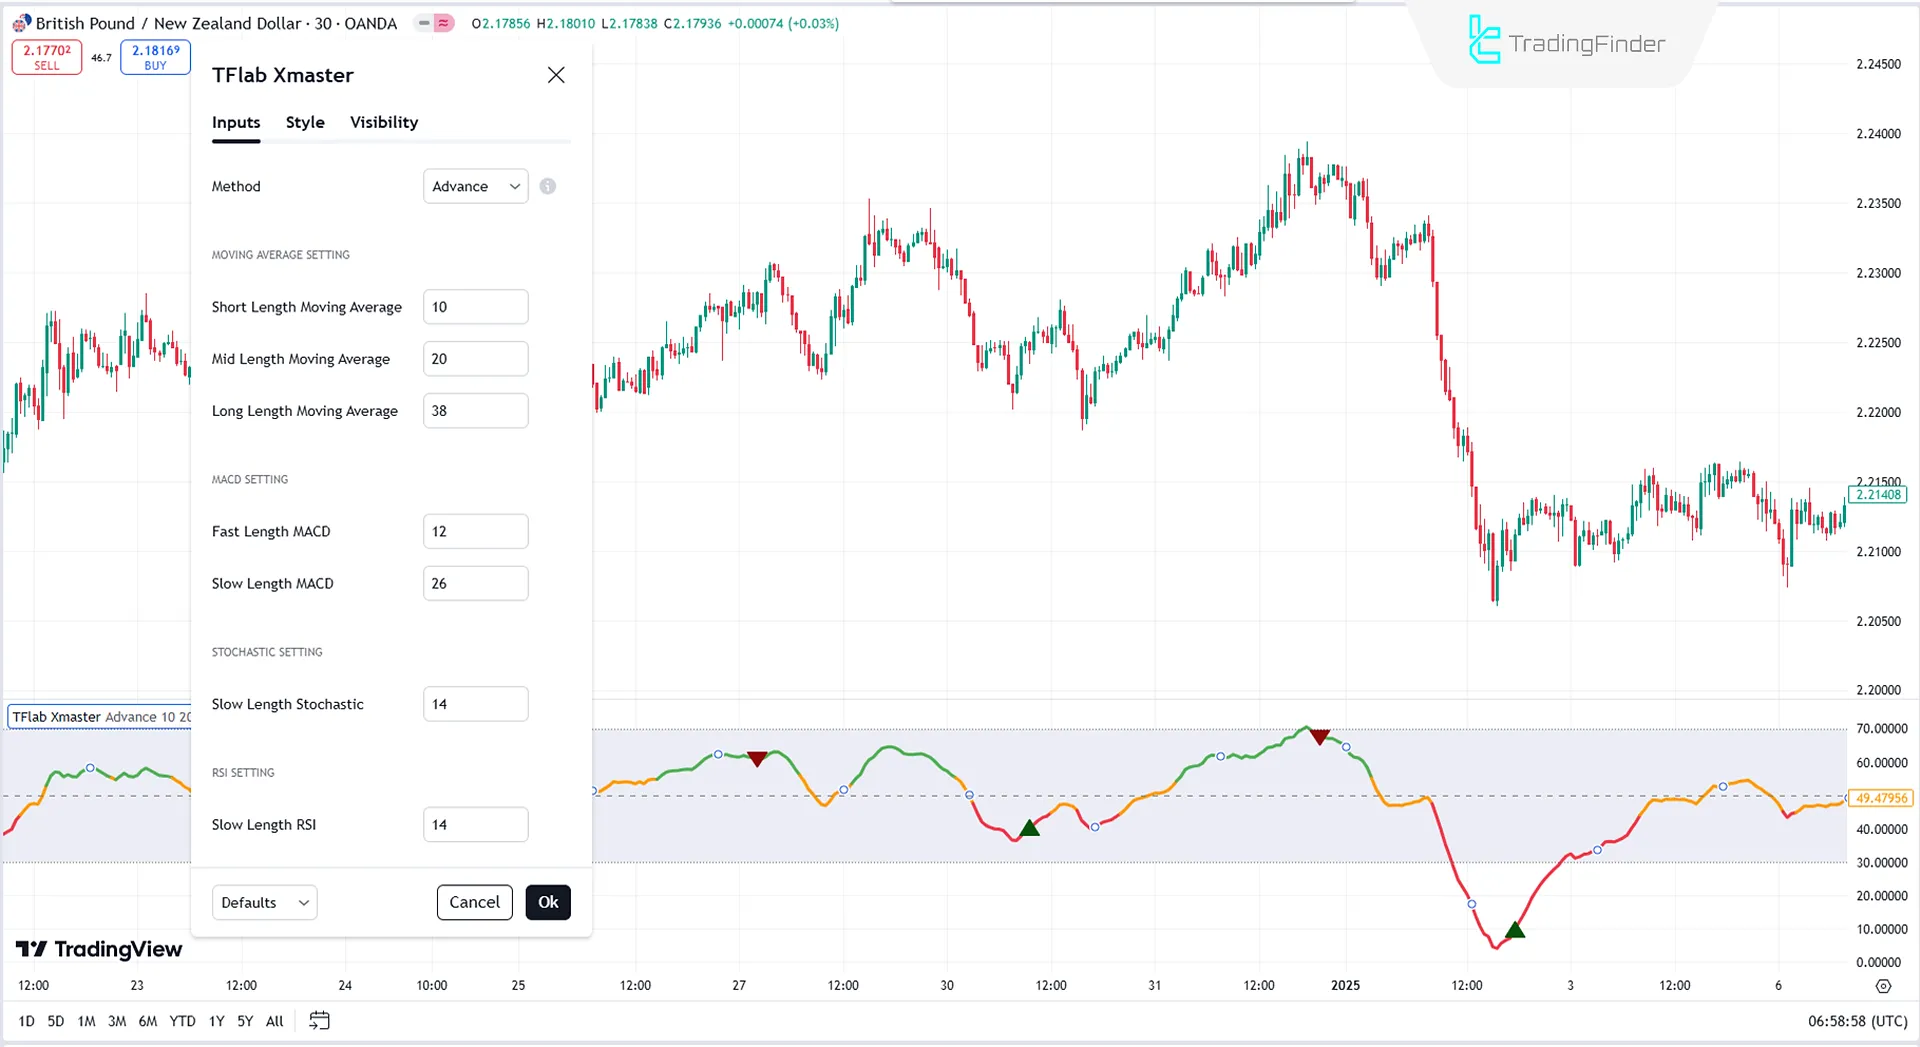
Moving Average Settings
- Short-Term Length: Period for the short-term moving average;
- Mid-Term Length: Period for the mid-term moving average;
- Long-Term Length: Period for the long-term moving average.
MACD Settings
- Fast Length: Period for the fast moving average in MACD calculations;
- Slow Length: Period for the slow moving average in MACD calculations.
Stochastic Settings
- Slow Length: Period for the stochastic oscillator
RSI Settings
- Slow Length: Period for the Relative Strength Index
Conclusion
The Xmaster Formula Indicator is a versatile tool available in both Standard and Advanced Modes.
- In Standard Mode, it generates simple signals based on normalized moving averages, while;
- In Advanced Mode, it combines multiple indicators such as MACD, RSI, Stochastic Oscillator, and Parabolic SAR for more detailed market analysis.
This indicator utilizes EMA for identifying trends, MACD for analyzing strength and direction, RSI and Stochastic Oscillator for detecting reversal signals, and Parabolic SAR for identifying trend changes and managing risks. Together, these tools provide traders with precise market insights.
Xmaster Formula TradingView PDF
Xmaster Formula TradingView PDF
Click to download Xmaster Formula TradingView PDF4.7 From 5.0
(15)
Rate this post
FAQs
What is the Xmaster (XHMaster) Formula Indicator?
The Xmaster Formula Indicator is an advanced tool for Forex traders that generates Buy and Sell signals based on technical data. It combines multiple analysis tools such as Moving Averages, MACD, RSI, Stochastic Oscillator, and Parabolic SAR to provide a comprehensive market overview.
What is the difference between Standard and Advanced Modes in the Xmaster Formula Indicator?
- Standard Mode: Signals are generated based on normalized moving averages, suitable for traders seeking simple trend-based signals.
- Advanced Mode: Signals are derived from a combination of four indicators (MACD, RSI, Stochastic, and Parabolic SAR), ideal for professional traders requiring detailed and precise analysis.
Which platforms is the Xmaster Formula indicator most commonly used on?
The Xmaster Formula indicator is available not only on TradingView but also on MetaTrader 4and MetaTrader 5. These versions offer advanced settings and more precise analysis, providing greater flexibility to traders.
0Comment


