![1-2-3 Pattern Indicator for MetaTrader 4 Download - Free - [TFlab]](https://cdn.tradingfinder.com/image/272440/4-54-en-1-2-3-pattern-mt4-1.webp)
![1-2-3 Pattern Indicator for MetaTrader 4 Download - Free - [TFlab] 0](https://cdn.tradingfinder.com/image/272440/4-54-en-1-2-3-pattern-mt4-1.webp)
![1-2-3 Pattern Indicator for MetaTrader 4 Download - Free - [TFlab] 1](https://cdn.tradingfinder.com/image/272443/4-54-en-1-2-3-pattern-mt4-2.webp)
![1-2-3 Pattern Indicator for MetaTrader 4 Download - Free - [TFlab] 2](https://cdn.tradingfinder.com/image/272442/4-54-en-1-2-3-pattern-mt4-3.webp)
![1-2-3 Pattern Indicator for MetaTrader 4 Download - Free - [TFlab] 3](https://cdn.tradingfinder.com/image/272433/4-54-en-1-2-3-pattern-mt4-4.webp)
The 1-2-3 Pattern Indicator is one of the advanced tools in MetaTrader 4 indicators, used to identify reversal points.
This indicator detects three key pivots and plots them as ZigZag Lines, displaying the price movement trend and generating Fibonacci Levels based on the first two points.
1-2-3 Pattern Indicator Specifications Table
The table below presents the features of the 1-2-3 Pattern Indicator.
Indicator Categories: | Trading Assist MT4 Indicators Risk Management MT4 Indicators Levels MT4 Indicators |
Platforms: | MetaTrader 4 Indicators |
Trading Skills: | Intermediate |
Indicator Types: | Range MT4 Indicators |
Timeframe: | Multi-Timeframe MT4 Indicators |
Trading Style: | Intraday MT4 Indicators |
Trading Instruments: | Forward Market MT4 Indicators Stock Market MT4 Indicators Cryptocurrency MT4 Indicators Forex MT4 Indicators |
Indicator at a Glance
This indicator is used for trend analysis and for determining entry and exit points in a trade.
Once the Pattern is formed during price corrections, traders can use Fibonacci Levels to enter a position.
This method sets price targets based on Fibonacci levels, and the stop-loss is placed near the 0 Fibonacci level.
Indicator in an Uptrend
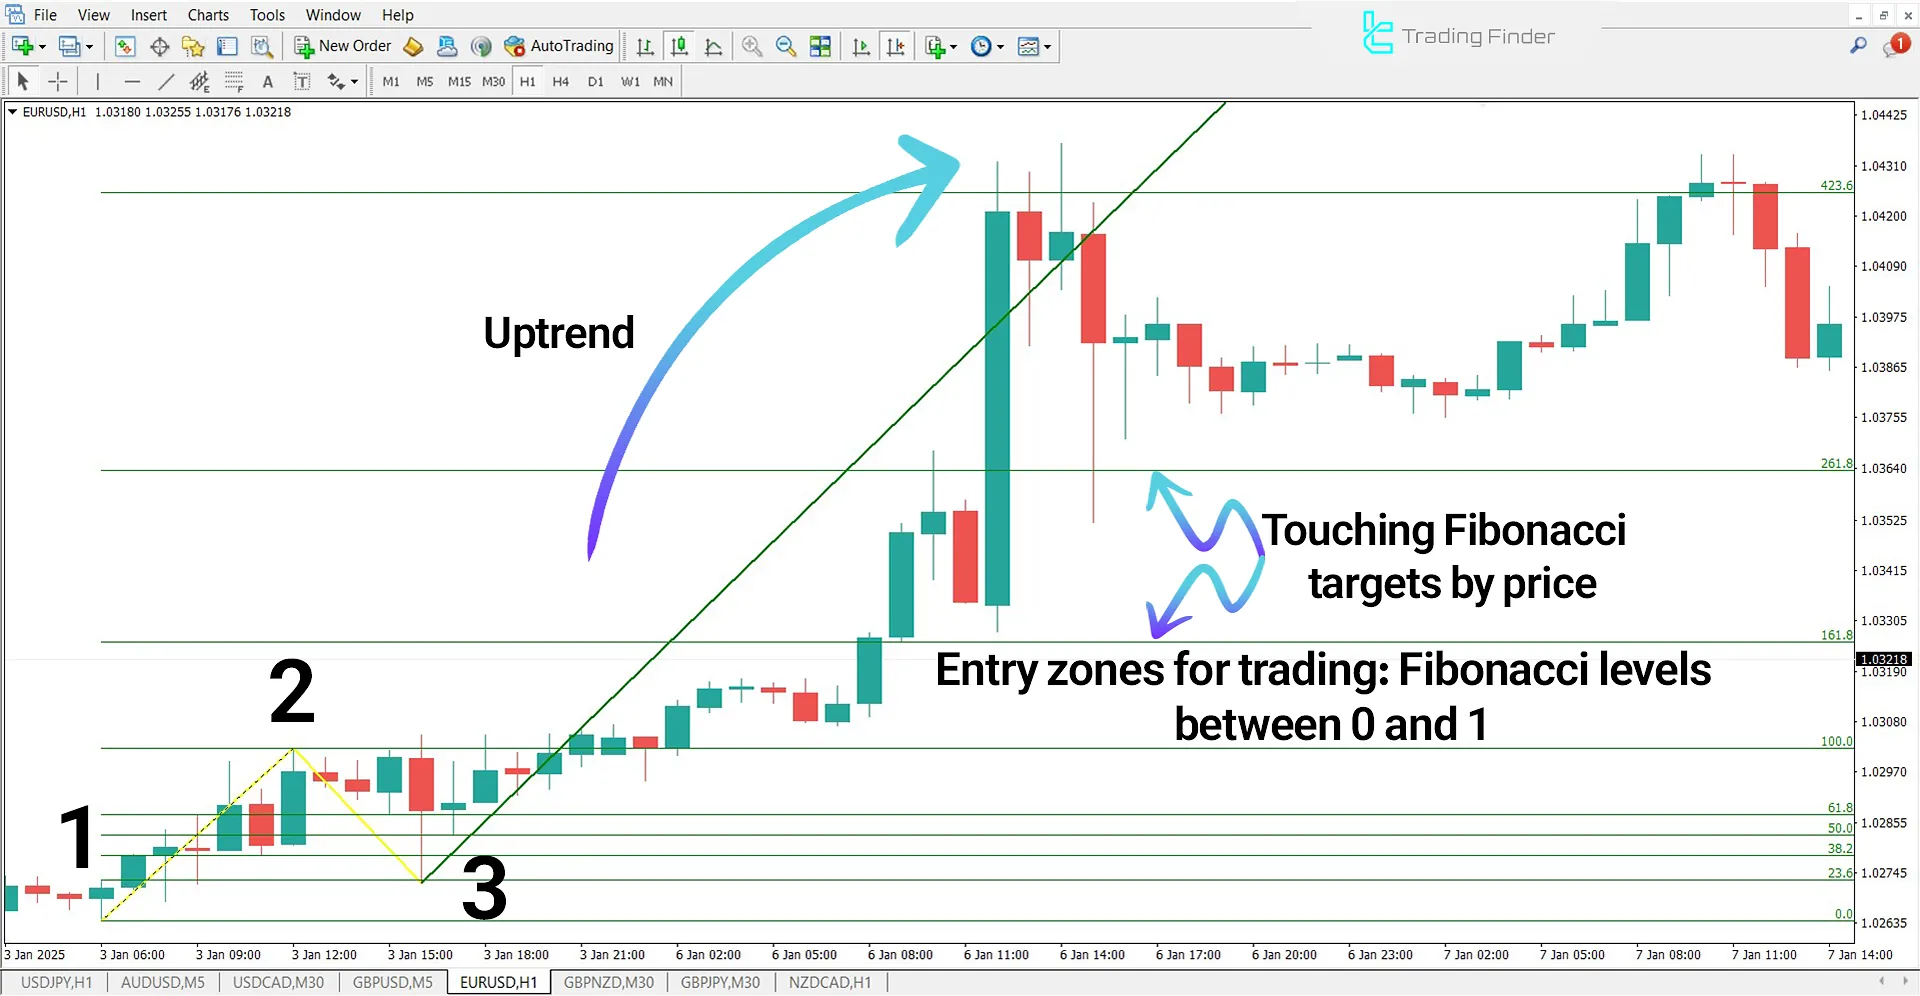
In analyzing the EUR/USD currency pair, key pivots are first identified based on the 1-2-3 Pattern.
Then, an ascending Fibonacci retracement is drawn between points 1 and 2, and traders enter positions in key areas specified by this tool.
Price targets are also set at levels above the Fibonacci 1 line, which serve as optimal exit points for trades.

Indicator in a Downtrend
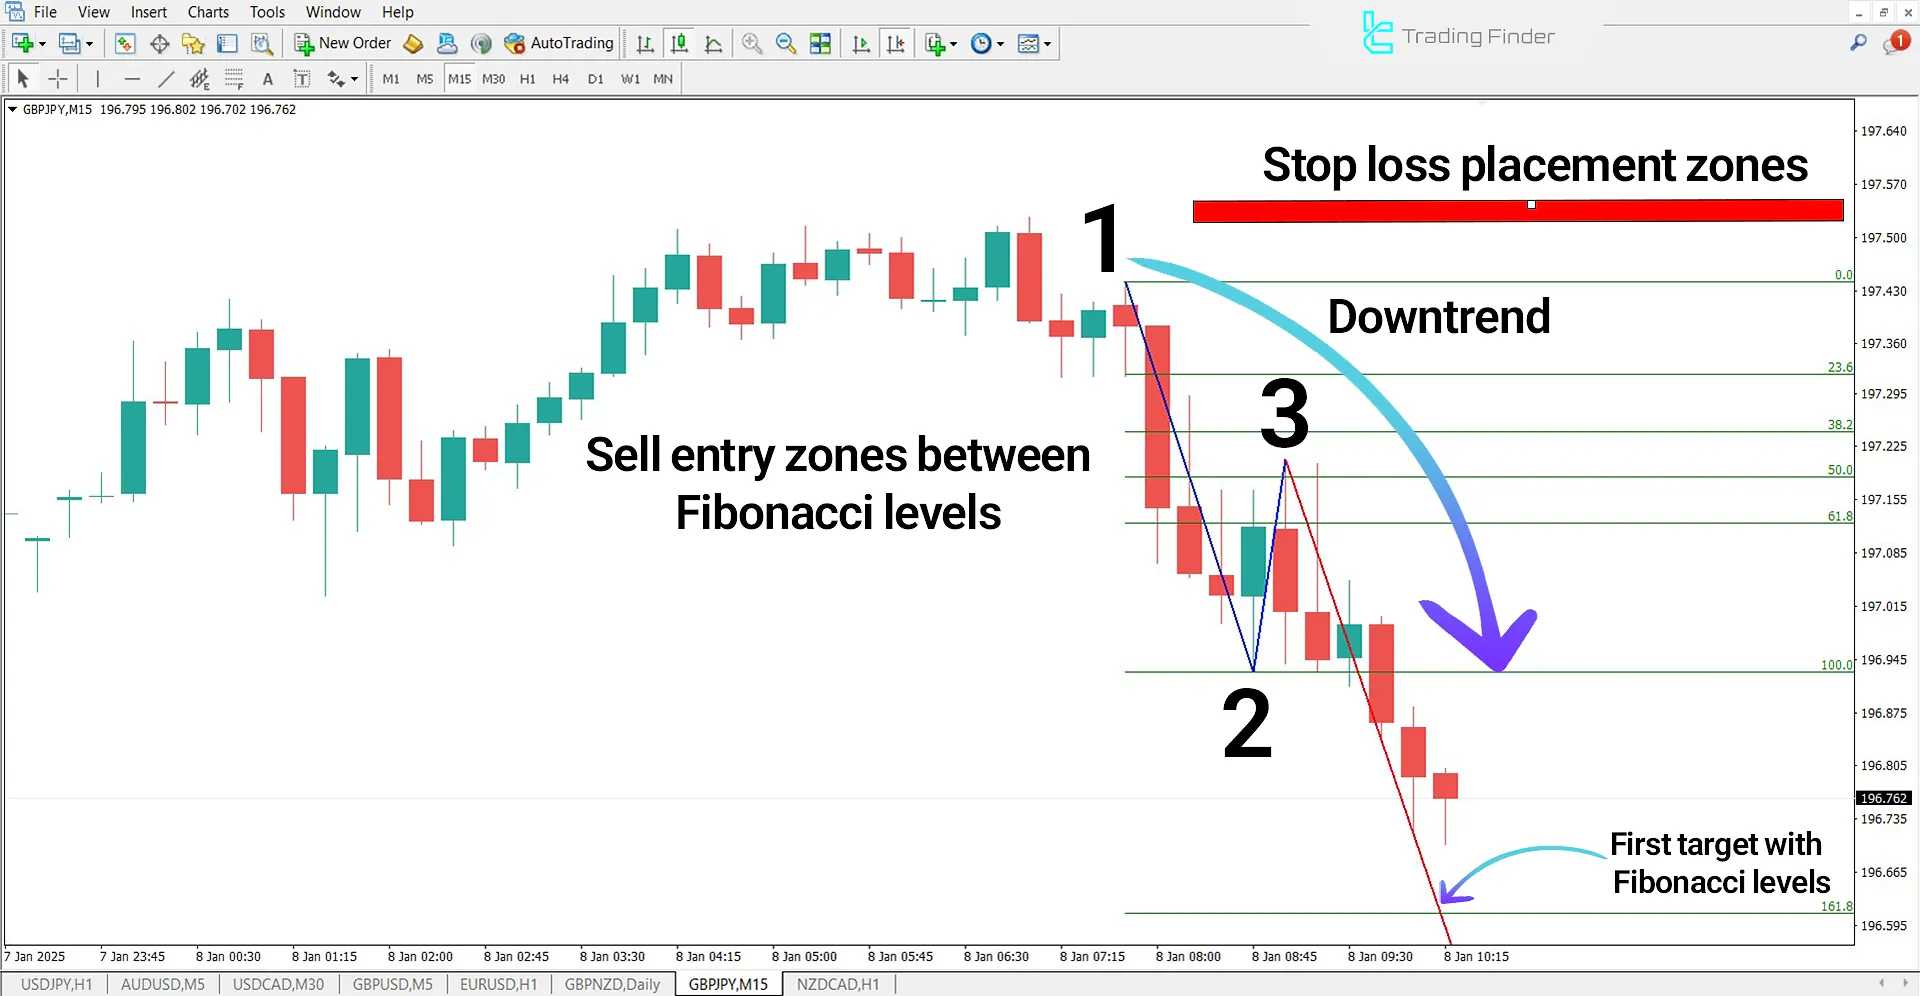
In a 15-minute timeframe analysis of the GBP/JPY currency pair, the indicator first identifies price pivots and then draws the Fibonacci retracement levels.
Analysts enter sell positions at Fibonacci levels 0 and 1, while price targets are set at Fibonacci levels. The stop-loss is also placed above the Fibonacci 0 level.

1-2-3 Pattern Indicator Settings
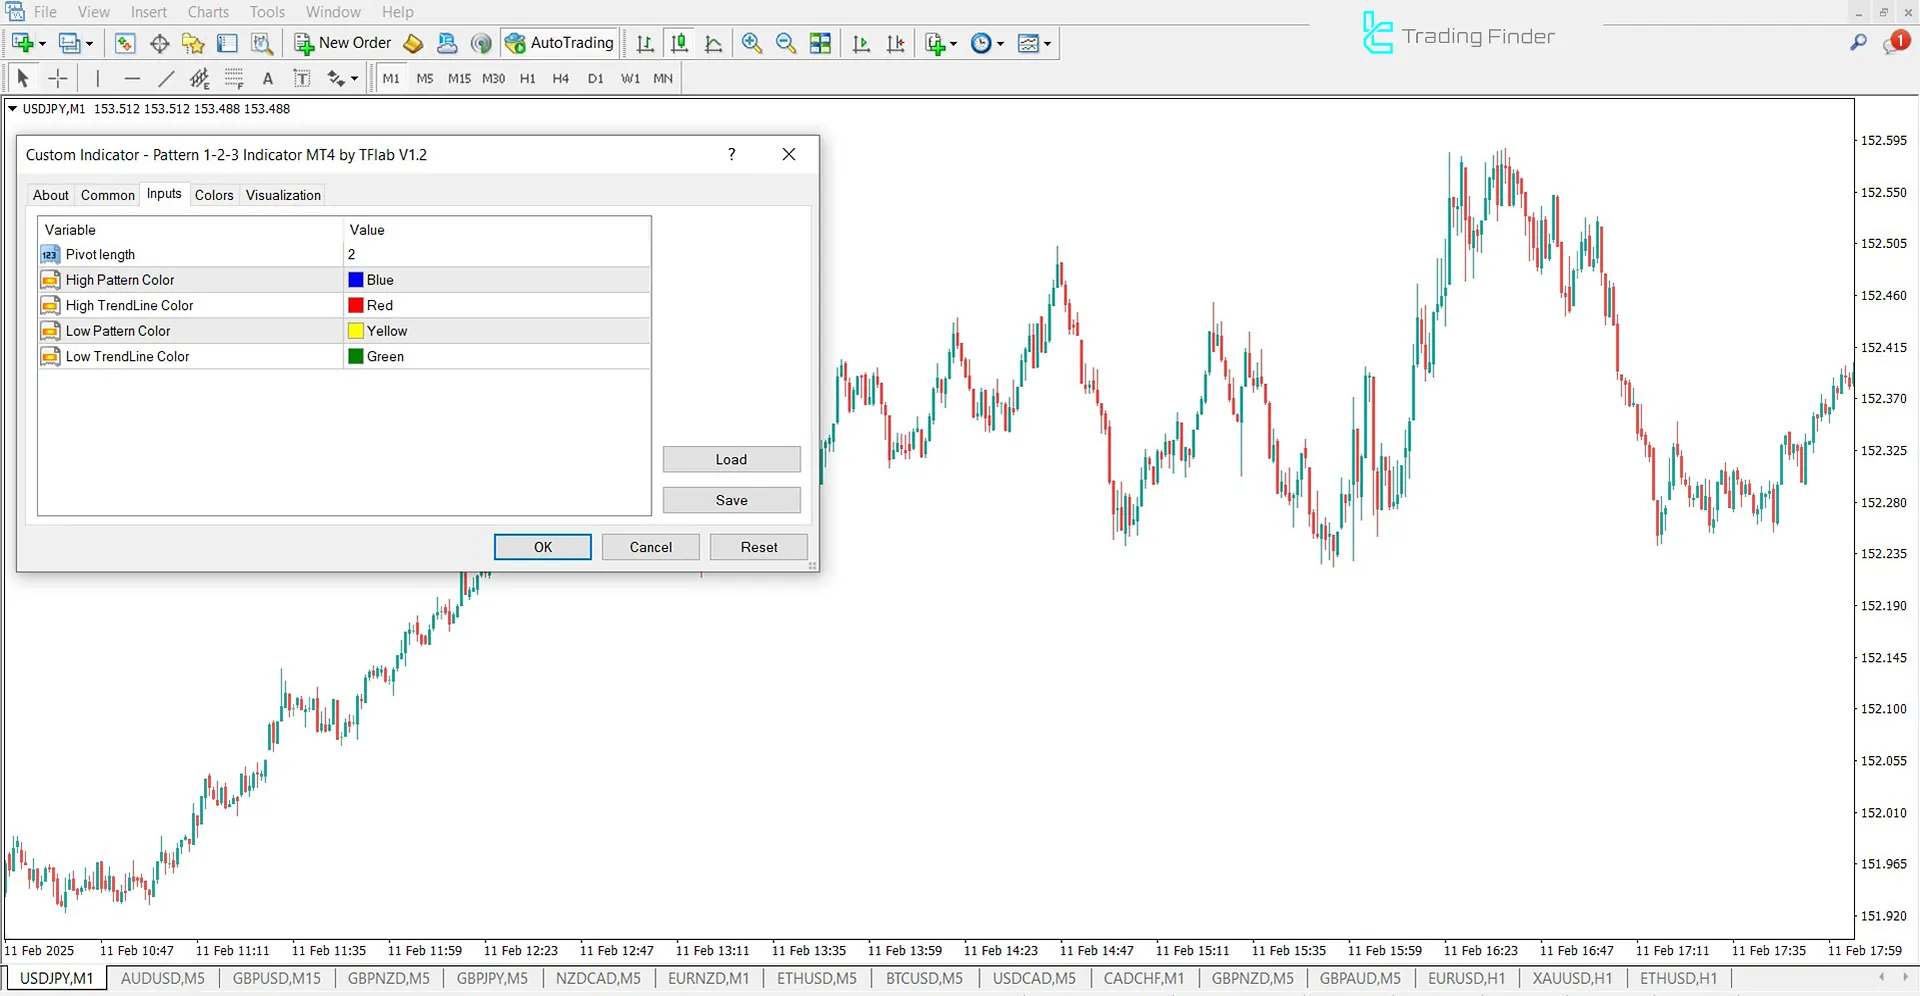
The settings of the indicator are fully displayed in the image below:

- Pivot Length: Length of pivots
- High Pattern Color: Color of the high Pattern
- High TrendLine Color: Color of the high trend line
- Low Pattern Color: Color of the low Pattern
- Low TrendLine Color: Color of the low trend line
Conclusion
In the 1-2-3 Pattern, traders enter positions near support or resistance areas, aligned with Fibonacci lines.
In this risk management MT4 indicator, price targets are set at levels above Fibonacci Level 1; these levels serve as optimal points for profit-taking in both uptrend and downtrend scenarios.
1-2-3 Pattern MT4 PDF
1-2-3 Pattern MT4 PDF
Click to download 1-2-3 Pattern MT4 PDFWhat is the 1-2-3 Pattern Indicator?
The 1-2-3 Pattern Indicator is a technical analysis tool in MetaTrader 4. It is used to identify reversal points in price charts and determine entry and exit zones for trades.
How to use the 1-2-3 Pattern Indicator?
This indicator identifies three key pivots on a chart and provides Fibonacci levels for trade entry and exit strategies.


