


![AI SuperTrend Clustering Oscillator for MT4 Download – Free – [TradingFinder]](https://cdn.tradingfinder.com/image/610451/13-252-en-ai-supertrend-clustering-oscillator-mt4-01.webp)
![AI SuperTrend Clustering Oscillator for MT4 Download – Free – [TradingFinder] 1](https://cdn.tradingfinder.com/image/610445/13-252-en-ai-supertrend-clustering-oscillator-mt4-02.webp)
![AI SuperTrend Clustering Oscillator for MT4 Download – Free – [TradingFinder] 2](https://cdn.tradingfinder.com/image/610448/13-252-en-ai-supertrend-clustering-oscillator-mt4-03.webp)
![AI SuperTrend Clustering Oscillator for MT4 Download – Free – [TradingFinder] 3](https://cdn.tradingfinder.com/image/610447/13-252-en-ai-supertrend-clustering-oscillator-mt4-04.webp)
The AI SuperTrend Clustering Oscillator is developed based on the K-Means clustering algorithm and SuperTrend logic.
This indicator calculates the deviation between the price and several SuperTrend variations, classifying the data into three statistical clusters: bullish, bearish, and consensus.
The output of each cluster is displayed as a colored area within the oscillator.
Specification Table of AI SuperTrend Clustering Oscillator
The specifications of the AI SuperTrend Clustering Oscillator are as follows.
Indicator Categories: | Signal & Forecast MT4 Indicators Machine Learning Indicators for MetaTrader 4 AI Indicators for MetaTrader 4 |
Platforms: | MetaTrader 4 Indicators |
Trading Skills: | Elementary |
Indicator Types: | Reversal MT4 Indicators |
Timeframe: | Multi-Timeframe MT4 Indicators |
Trading Style: | Day Trading MT4 Indicators Scalper MT4 Indicators Swing Trading MT4 Indicators |
Trading Instruments: | Stock Market MT4 Indicators Cryptocurrency MT4 Indicators Forex MT4 Indicators |
AI SuperTrend Clustering Oscillator at a Glance
At the lower part of the chart, the AI SuperTrend Clustering Oscillator produces three types of outputs that help identify the current trend, movement strength, and potential price reversals:
- Consensus Output: The central gray line defines the overall market direction;
- Bullish Output: Upward crossing of the oscillator line above the midline, forming blue-colored areas and dots;
- Bearish Output: Oscillation of the line below the midline accompanied by the appearance of red-colored areas and dots.
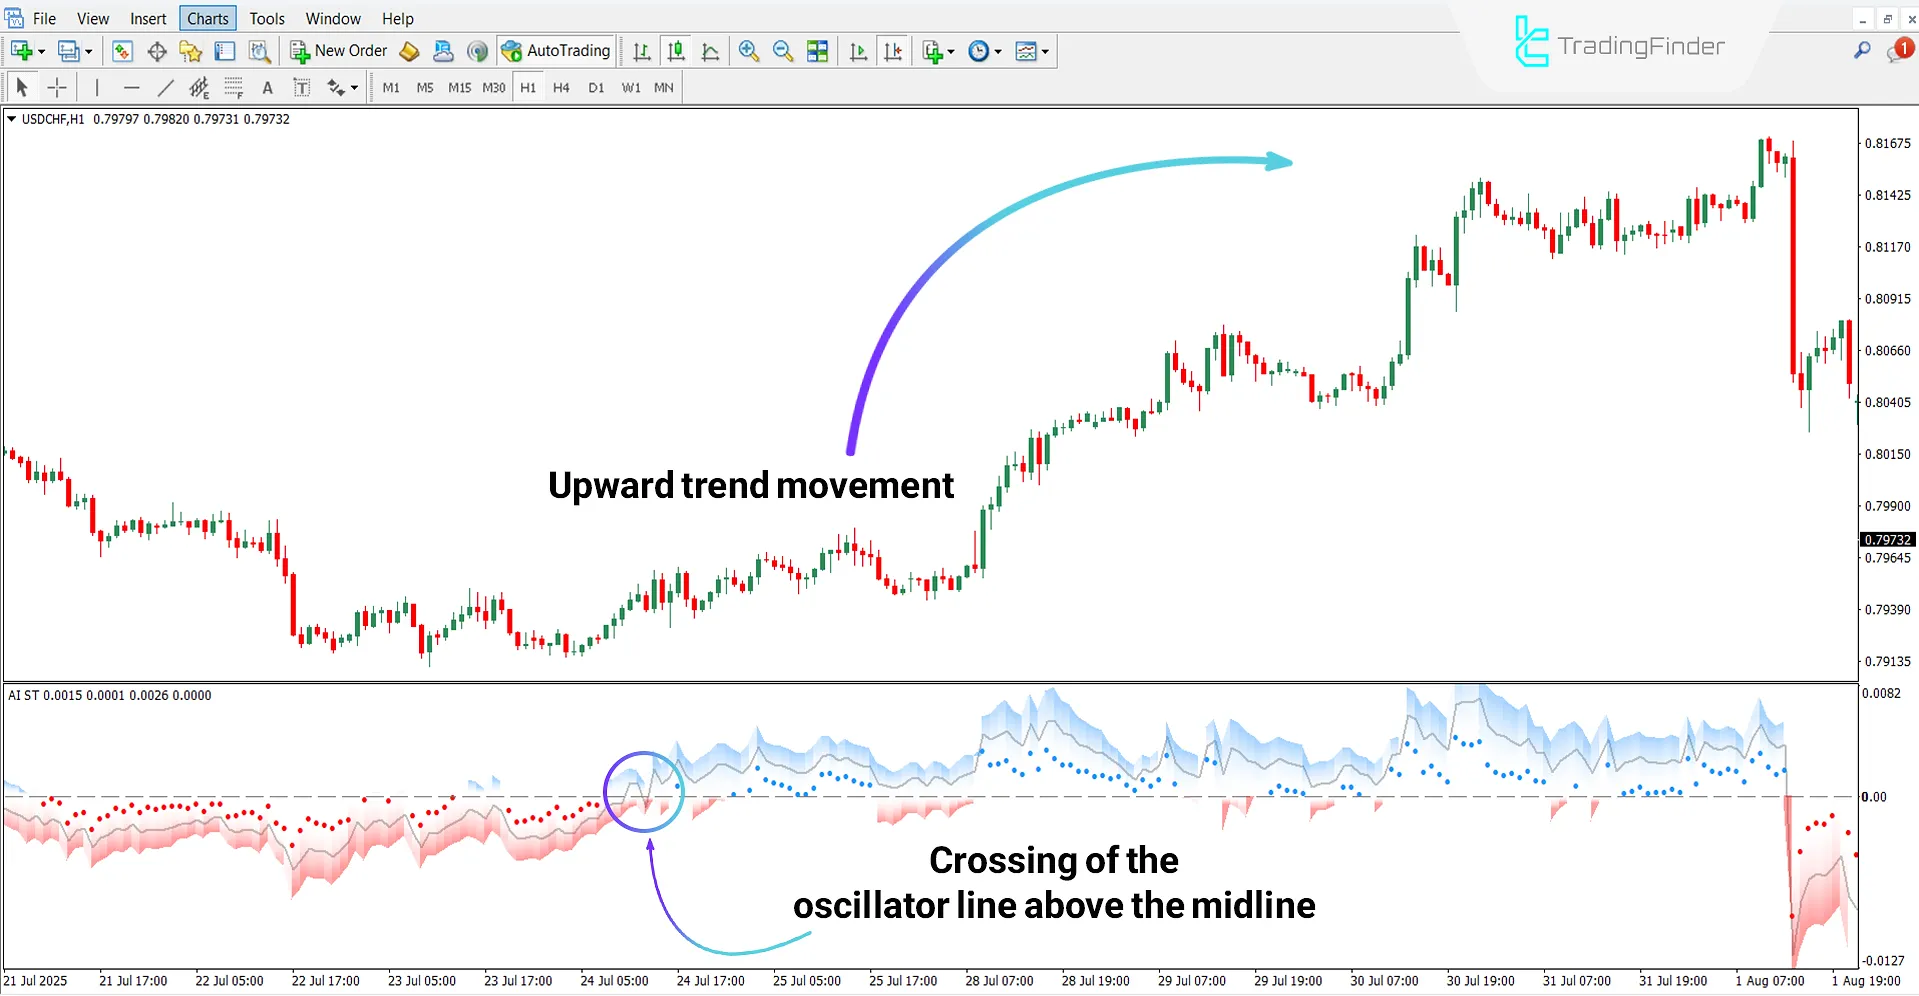
Bullish Trend
Based on the 1-hour chart of the US Dollar vs Swiss Franc (USD/CHF), once the oscillator line crosses above the midline, a blue area forms, indicating the beginning of a stable bullish trend.
As this condition stabilizes, candlesticks gain momentum, and a bullish movement structure emerges on the main chart.
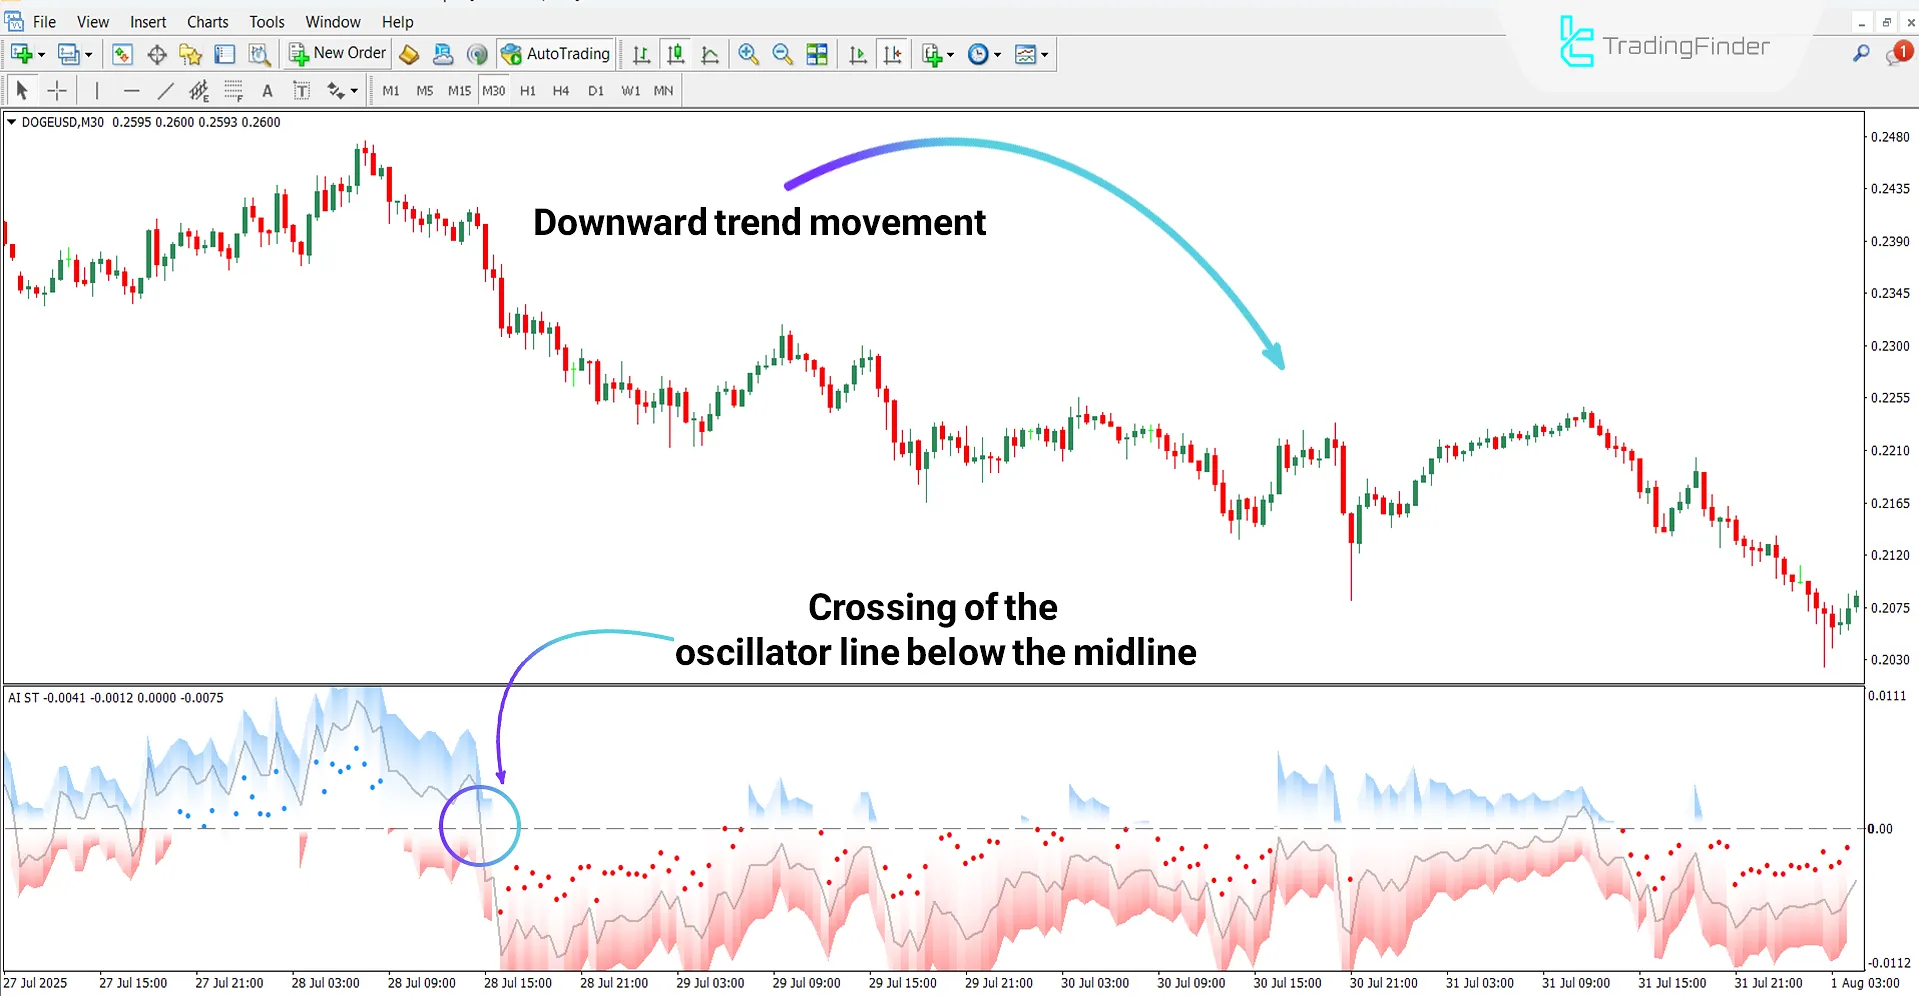
Bearish Trend
According to the 30-minute chart of Dogecoin (DOGE) cryptocurrency, the oscillator line’s movement below the midline and the expansion of the red area at the bottom indicate the formation of a bearish trend.
Following this shift, candles consecutively close lower, and selling pressure increases in the price structure.
Settings of AI SuperTrend Clustering Oscillator
The settings panel of the AI SuperTrend Clustering Oscillator includes the following parameters:
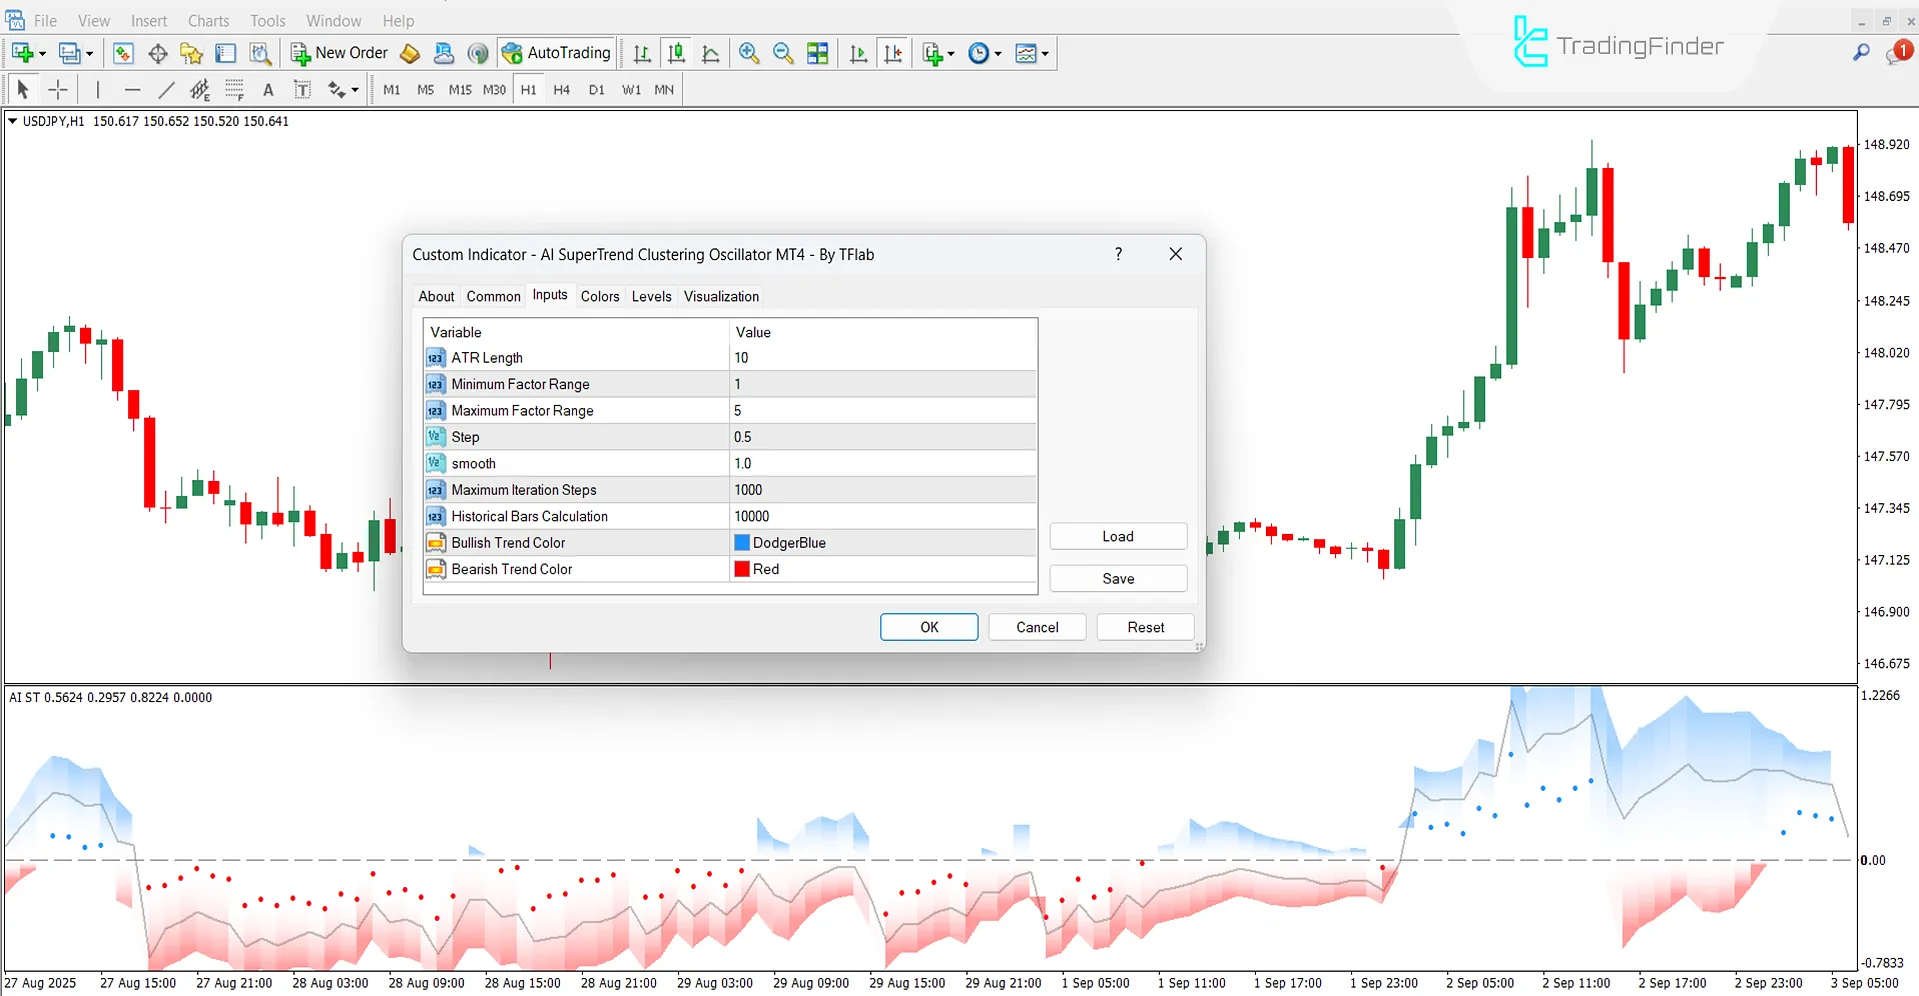
- ATR Length: Number of periods for calculating the Average True Range;
- Minimum Factor Range: Minimum coefficient value for calculating SuperTrend lines.
- Maximum Factor Range: Maximum coefficient value for determining SuperTrend ranges.
- Step: Incremental step size between the minimum and maximum factors.
- Smooth: Degree of smoothing applied to the indicator output to reduce signal noise.
- Maximum Iteration Steps: Maximum number of clustering algorithm iterations to find cluster centers.
- Historical Bars Calculation: Number of historical candlesticks used in indicator calculations.
- Bullish Trend Color: Color assigned to display bullish zones.
- Bearish Trend Color: Color assigned to display bearish zones.
Conclusion
The AI SuperTrend Clustering Oscillator combines the logic of SuperTrend with the K-Means clustering algorithm, unveiling the true structure of the trend through multidimensional price behavior analysis.
By using Average True Range (ATR) data, it measures market volatility and dynamically adjusts bullish and bearish zones accordingly.
Therefore, unlike classic SuperTrend versions, this indicator can quickly detect trend reversals, corrective phases, and potential price reversal areas.
AI SuperTrend Clustering Oscillator for MT4 PDF
AI SuperTrend Clustering Oscillator for MT4 PDF
Click to download AI SuperTrend Clustering Oscillator for MT4 PDFWhat does the blue color represent in the oscillator?
The blue color in the AI SuperTrend Clustering Oscillator represents bullish zones and strengthening phases in the market trend.
What is the role of ATR in this indicator?
The Average True Range (ATR) measures market volatility.


