![All Pivot Points Indicator for MT4 Download - Free - [TradingFinder]](https://cdn.tradingfinder.com/image/296472/13-92-en-all-pivot-points-mt4-01.webp)
![All Pivot Points Indicator for MT4 Download - Free - [TradingFinder] 0](https://cdn.tradingfinder.com/image/296472/13-92-en-all-pivot-points-mt4-01.webp)
![All Pivot Points Indicator for MT4 Download - Free - [TradingFinder] 1](https://cdn.tradingfinder.com/image/296462/13-92-en-all-pivot-points-mt4-02.webp)
![All Pivot Points Indicator for MT4 Download - Free - [TradingFinder] 2](https://cdn.tradingfinder.com/image/296471/13-92-en-all-pivot-points-mt4-03.webp)
![All Pivot Points Indicator for MT4 Download - Free - [TradingFinder] 3](https://cdn.tradingfinder.com/image/296474/13-92-en-all-pivot-points-mt4-04.webp)
The All Pivot Points Indicator calculates four types of pivot points using historical price data: Open Price, High, and Close Price.
This MT4 fractal pivot point indicator displays six horizontal levels (in classic mode) on the chart, which act as support and resistance levels in technical analysis basically.
All Pivot Points Indicator Specifications Table
The specifications of the All Pivot Points Indicator are shown in the table below:
Indicator Categories: | Pivot Points & Fractals MT4 Indicators Support & Resistance MT4 Indicators Levels MT4 Indicators |
Platforms: | MetaTrader 4 Indicators |
Trading Skills: | Intermediate |
Indicator Types: | Breakout MT4 Indicators Reversal MT4 Indicators |
Timeframe: | Multi-Timeframe MT4 Indicators |
Trading Style: | Day Trading MT4 Indicators Scalper MT4 Indicators |
Trading Instruments: | Forward Market MT4 Indicators Stock Market MT4 Indicators Cryptocurrency MT4 Indicators Forex MT4 Indicators |
Overview of the All Pivot Points Indicator
The All Pivot Points Indicator offers four different types of pivot points, which can be modified in the settings:
- Classic: Uses the previous day's Open, Close, High, and Low to draw a main pivot point (PP), three support levels (S1-S3), and three resistance levels (R1-R3)
- Camarilla: Based on the previous day's closing price, it provides closer support and resistance levels than the classic type
- Woodie: Ignores the opening price and provides only two support and resistance levels
- Fibonacci: Uses key Fibonacci ratios (38.2%, 61.8%, and 100%) to draw levels
Analyzing the All Pivot Points Indicator in an Uptrend
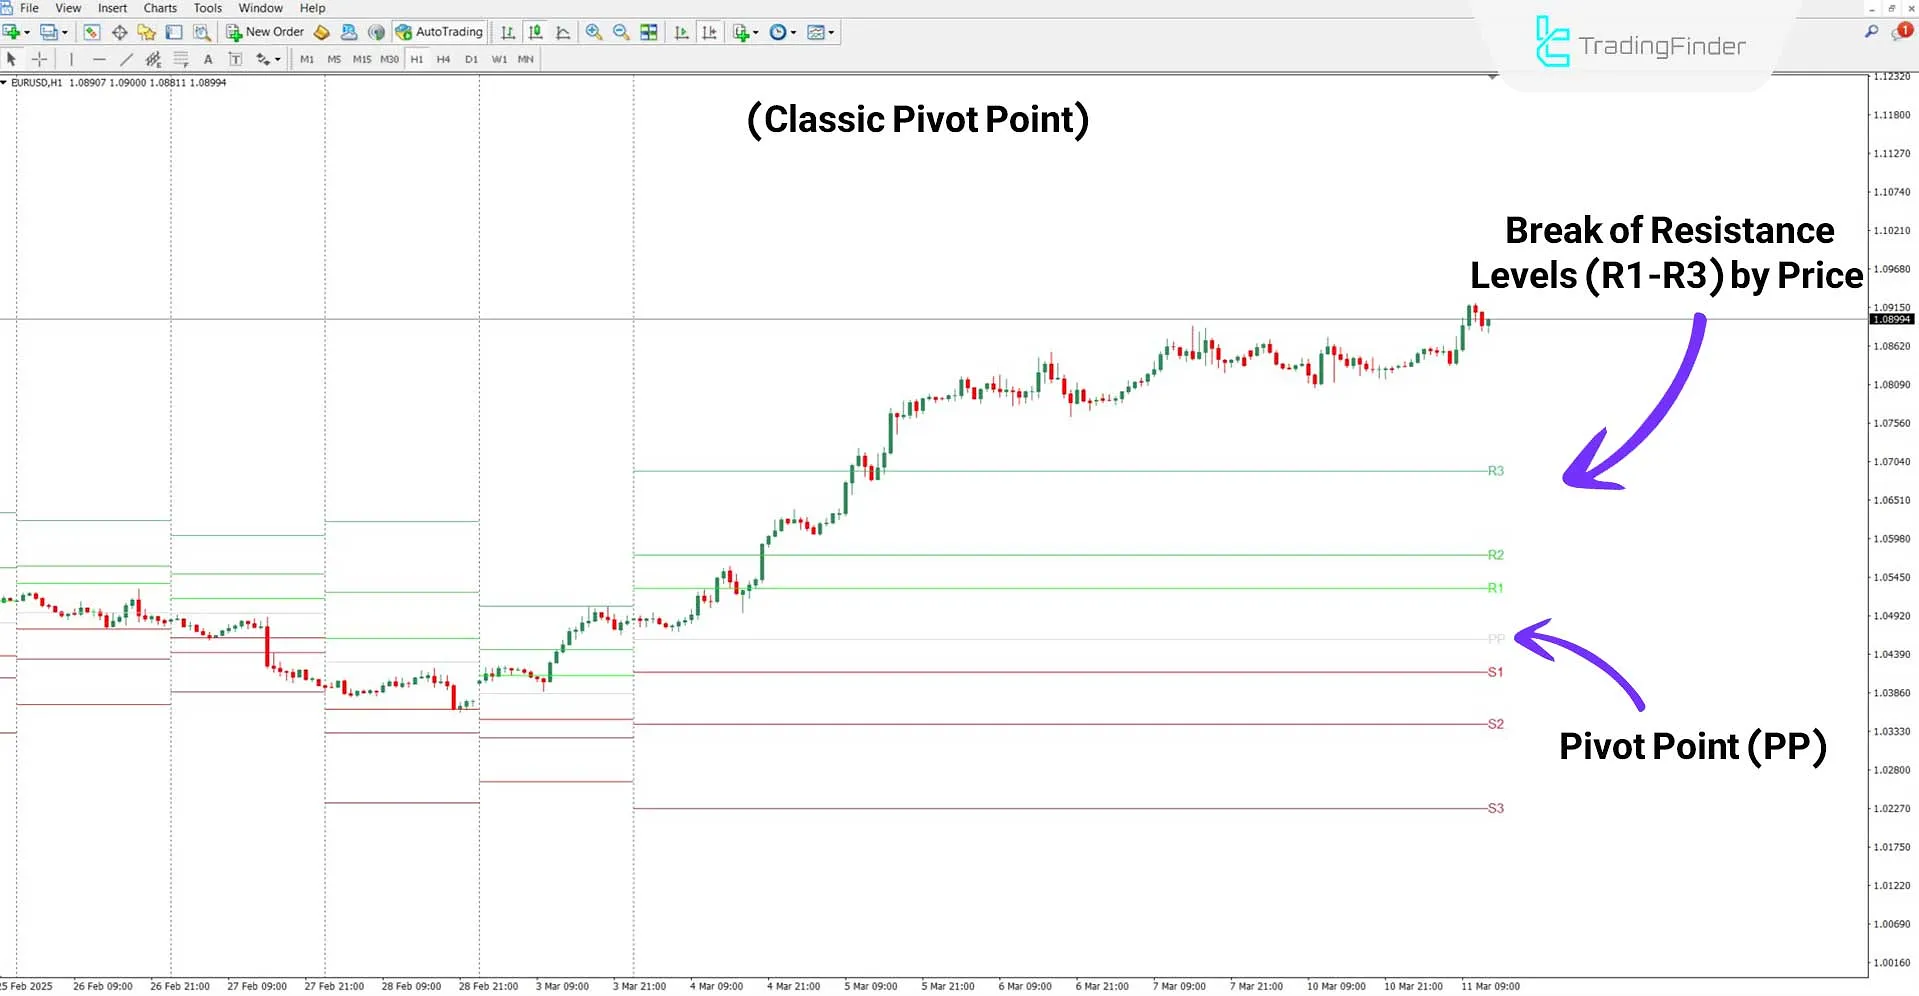
The EUR/USD currency pair chart displays three support levels (red) and three resistance levels (green).
As shown in the image below, the price successfully breaks through resistance levels after crossing the main pivot level (PP), indicating a strong uptrend.

Analyzing the All Pivot Points Indicator in a Downtrend
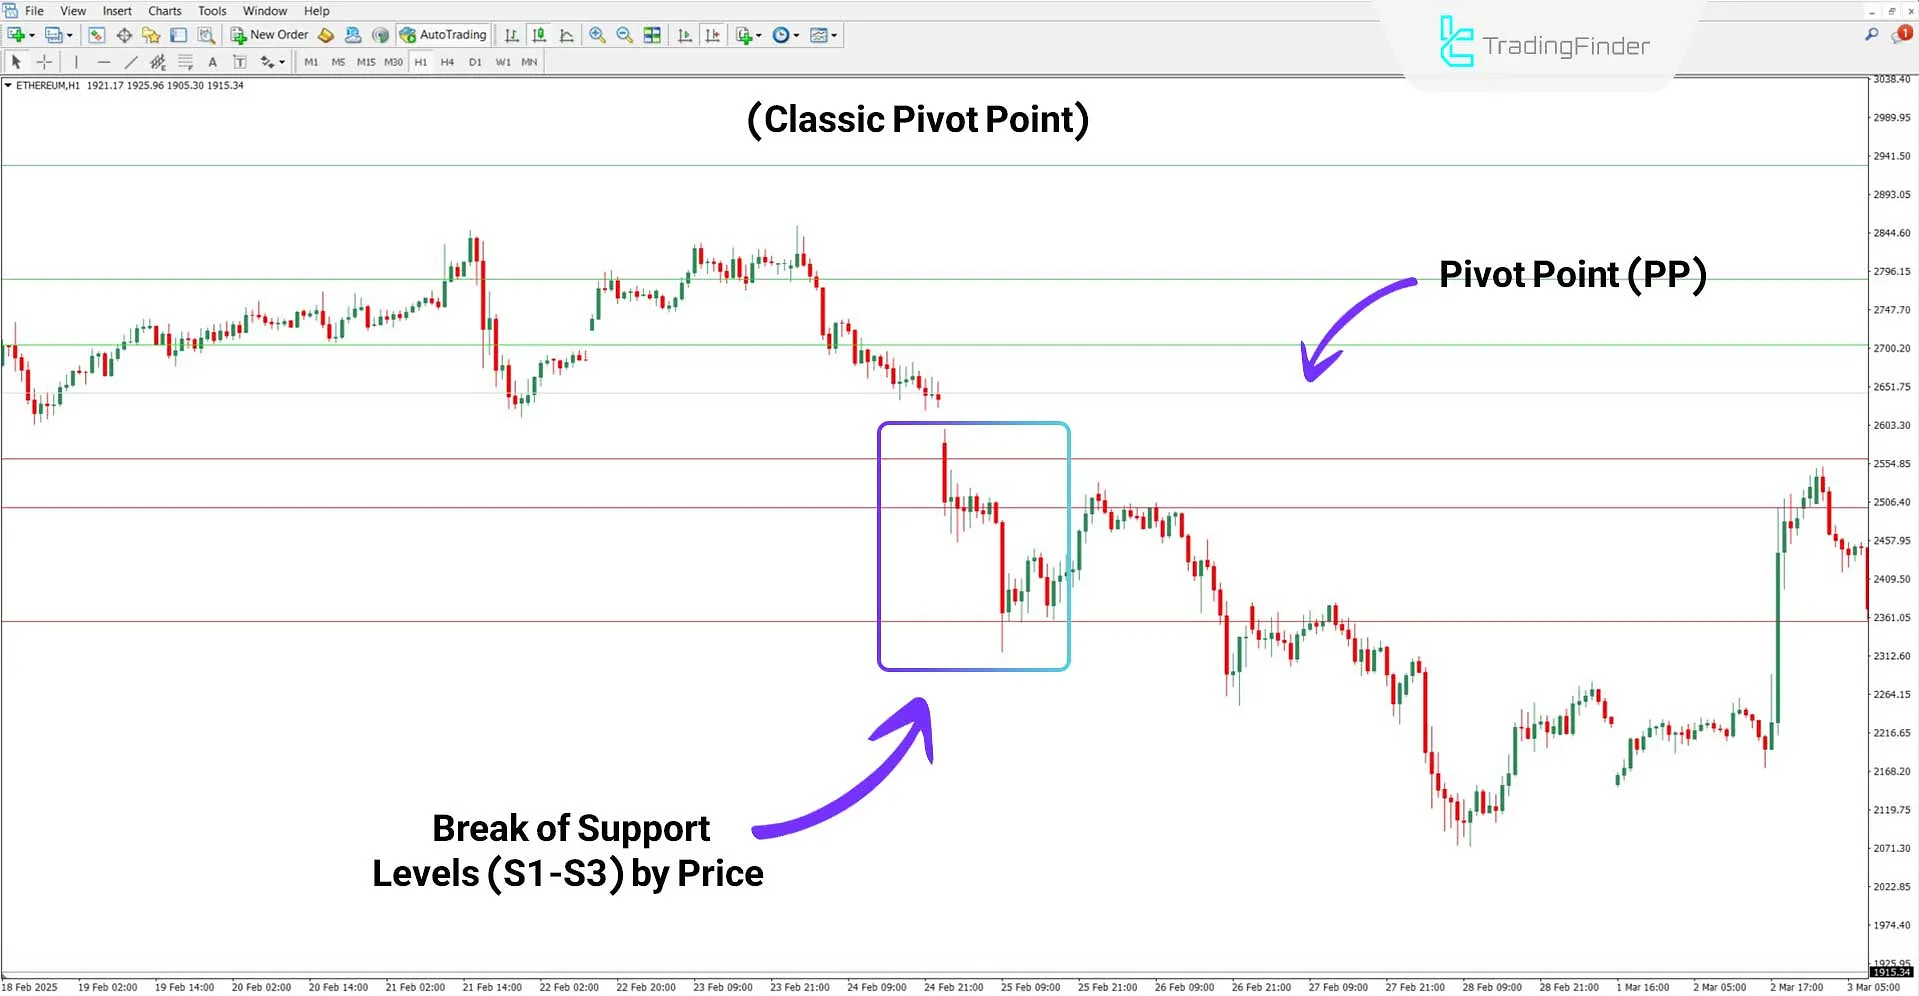
According to the Ethereum (ETH) chart in the 1-hour time frame, the price moves past the main pivot level (PP) and breaks support levels (S1, S2, S3).
Price pullbacks present good entry opportunities for sell trades in such conditions. In contrast, resistance levels act as stop-loss zones.

Settings of the All Pivot Points Indicator
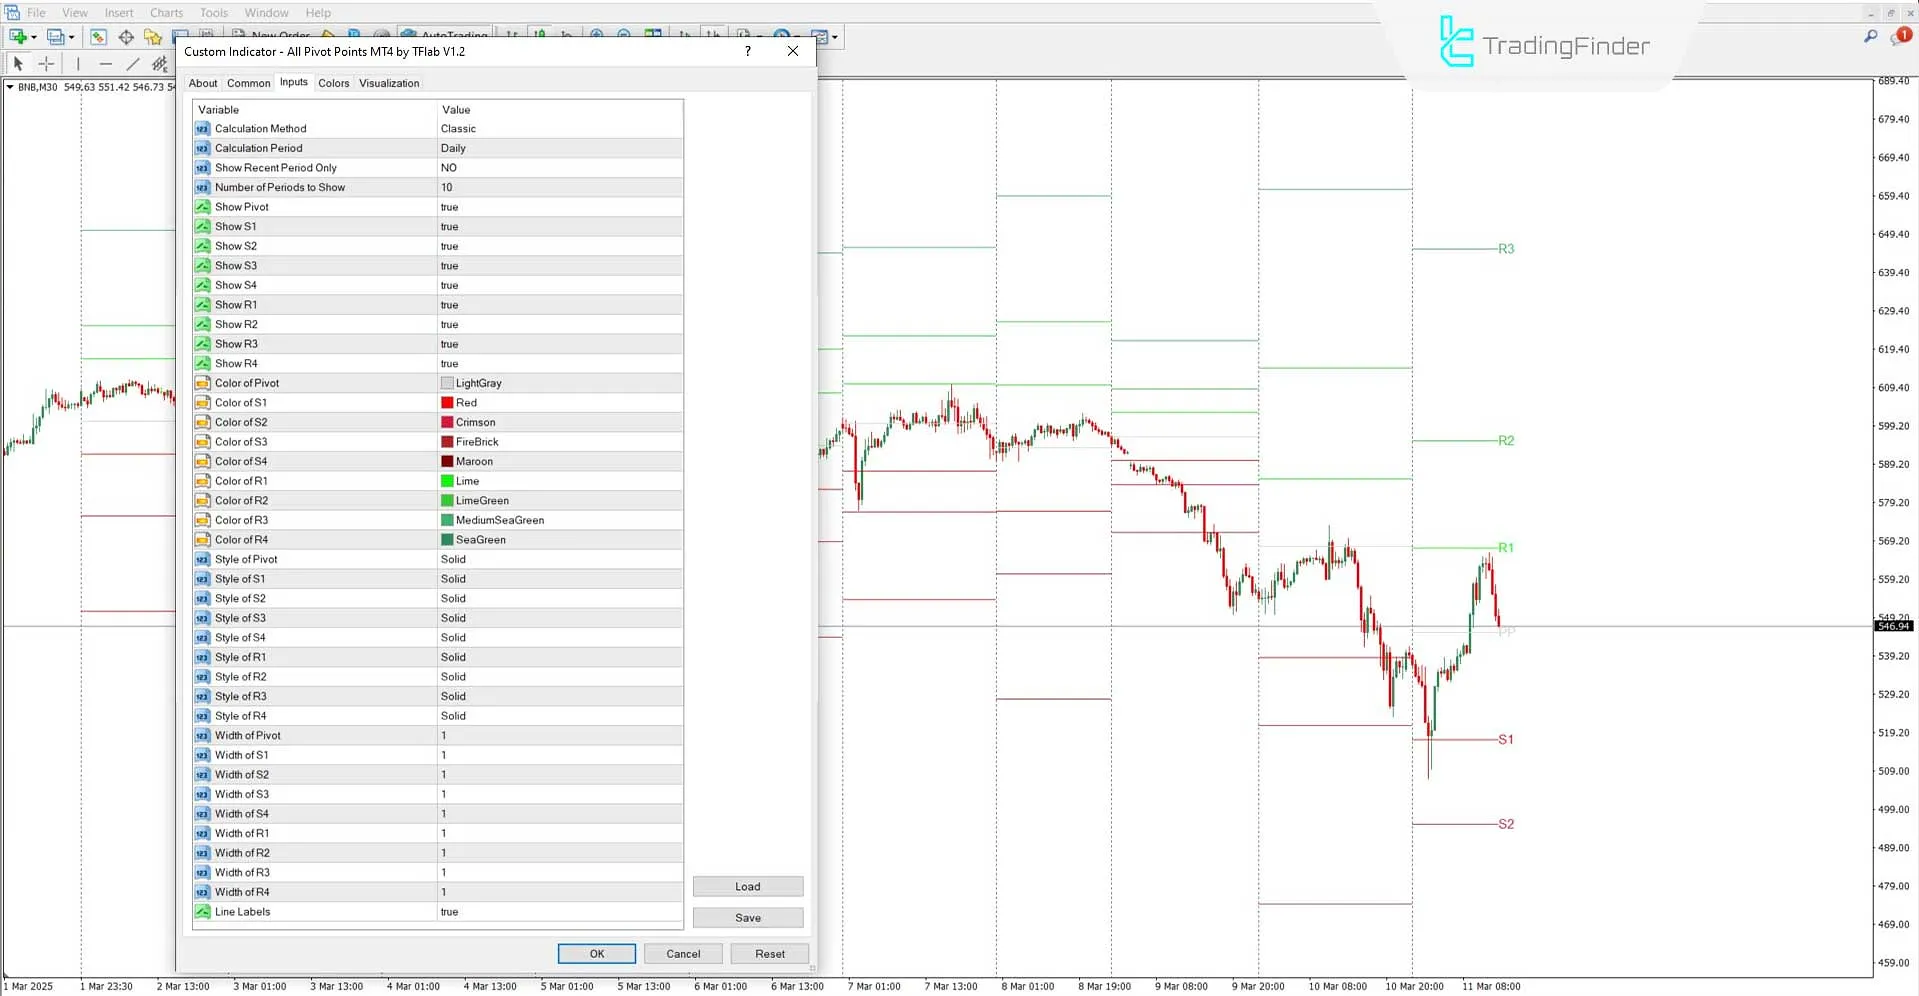
The image below displays the settings panel of the All Pivot Points Indicator:

- Calculation Method: Determines the type of pivot point calculation
- Calculation Period: Defines the period for pivot calculations
- Number of Periods: Sets the number of past periods for pivot calculations
- Show Mid Pivots: Enables or disables mid-pivot levels between the main lines
- Show Pivot: Activates the display of the main pivot point
- Show levels (S1, S2, S3, S4): Enables support levels
- Show levels (R1, R2, R3, R4): Enables resistance levels
- Color of Pivot: Sets the color of the main pivot level
- Color of (S1, S2, S3, S4): Defines the colors of support levels
- Color of (R1, R2, R3, R4): Defines the colors of resistance levels
- Style of Pivot: Adjusts the visual style of the main pivot point
- Style of (S1, S2, S3, S4): Modifies the visual appearance of support levels
- Style of (R1, R2, R3, R4): Modifies the visual appearance of resistance levels
- Width of Pivot: Sets the thickness of the main pivot line
- Width of (S1, S2, S3, S4): Adjusts the thickness of support levels
- Width of (R1, R2, R3, R4): Adjusts the thickness of resistance levels
- Line labels: Enables label display
Note: The All Pivot Points Indicator has been reviewed using default settings and the classic pivot type.
Conclusion
The All Pivot Points Indicator is one of the MT4 level indicators. It defines daily and weekly support and resistance levels and highlights breakout levels.
This trading tool flexible settings panel allows users to customize the time frame and pivot point type, making it highly adaptable.
All Pivot Points MT4 PDF
All Pivot Points MT4 PDF
Click to download All Pivot Points MT4 PDFDoes this indicator generate entry and exit signals?
No, the All Pivot Points Indicator does not generate trading signals.
Can this indicator be used in the stock market?
This indicator is highly flexible and can be used in all markets, including stocks, forex, and commodities.


