![Auto Fibo Indicator for MT4 Download - Free - [TradingFinder]](https://cdn.tradingfinder.com/image/169002/13-8-en-autofibo-mt4-1.webp)
![Auto Fibo Indicator for MT4 Download - Free - [TradingFinder] 0](https://cdn.tradingfinder.com/image/169002/13-8-en-autofibo-mt4-1.webp)
![Auto Fibo Indicator for MT4 Download - Free - [TradingFinder] 1](https://cdn.tradingfinder.com/image/169003/13-8-en-autofibo-mt4-2.webp)
![Auto Fibo Indicator for MT4 Download - Free - [TradingFinder] 2](https://cdn.tradingfinder.com/image/169005/13-8-en-autofibo-mt4-3.webp)
![Auto Fibo Indicator for MT4 Download - Free - [TradingFinder] 3](https://cdn.tradingfinder.com/image/169004/13-8-en-autofibo-mt4-4.webp)
Fibo ratios, such as 23.6%, 38.2%, 50%, 61.8%, and 76.4%, are widely used in technical analysis. These ratios are derived from the Fibonacci sequence, and help identify price retracement levels.
Typically, traders manually determine the ratio on the chart. The Auto Fibonacci indicator is one of the MetaTrader 4 indicators and automatically plots the Fibonacci retracement on the chart.
Specifications Table for Automatic Fibonacci Indicator
Indicator Categories: | Support & Resistance MT4 Indicators Trading Assist MT4 Indicators Levels MT4 Indicators |
Platforms: | MetaTrader 4 Indicators |
Trading Skills: | Intermediate |
Indicator Types: | Reversal MT4 Indicators |
Timeframe: | Multi-Timeframe MT4 Indicators |
Trading Style: | Day Trading MT4 Indicators |
Trading Instruments: | Share Stocks MT4 Indicators Forward Market MT4 Indicators Indices Market MT4 Indicators Commodity Market MT4 Indicators Stock Market MT4 Indicators Cryptocurrency MT4 Indicators Forex MT4 Indicators |
Auto Fibo Indicator Overview
This indicator automatically identifies high and low points and draws Fibonacci levels accordingly. Using the Auto Fibonacci Indicator, traders can identify key support and resistance levels and optimize their trading strategies themselves.
Automatic Fibonacci Indicator in an Uptrend
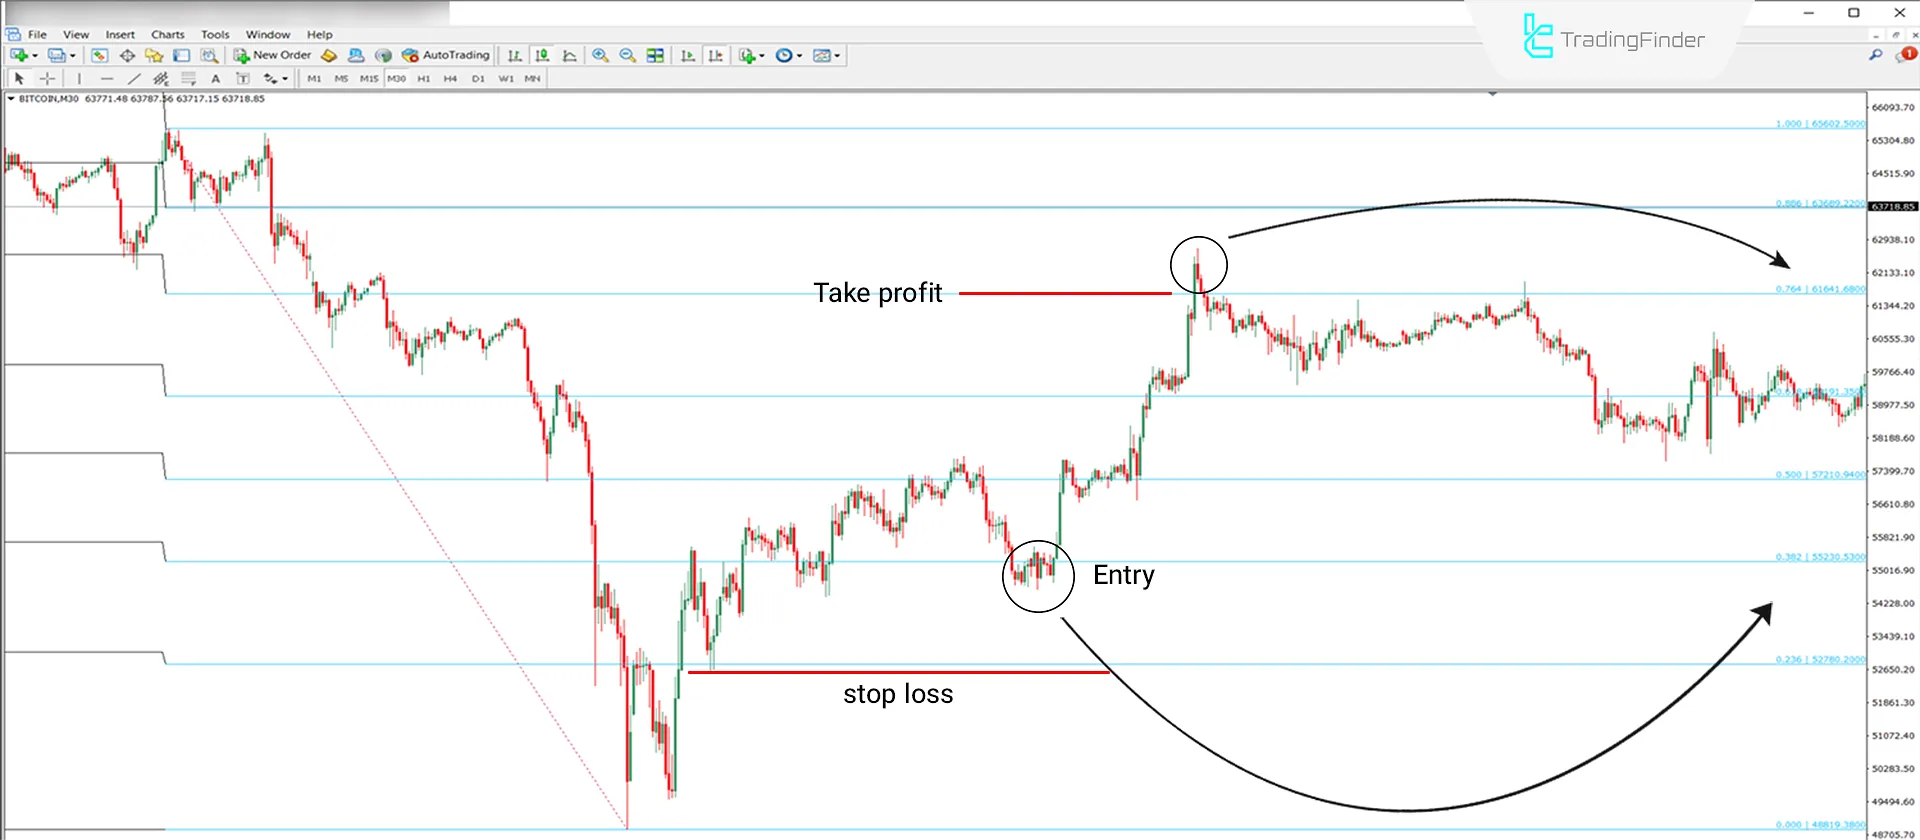
The 30-minute Bitcoin (BTC) price chart shows the uptrend condition in theAuto Fibonacci Indicator. This indicator automatically identifies the highest and lowest low and plots the Fibonacci levels.
In an uptrend, the Auto Fibonacci Indicator considers zero at the bottom and one hundred at the top. Fibonacci levels below 23.6% and 38.2% in an uptrend can be good entry points for long trades.
In such a trading situation, one can Place a Stop Loss below the recent support levels. Set the Take Profit at higher resistance levels, such as 61.8% or 76.4%.

Automatic Fibonacci Indicator in a Downtrend
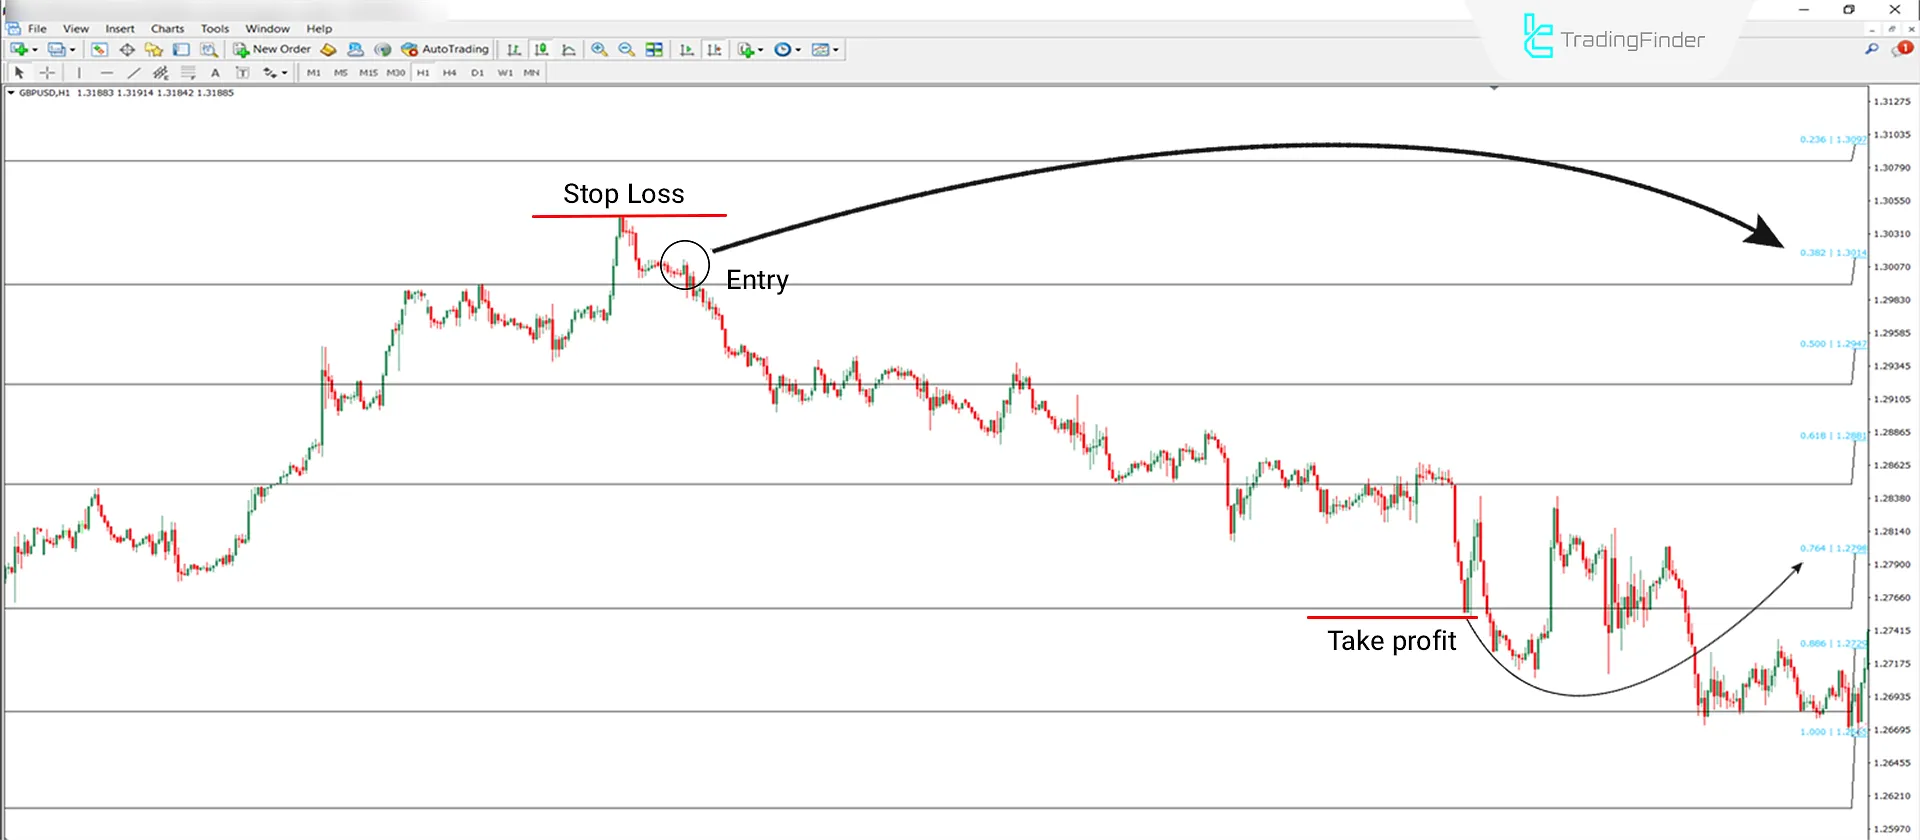
The 1-hour price chart of the GBP/USD currency pair shows the downtrend condition in theAuto Fibonacci Indicator. This indicator automatically identifies the highest and lowest low and plots the Fibonacci levels.
In adowntrend, the Auto Fibonacci Indicator considers zero at the top and one hundred at the bottom. In a downtrend, Fibonacci levels above 23.6% and 38.2% can be good entry points for sell trades. In such a trading situation, one can Place a Stop Loss above the recent resistance levels.
Set theTake Profit below the lowest support line, such as 61.8% or 76.4%.

Settings

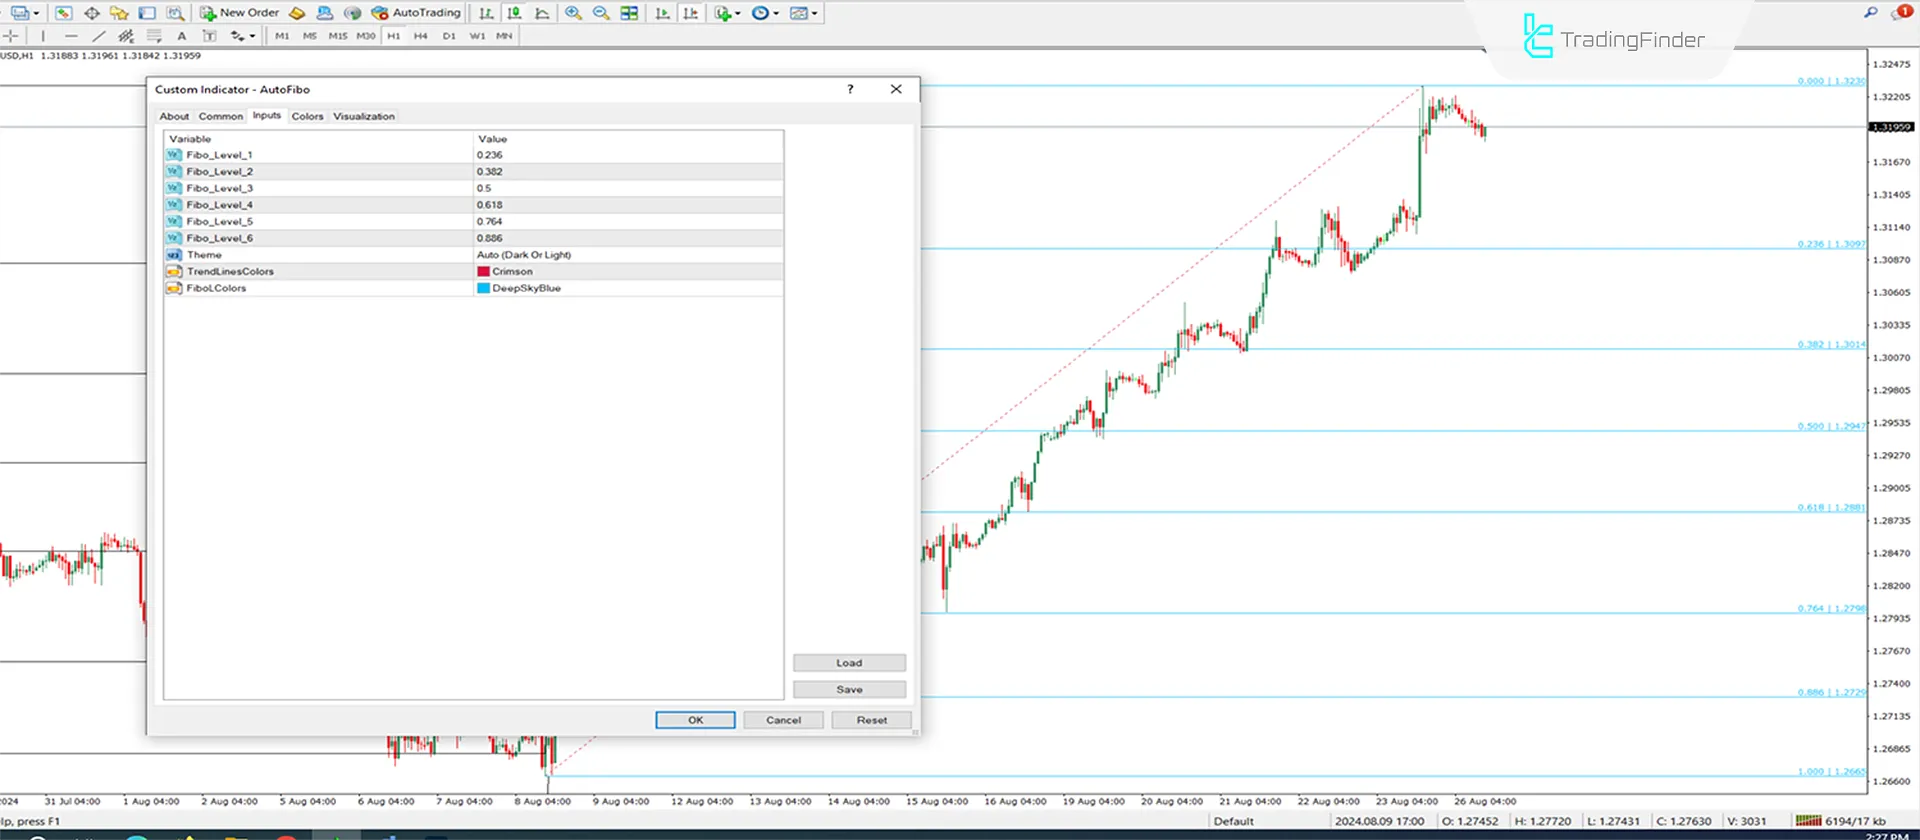
- CB Auto Fibo _ level _ 1: Fibonacci level set at 0.236;
- CB Auto Fibo _ level _ 2: Fibonacci level set at 0.382;
- CB Auto Fibo _ level _ 3: Fibonacci level set at 0.5;
- CB Auto Fibo _ level _4: Fibonacci level set at 0.618;
- CB Auto Fibo _ level _ 5: Fibonacci level set at 0.764;
- CB Auto Fibo _ level _ 6: Fibonacci level set at 0.886;
- Theme: Allows changing the background color;
- Trend Lines Colors: Settings are used to change the trend line colors;
- FiboL Colors: Settings for changing Fibonacci line colors.
Conclusion
The Auto Fibonacci indicator, as one of the MT4 levels indicators, helps traders analyze price charts by reducing the time required for analysis and providing precise levels. This indicator can be used in all financial markets, such as Forex, Crypto, and Stocks.
In addition to the indicator, the Fibonacci calculator tool also calculates Fibonacci levels for free by receiving 3 parameters [peak, bottom, and custom point].
Auto Fibo MT4 PDF
Auto Fibo MT4 PDF
Click to download Auto Fibo MT4 PDFWhat skill level is required to use the Auto Fibonacci Indicator?
Due to its automatic drawing of areas, this indicator is suitable for traders of all levels.
In which timeframes is the Auto Fibonacci Indicator used?
This indicator is suitable for all timeframes (Multi-Time Frame).


