![Average Daily Range (ADR) Indicator for MT4 Download - Free - [TFlab]](https://cdn.tradingfinder.com/image/274322/4-56-en-average-daily-range-mt4-1.webp)
![Average Daily Range (ADR) Indicator for MT4 Download - Free - [TFlab] 0](https://cdn.tradingfinder.com/image/274322/4-56-en-average-daily-range-mt4-1.webp)
![Average Daily Range (ADR) Indicator for MT4 Download - Free - [TFlab] 1](https://cdn.tradingfinder.com/image/274324/4-56-en-average-daily-range-mt4-2.webp)
![Average Daily Range (ADR) Indicator for MT4 Download - Free - [TFlab] 2](https://cdn.tradingfinder.com/image/274325/4-56-en-average-daily-range-mt4-3.webp)
![Average Daily Range (ADR) Indicator for MT4 Download - Free - [TFlab] 3](https://cdn.tradingfinder.com/image/274323/4-56-en-average-daily-range-mt4-4.webp)
Among the MetaTrader 4 indicators, the Average Daily Range (ADR) Indicator is one of the most effective tools specifically designed for determining an asset's daily price range.
This indicator calculates the average difference between the daily high and low over a specified period.
The upper level, ADR High, and the lower level, ADR Low, represent the daily range, providing traders valuable insights into key support and resistance levels.
Indicator Specifications Table
The table below summarizes the key features of this indicator.
Indicator Categories: | Support & Resistance MT4 Indicators Trading Assist MT4 Indicators Risk Management MT4 Indicators |
Platforms: | MetaTrader 4 Indicators |
Trading Skills: | Intermediate |
Indicator Types: | Range MT4 Indicators Reversal MT4 Indicators |
Timeframe: | Multi-Timeframe MT4 Indicators |
Trading Style: | Intraday MT4 Indicators |
Trading Instruments: | Stock Market MT4 Indicators Cryptocurrency MT4 Indicators Forex MT4 Indicators |
Overview of the Indicator
The ADR Indicator calculates an asset's average daily movement based on candlestick data. This provides traders with precise insights into the daily price range.
This tool allows traders to analyze market volatility more accurately and determine critical price zones for decision-making by identifying key support and resistance levels.
ADR in an Uptrend
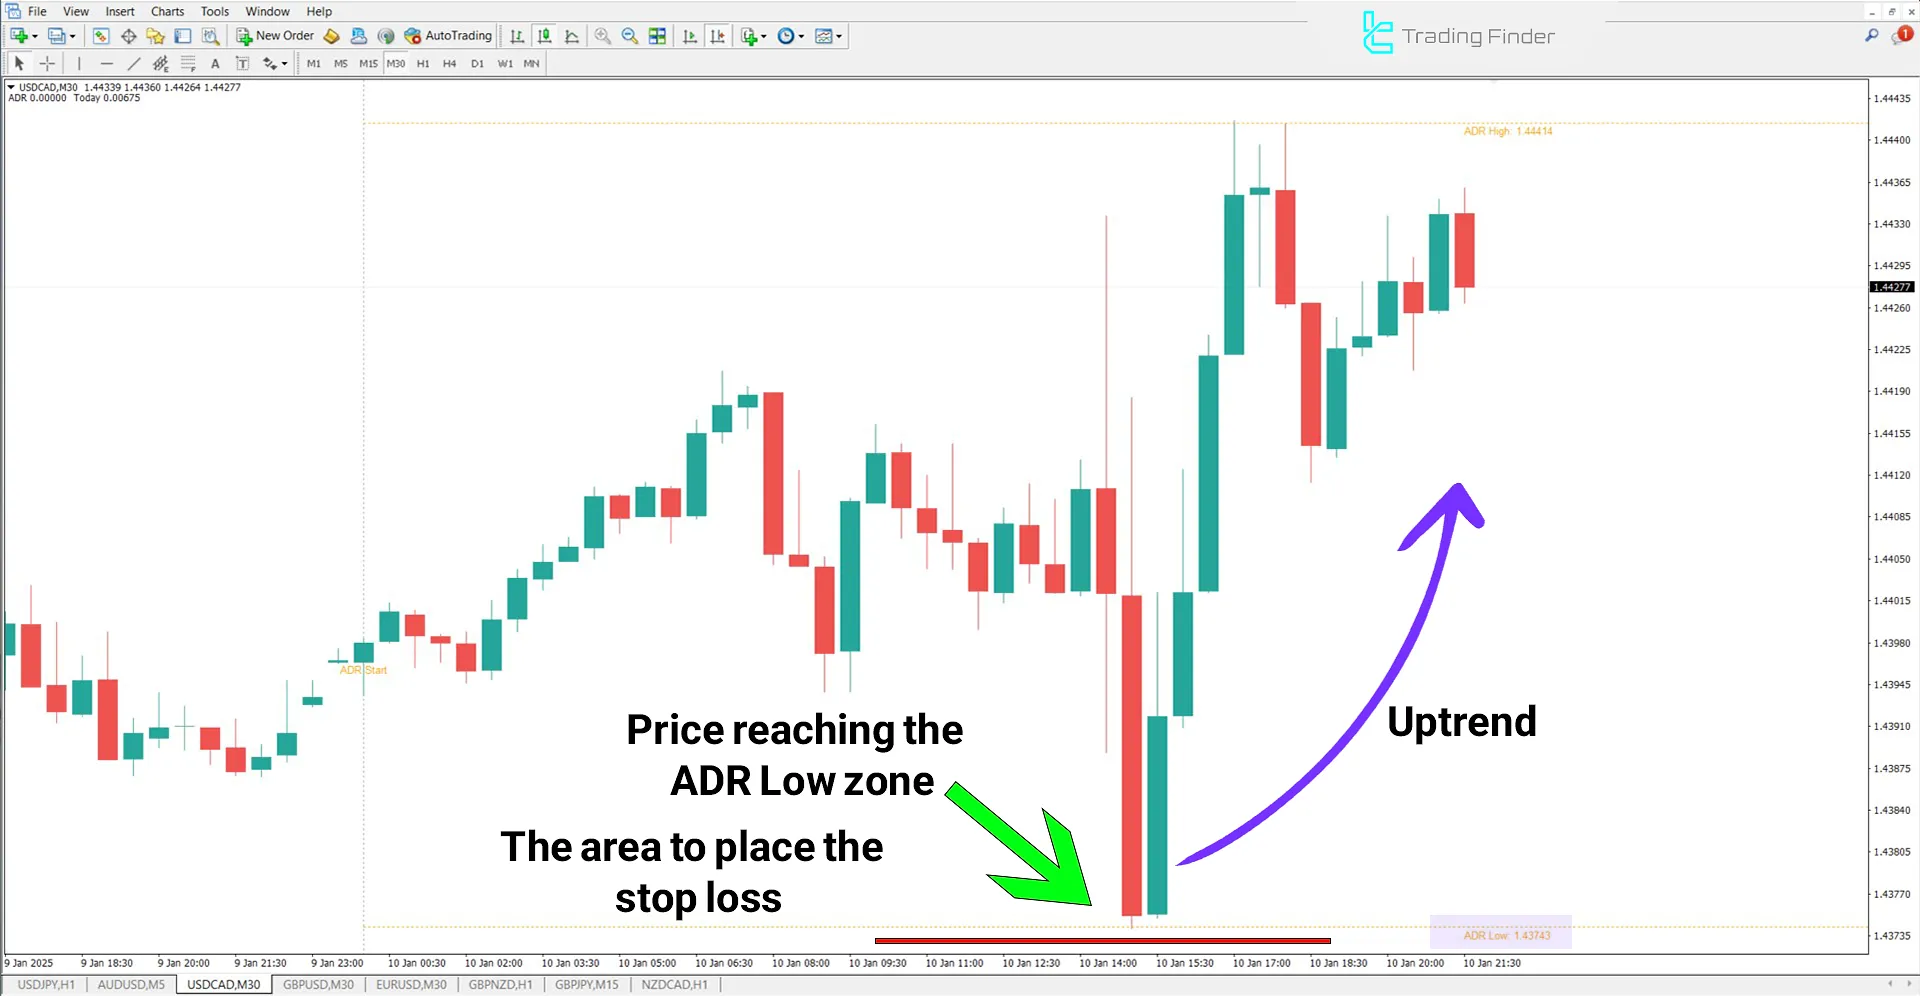
On the USD/CAD 30-minute chart, selling pressure may decrease if the price approaches the ADR Low level, potentially leading to a price increase.
If reversal candlesticks form at this level, traders may consider buying opportunities. Stop-loss can be set below the ADR Low range.

ADR in a Downtrend
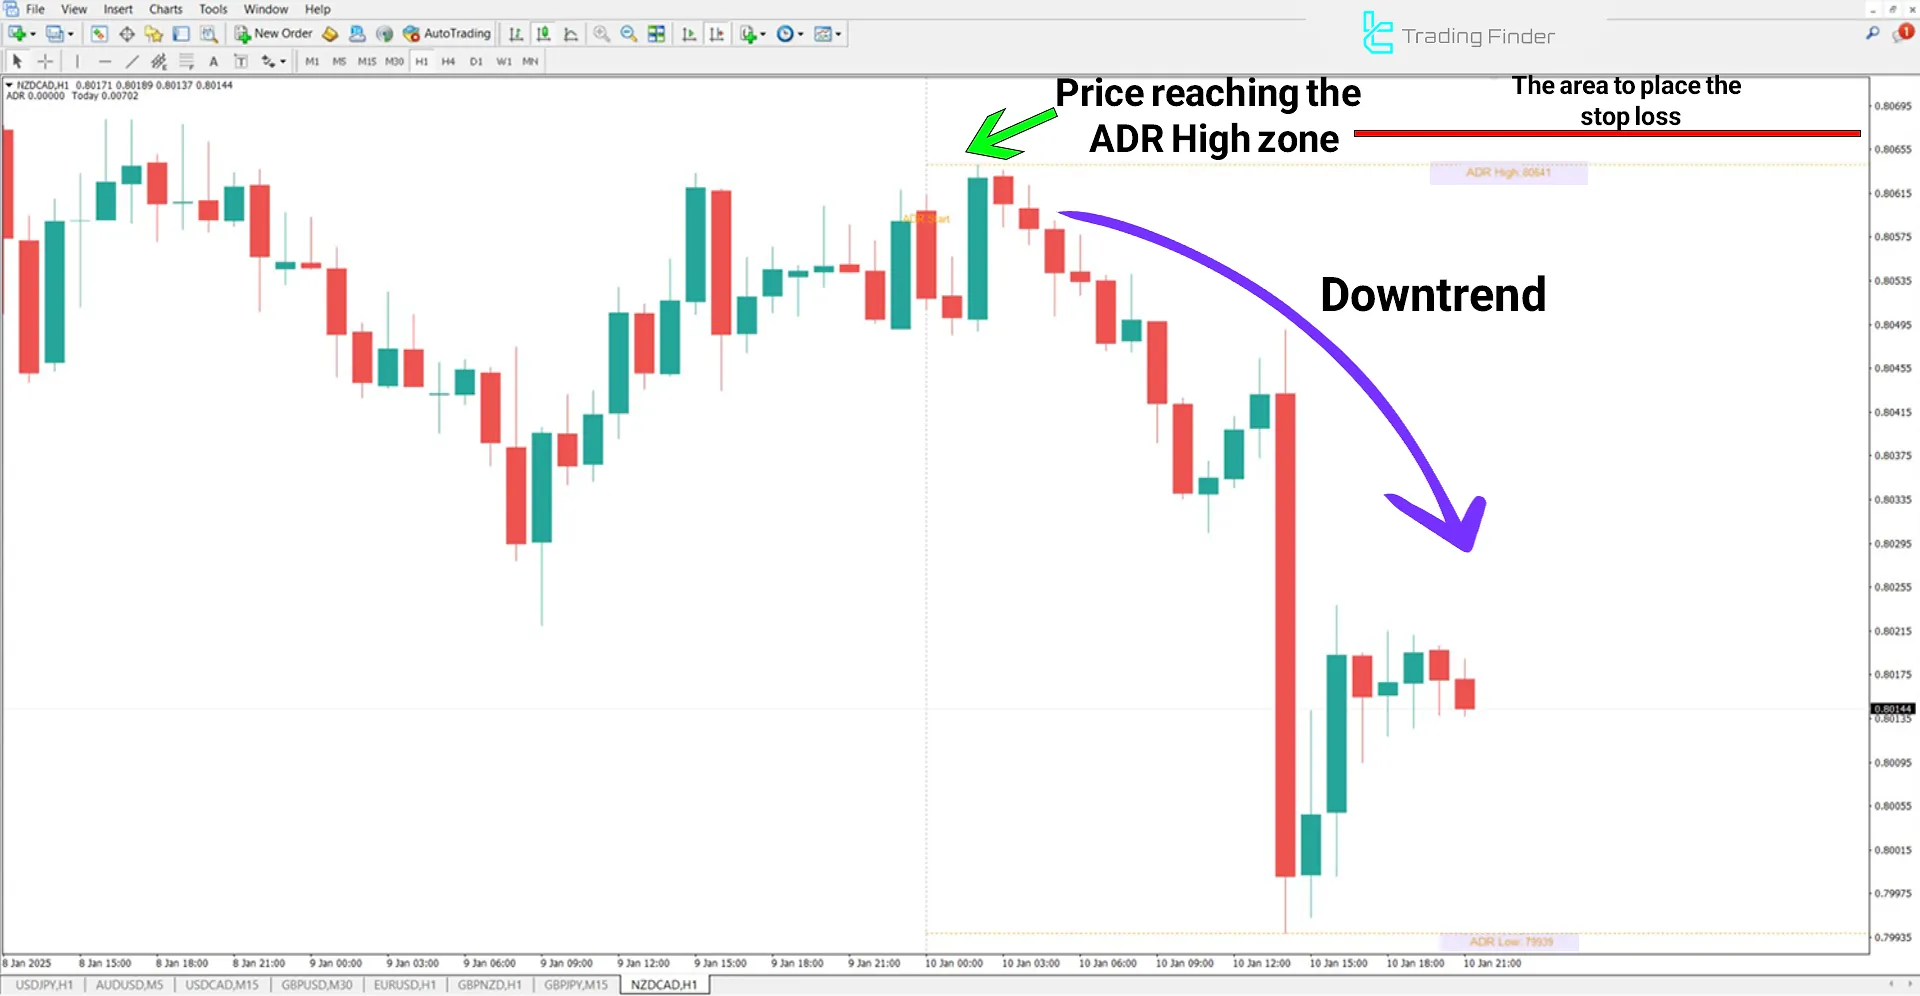
On the NZD/CAD chart, the price moves downward after reaching the ADR High level.
Traders observing reversal candlestick formations in these areas can enter a sell (Sell) trade and place a stop-loss above the ADR High level.

ADR Indicator Settings
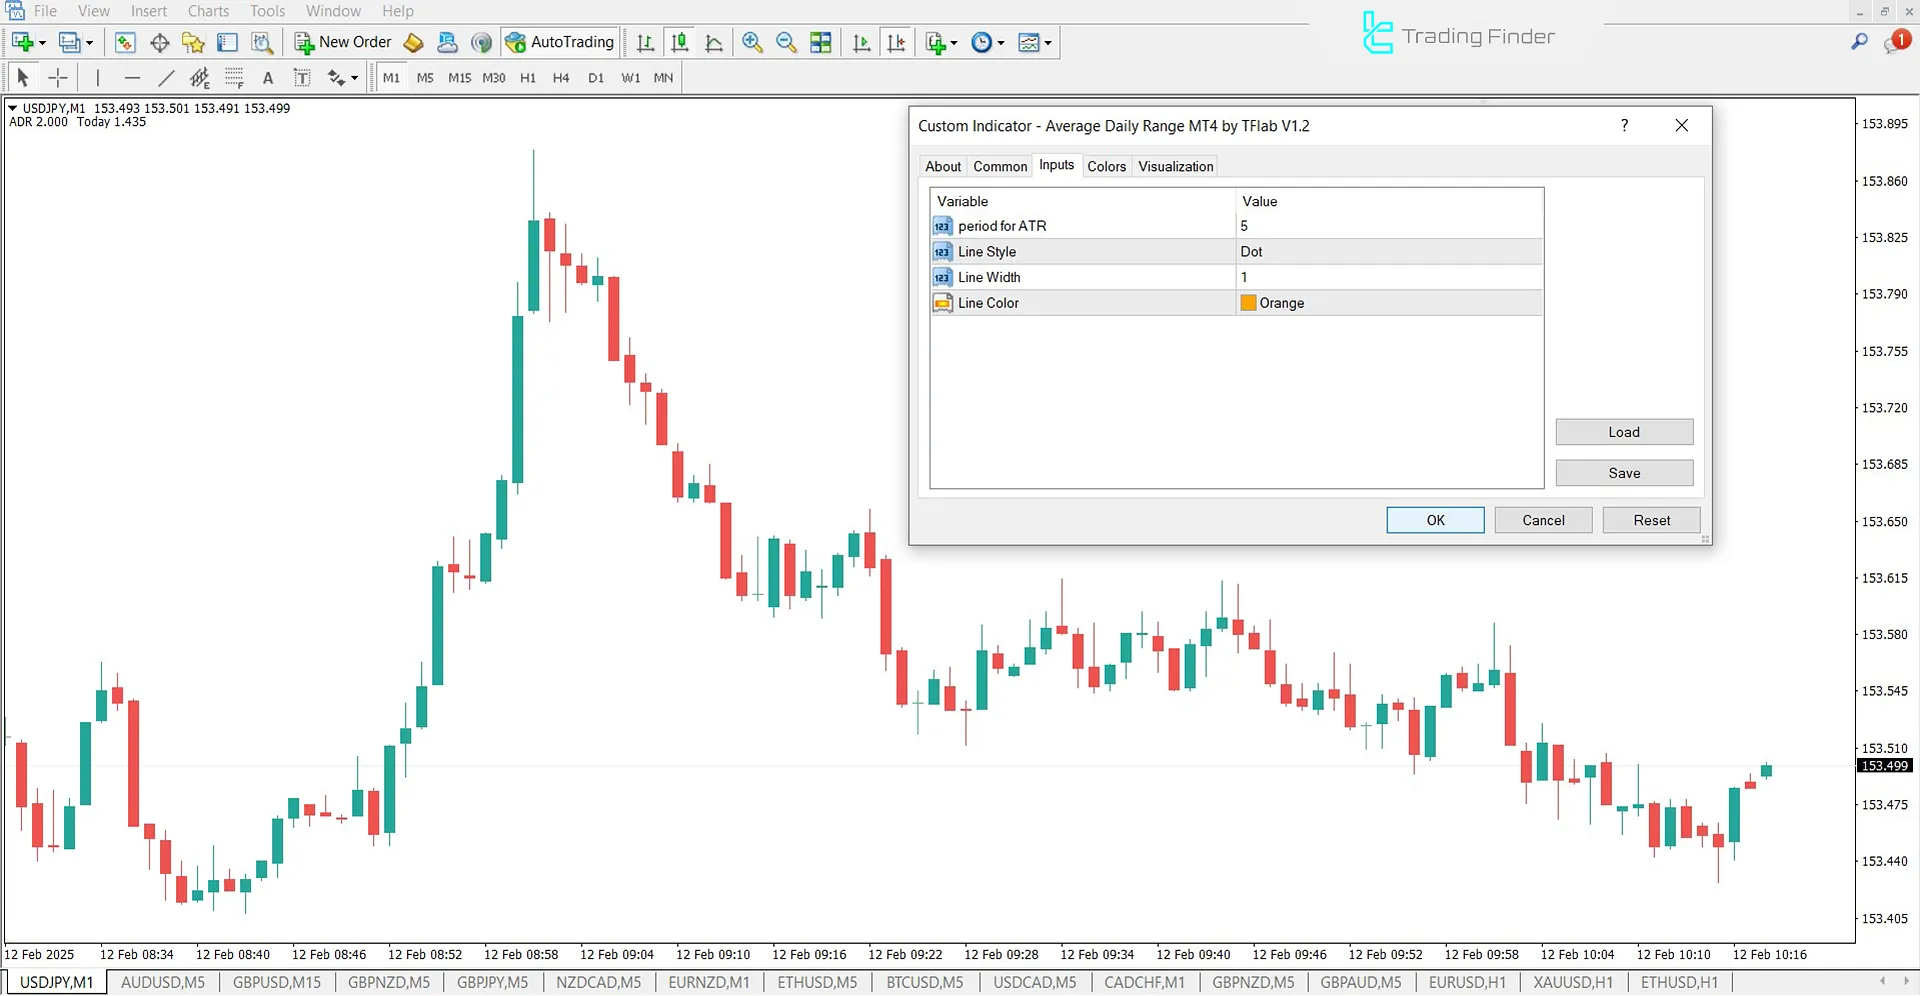
The image below provides a detailed view of the ADR Indicator settings:

- Period for ATR: Sets the ATR calculation period for defining levels
- Line Style: Determines the style of the indicator line
- Line Width: Sets the line width
- Line Color: Defines the line color
Conclusion
The Average Daily Range (ADR) Indicator is an effective tool for analyzing market volatility and identifying key support and resistance levels.
Traders can use this indicator to manage risk and refine their entry and exit strategies.
Average Daily Range ADR MT4 PDF
Average Daily Range ADR MT4 PDF
Click to download Average Daily Range ADR MT4 PDFIs the ADR Indicator useful for risk management?
Yes, traders can use ADR levels to set stop-loss (SL) and take-profit (TP) levels, helping them manage risk effectively.
How is the ADR calculated?
The Average Daily Range (ADR) Indicator calculates an asset's average daily movement based on historical candlestick data over a specified period.


