![Download the Bollinger Bands MACD Indicator for MT4 - Free - [TFlab]](https://cdn.tradingfinder.com/image/154006/4-21-en-bollinger-bands-macd-mt4-1.webp)
![Download the Bollinger Bands MACD Indicator for MT4 - Free - [TFlab] 0](https://cdn.tradingfinder.com/image/154006/4-21-en-bollinger-bands-macd-mt4-1.webp)
![Download the Bollinger Bands MACD Indicator for MT4 - Free - [TFlab] 1](https://cdn.tradingfinder.com/image/154002/4-21-en-bollinger-bands-macd-mt4-2.webp)
![Download the Bollinger Bands MACD Indicator for MT4 - Free - [TFlab] 2](https://cdn.tradingfinder.com/image/154000/4-21-en-bollinger-bands-macd-mt4-3.webp)
![Download the Bollinger Bands MACD Indicator for MT4 - Free - [TFlab] 3](https://cdn.tradingfinder.com/image/154001/4-21-fa-bollinger-bands-macd-mt4-4.webp)
The Bollinger Bands MACD indicator, designed to enhance accuracy in identifying reversal or trend continuation points, is one of the MetaTrader 4 indicators.
Bollinger Bands are generally created to determine dynamic support and resistance levels and to measure price volatility.
On the other hand, MACD is known as a tool for detecting trend strength and direction.
This combined indicator generates signals based on the interaction of MACD lines with Bollinger Bands.
Indicator Table
Indicator Categories: | Oscillators MT4 Indicators Currency Strength MT4 Indicators Bands & Channels MT4 Indicators MACD Indicators for MetaTrader 4 |
Platforms: | MetaTrader 4 Indicators |
Trading Skills: | Intermediate |
Indicator Types: | Leading MT4 Indicators Trend MT4 Indicators Reversal MT4 Indicators |
Timeframe: | Multi-Timeframe MT4 Indicators |
Trading Style: | Intraday MT4 Indicators |
Trading Instruments: | Share Stocks MT4 Indicators Binary Options MT4 Indicators Cryptocurrency MT4 Indicators Forex MT4 Indicators |
Indicator Overview
The Bollinger Bands MACD Indicator integrates three primary components: MACD, Bollinger Bands, and a combined signaling system.
Within this indicator, the MACD line moves within the Bollinger Bands range, with its color changing to reflect the market's trend direction.
When the MACD line turns green, it indicates the beginning or continuation of an uptrend. On the other hand, when the MACD line turns red, it signals the start or continuation of a downtrend.
Bullish Trend Example
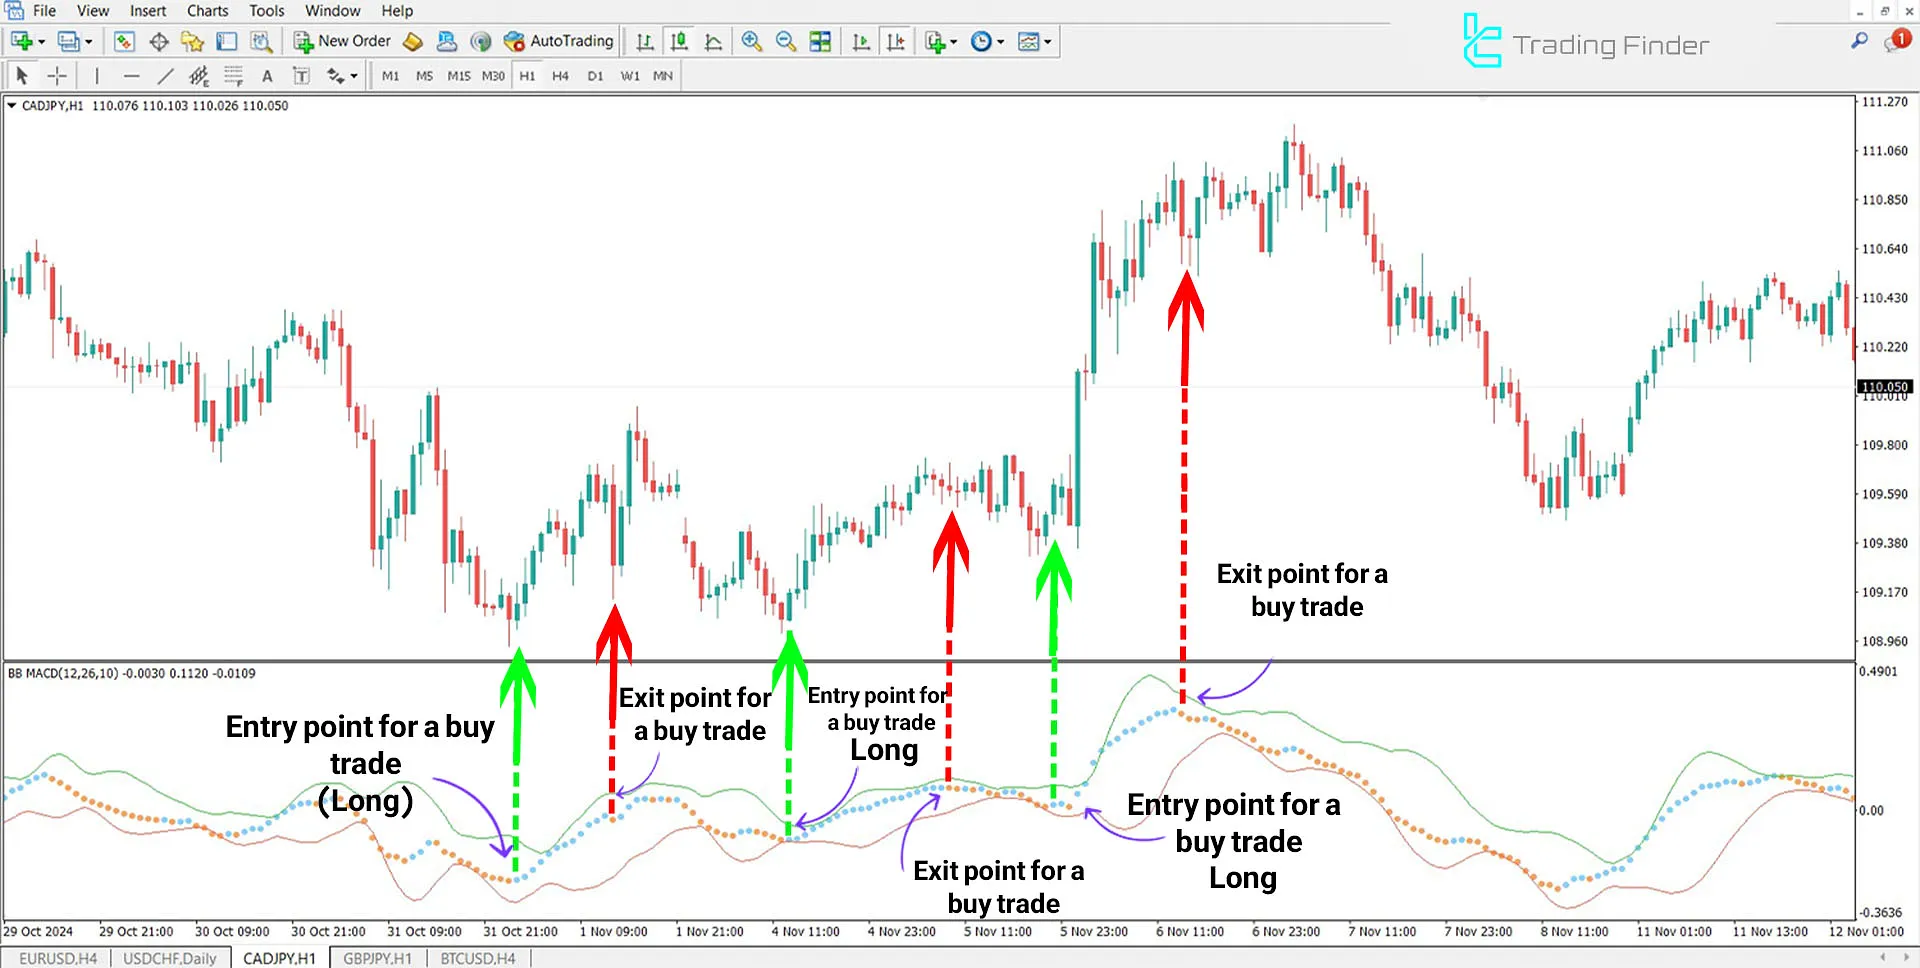
In the CAD/JPY currency pair, if the MACD line is above or inside the upper Bollinger Band, it indicates strong bullish momentum, signaling a price move toward an uptrend.
In this indicator, entry signals are displayed in blue.

Bearish Trend Example
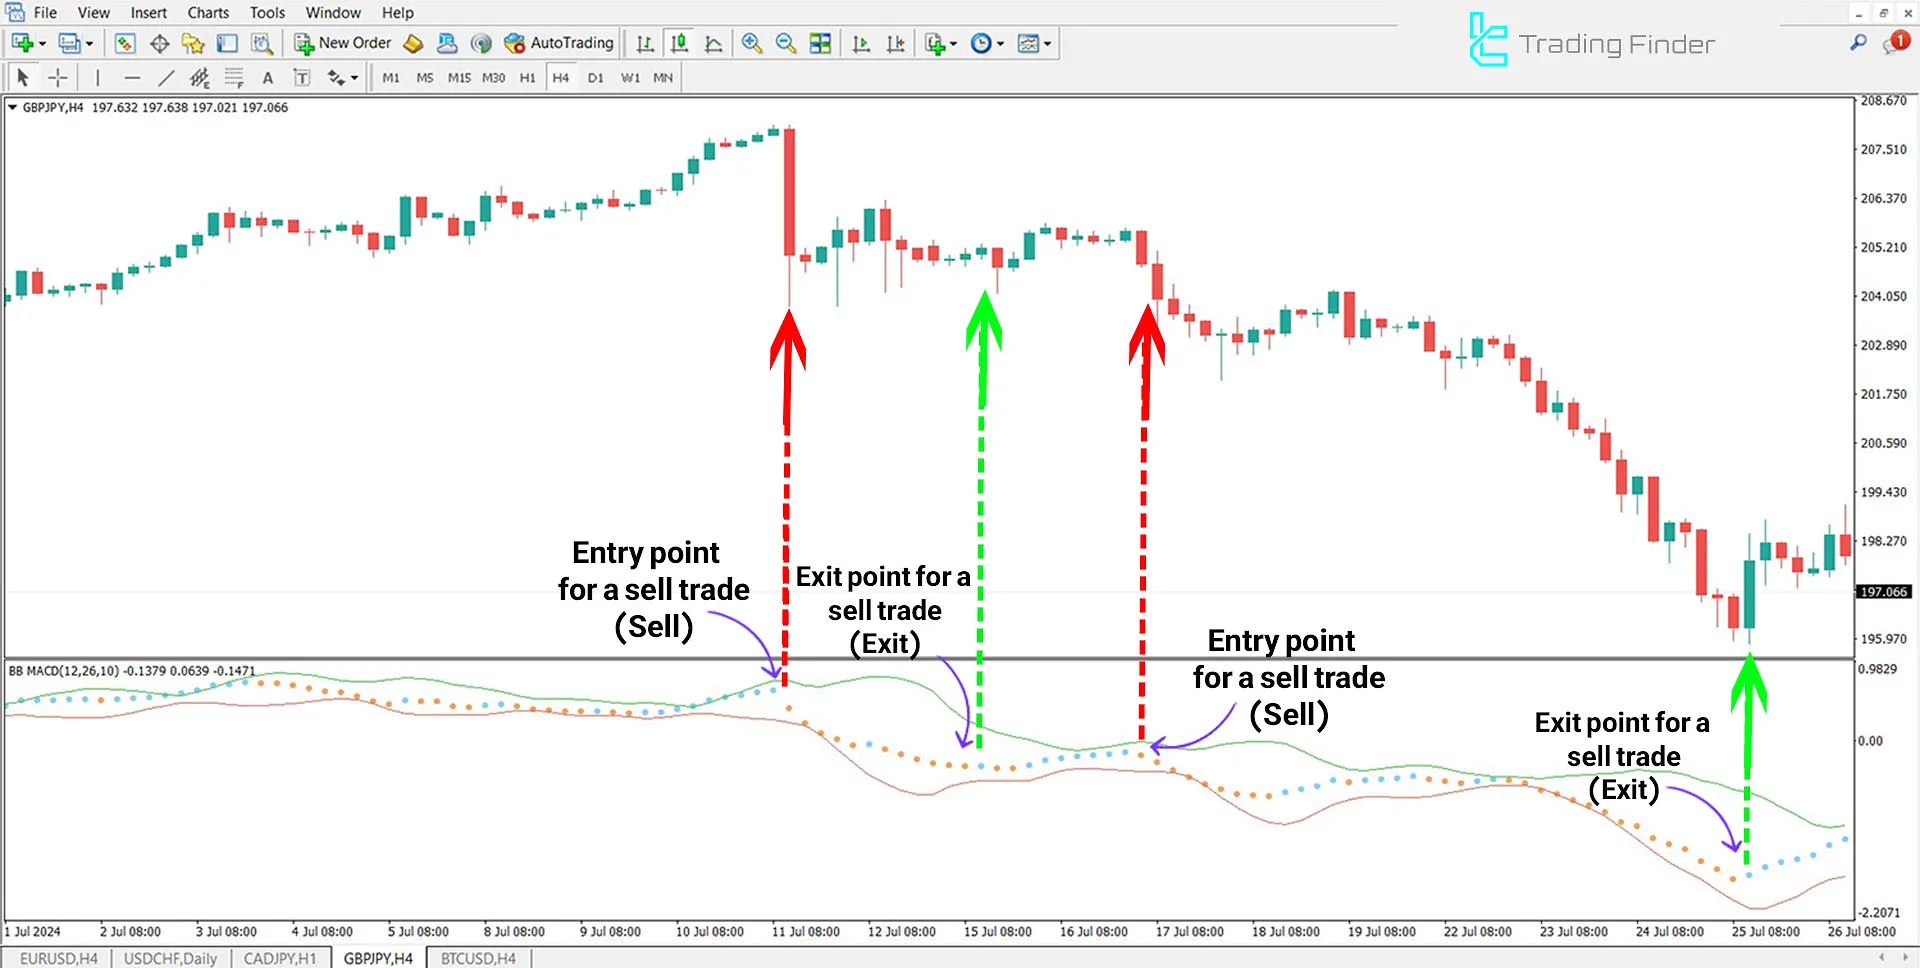
For the GBP/JPY currency pair, if the MACD line is below or crosses under the Bollinger Bands, it indicates a downtrend.
The indicator automatically provides a bearish signal by changing the MACD line color to red.

Indicator Settings

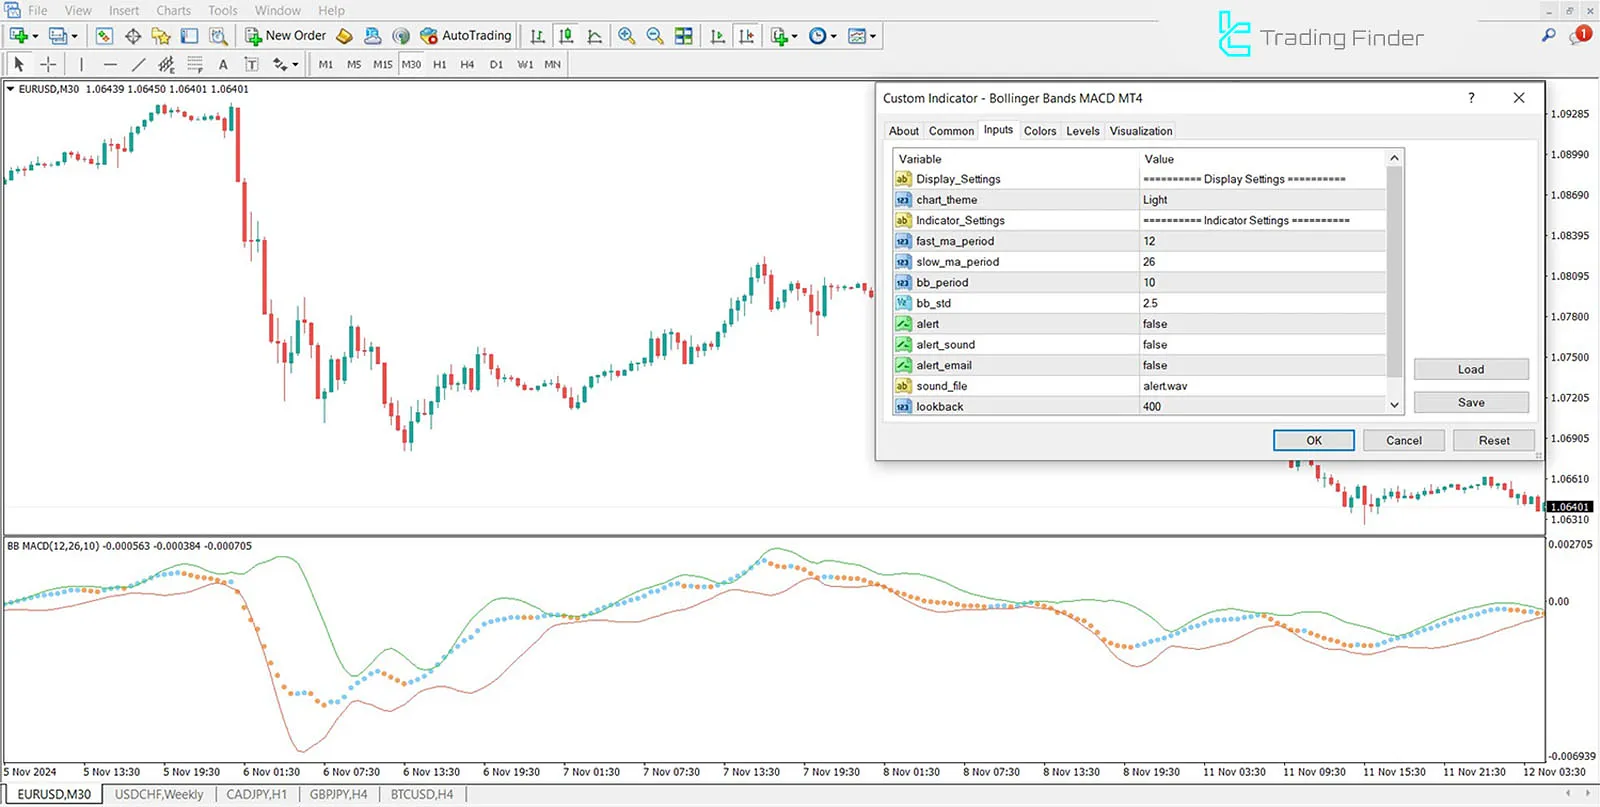
- Chart Theme: Background color of the chart;
- Fast ma period: Fast MACD calculation period (default: 12)
- Slow ma period: Slow MACD calculation period (default: 26)
- bb period: Bollinger Bands calculation period (default: 10)
- Bb std: Bollinger Bands standard deviation (default: 2.5)
- Alert: Alerts traders when MACD intersects Bollinger Bands
- Alert email: Sends an email alert to traders when MACD intersects Bollinger Bands
- Sound file: Sound for alert notifications
- Look back: at the number of candles displayed by the indicator in the past
Conclusion
The BB MACD Indicator combines the Bollinger Bands indicator and MACD indicator to help identify bullish and bearish trends in the market.
This indicator utilizes Bollinger Bands to display price volatility and employs MACD to identify entry and exit points. To enhance accuracy in confirming trade trends, Levels Indicators can be used as complementary tools.
the Bollinger Bands MACD MT4 PDF
the Bollinger Bands MACD MT4 PDF
Click to download the Bollinger Bands MACD MT4 PDFWhat skill level is required to use this indicator?
This indicator is designed for intermediate-level users, but beginner traders can also use it.
Is this indicator usable for all timeframes?
This indicator is designed for multiple timeframes, so it can be applied across various timeframes.


