![Bollinger vs Envelopes Indicator for MetaTrader 4 - Free Download [TradingFinder]](https://cdn.tradingfinder.com/image/661808/2-164-en-bollinger-vs-envelopes-mt4-1.webp)
![Bollinger vs Envelopes Indicator for MetaTrader 4 - Free Download [TradingFinder] 0](https://cdn.tradingfinder.com/image/661808/2-164-en-bollinger-vs-envelopes-mt4-1.webp)
![Bollinger vs Envelopes Indicator for MetaTrader 4 - Free Download [TradingFinder] 1](https://cdn.tradingfinder.com/image/661804/2-164-en-bollinger-vs-envelopes-mt4-2.webp)
![Bollinger vs Envelopes Indicator for MetaTrader 4 - Free Download [TradingFinder] 2](https://cdn.tradingfinder.com/image/661803/2-164-en-bollinger-vs-envelopes-mt4-3.webp)
![Bollinger vs Envelopes Indicator for MetaTrader 4 - Free Download [TradingFinder] 3](https://cdn.tradingfinder.com/image/661812/2-164-en-bollinger-vs-envelopes-mt4-4.webp)
The Bollinger vs Envelopes Indicator, by combining Bollinger Bands and Envelopes, analyzes price behavior based on moving averages.
Bollinger Bands determine market volatility by calculating the standard deviation around the moving average, while Envelopes plot channels above and below the moving average to indicate potential price movement ranges.
Bollinger vs Envelopes Indicator Table
The general specifications of the Bollinger vs Envelopes Indicator are presented in the table below:
Indicator Categories: | Trading Assist MT4 Indicators Candle Sticks MT4 Indicators |
Platforms: | MetaTrader 4 Indicators |
Trading Skills: | Elementary |
Indicator Types: | Reversal MT4 Indicators |
Timeframe: | Multi-Timeframe MT4 Indicators |
Trading Style: | Intraday MT4 Indicators |
Trading Instruments: | Share Stocks MT4 Indicators Indices Market MT4 Indicators Commodity Market MT4 Indicators Stock Market MT4 Indicators Cryptocurrency MT4 Indicators Forex MT4 Indicators |
Bollinger vs Envelopes Indicator at a Glance
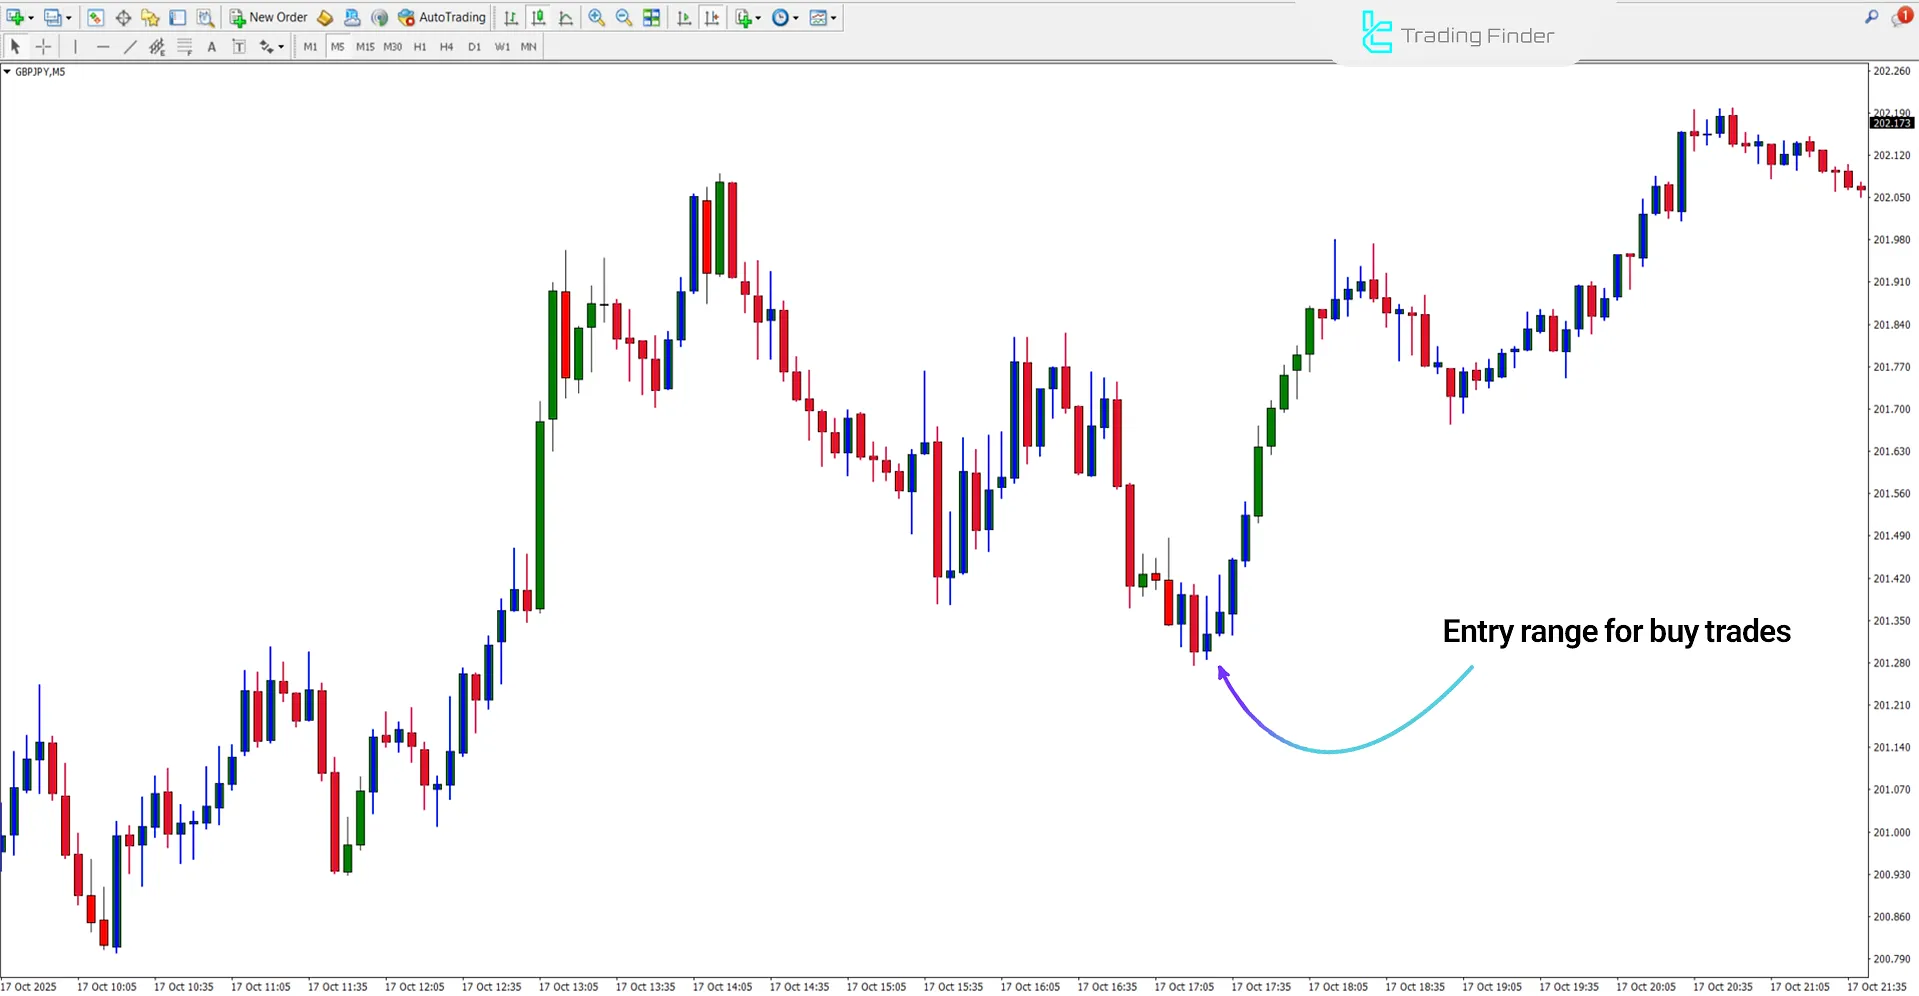
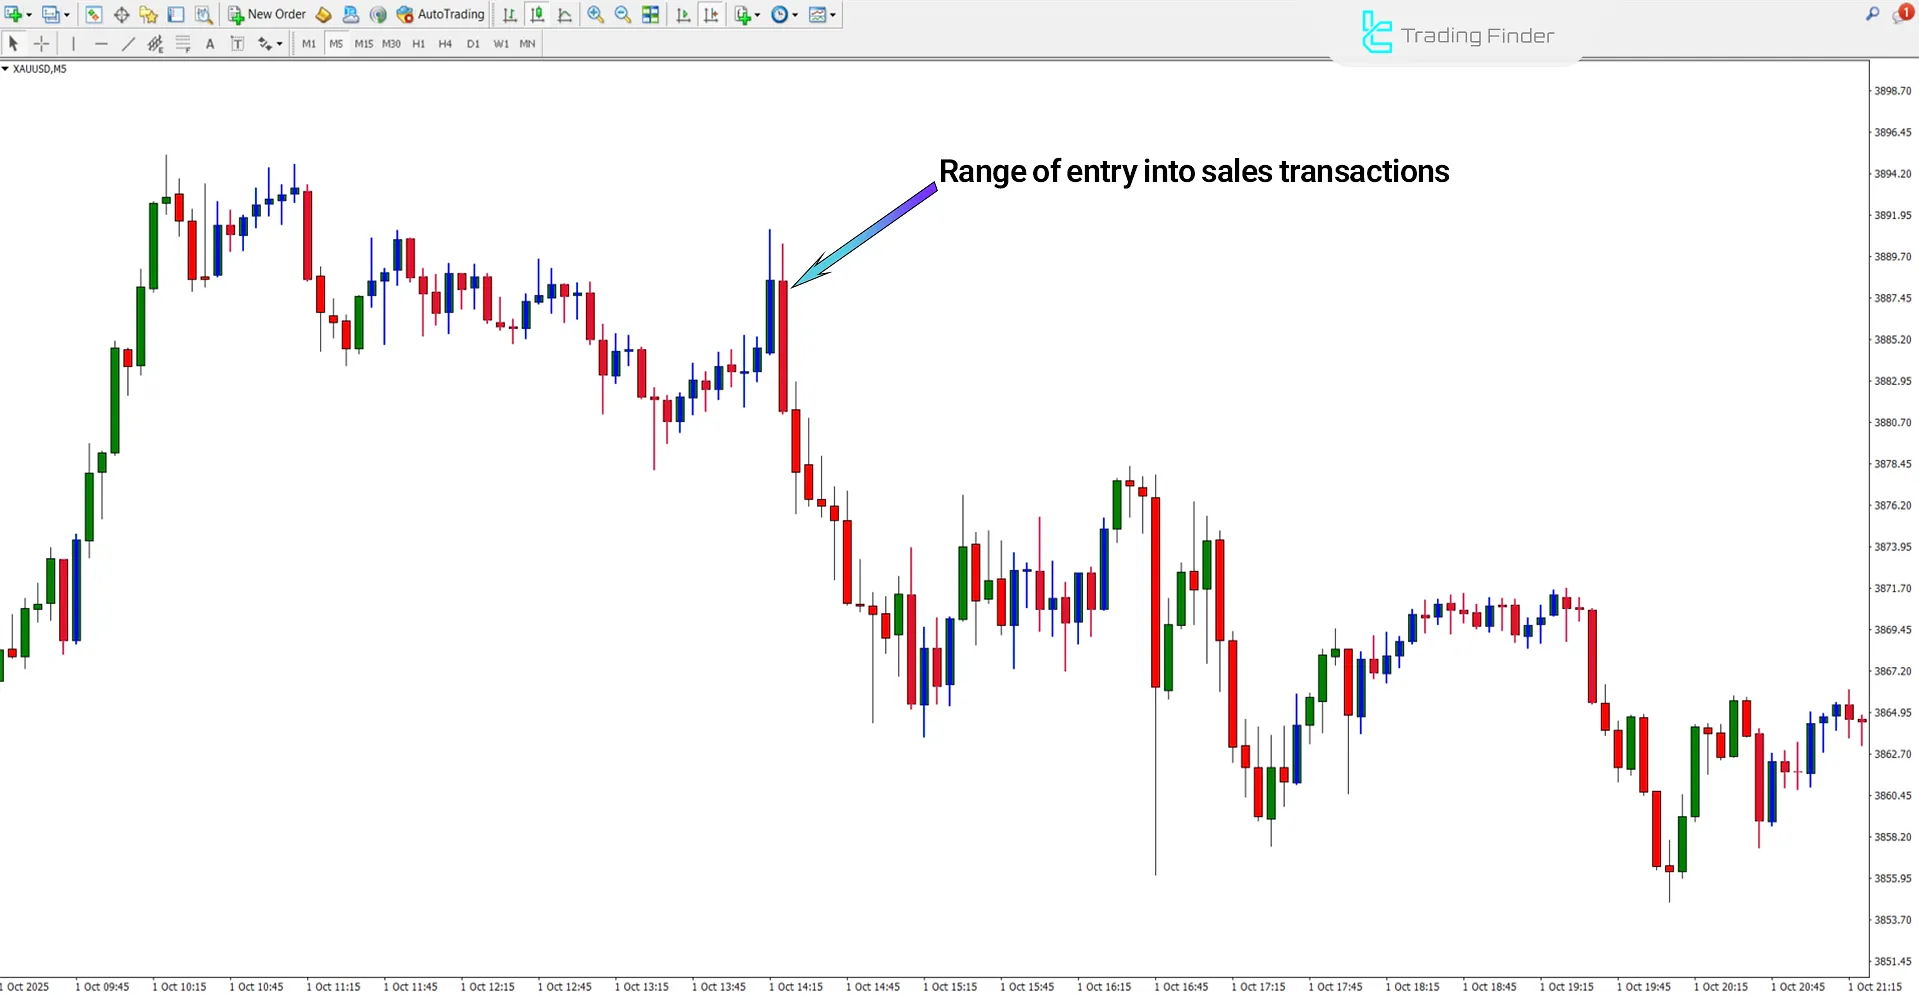
The Bollinger vs Envelopes Indicator, based on the price position relative to Bollinger Bands and Envelopes channels, changes candle colors and generates buy or sell signals.
- Blue Candle (Buy Signal): Appears when the price stabilizes in the lower range of the Envelopes or Bollinger Bands and then a candle closes bullish with a real body;
- Red Candle (Sell Signal): Appears when the price is in the upper range of the Envelopes or Bollinger Bands and a bearish candle closes with a real body.
Indicator in Bullish Trend
In this indicator, when the price reaches the lower Bollinger Band or Envelopes channel and a bullish candle closes with a real body, the candle is displayed in blue.
This color is recognized as a buy signal and defines the suitable zone for entering long positions.

Indicator in Bearish Trend
When the price reaches the upper Bollinger Band or Envelopes channel and a bearish candle closes with a real body, the candle color changes to red.
This color change signals the activation of a sell signal and the beginning of a downward movement.

Bollinger vs Envelopes Indicator Settings
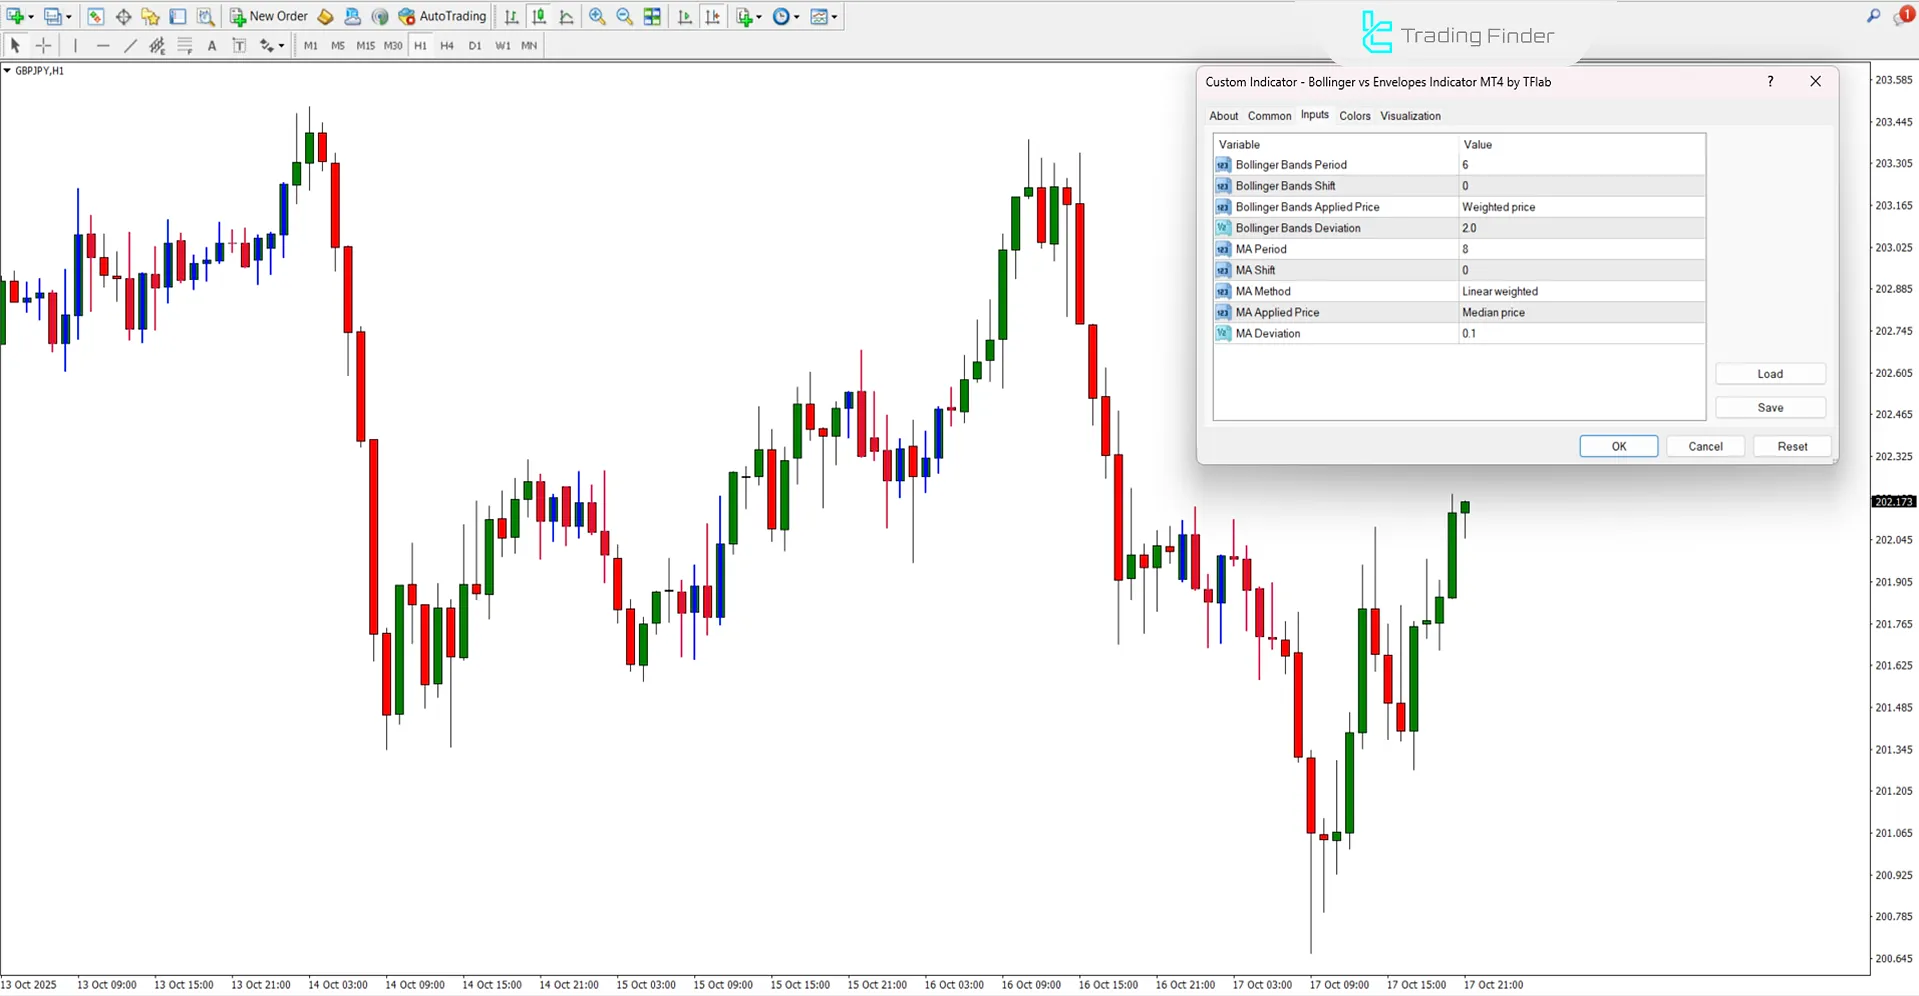
The image below shows the settings panel of the Bollinger vs Envelopes Indicator:

- Bollinger Bands Period: Displays the period of the Bollinger Bands
- Bollinger Bands Shift: Shift of the Bollinger Bands
- Bollinger Bands Applied Price: Type of price applied in the Bollinger Bands
- Bollinger Bands Deviation: Displays the standard deviation of the Bollinger Bands
- MA Period: Displays the period of the Moving Average
- MA Shift: Shift of the Moving Average
- MA Applied Price: Type of price applied in the Moving Average
- MA Deviation: Displays the deviation of the Moving Average
Conclusion
The Bollinger vs Envelopes Indicator is a combination of two powerful moving average–based tools that display dynamic support and resistance levels.
This trading tool issues buy and sell signals by changing candle colors to blue or red, allowing for trend analysis across multiple timeframes.
Bollinger vs Envelopes Indicator for MetaTrader 4 PDF
Bollinger vs Envelopes Indicator for MetaTrader 4 PDF
Click to download Bollinger vs Envelopes Indicator for MetaTrader 4 PDFWhat is the Bollinger vs Envelopes Indicator?
This trading tool combines Bollinger Bands and Envelopes to generate buy and sell signals by changing candle colors.
In which timeframes can the Bollinger vs Envelopes Indicator be used?
This indicator can be used on all timeframes; lower timeframes show short-term signals, while higher timeframes reveal long-term trends.


