![Book Map Indicator for MetaTrader 4 Download – Free – [TradingFinder]](https://cdn.tradingfinder.com/image/380851/13-123-en-book-map-mt4-01.webp)
![Book Map Indicator for MetaTrader 4 Download – Free – [TradingFinder] 0](https://cdn.tradingfinder.com/image/380851/13-123-en-book-map-mt4-01.webp)
![Book Map Indicator for MetaTrader 4 Download – Free – [TradingFinder] 1](https://cdn.tradingfinder.com/image/380849/13-123-en-book-map-mt4-02.webp)
![Book Map Indicator for MetaTrader 4 Download – Free – [TradingFinder] 2](https://cdn.tradingfinder.com/image/380848/13-123-en-book-map-mt4-03.webp)
![Book Map Indicator for MetaTrader 4 Download – Free – [TradingFinder] 3](https://cdn.tradingfinder.com/image/380846/13-123-en-book-map-mt4-04.webp)
The Book Map Indicator lets traders observe market depth, liquidity, and buy/sell order levels through interactive and visual formats.
This trading tool uses colored histograms on the right side of the chart to indicate where significant buy (green) or sell (red) order volumes exist at different price levels.
In addition, the indicator uses colored circles to break down candlestick volume information.
Book Map Indicator Specifications
The features and specifications of the Book Map Indicator are presented in the table below.
Indicator Categories: | Volume MT4 Indicators Liquidity MT4 Indicators Trading Assist MT4 Indicators |
Platforms: | MetaTrader 4 Indicators |
Trading Skills: | Intermediate |
Indicator Types: | Reversal MT4 Indicators |
Timeframe: | M1-M5 Time MT4 Indicators M15-M30 Time MT4 Indicators H4-H1 Time MT4 Indicators |
Trading Style: | Day Trading MT4 Indicators Scalper MT4 Indicators Swing Trading MT4 Indicators |
Trading Instruments: | Forward Market MT4 Indicators Stock Market MT4 Indicators Cryptocurrency MT4 Indicators Forex MT4 Indicators |
Book Map Indicator at a Glance
One of the unique features of the Book Map Indicator is the generation of colored circles on candlesticks, each reflecting specific volume characteristics:
- Gold Circle: Lowest volume in the candle
- Orange Circle: Low volume, limited activity
- Red-Orange Circle: Below-average volume
- Light Purple: Above-average volume
- Dark Purple: High volume, strong market moves
- Dark Blue: Maximum volume, potential smart money activity
Bullish Trend Conditions
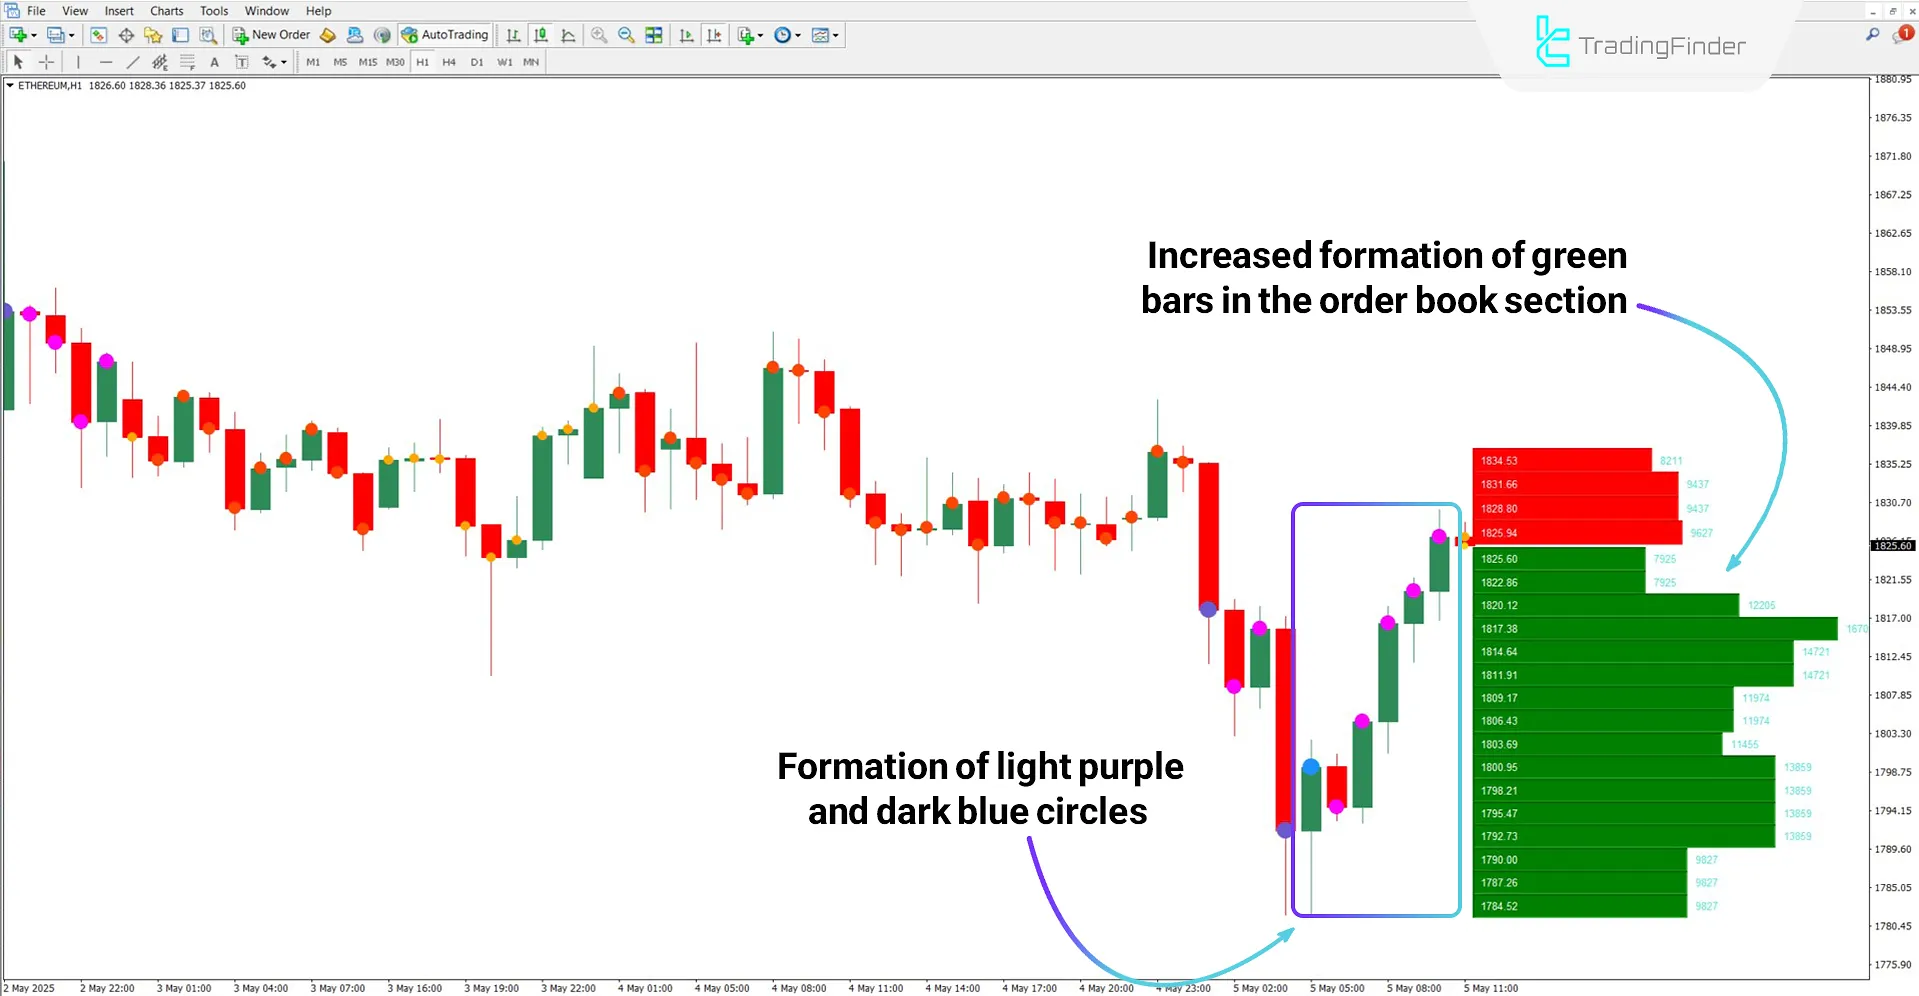
According to the Ethereum (ETH) chart on the 1-hour timeframe, green histograms on the right indicate high volume and buy orders.
In addition, dark blue and light purple circles on green candles indicate strong volume in bullish candlesticks.

Bearish Trend Conditions
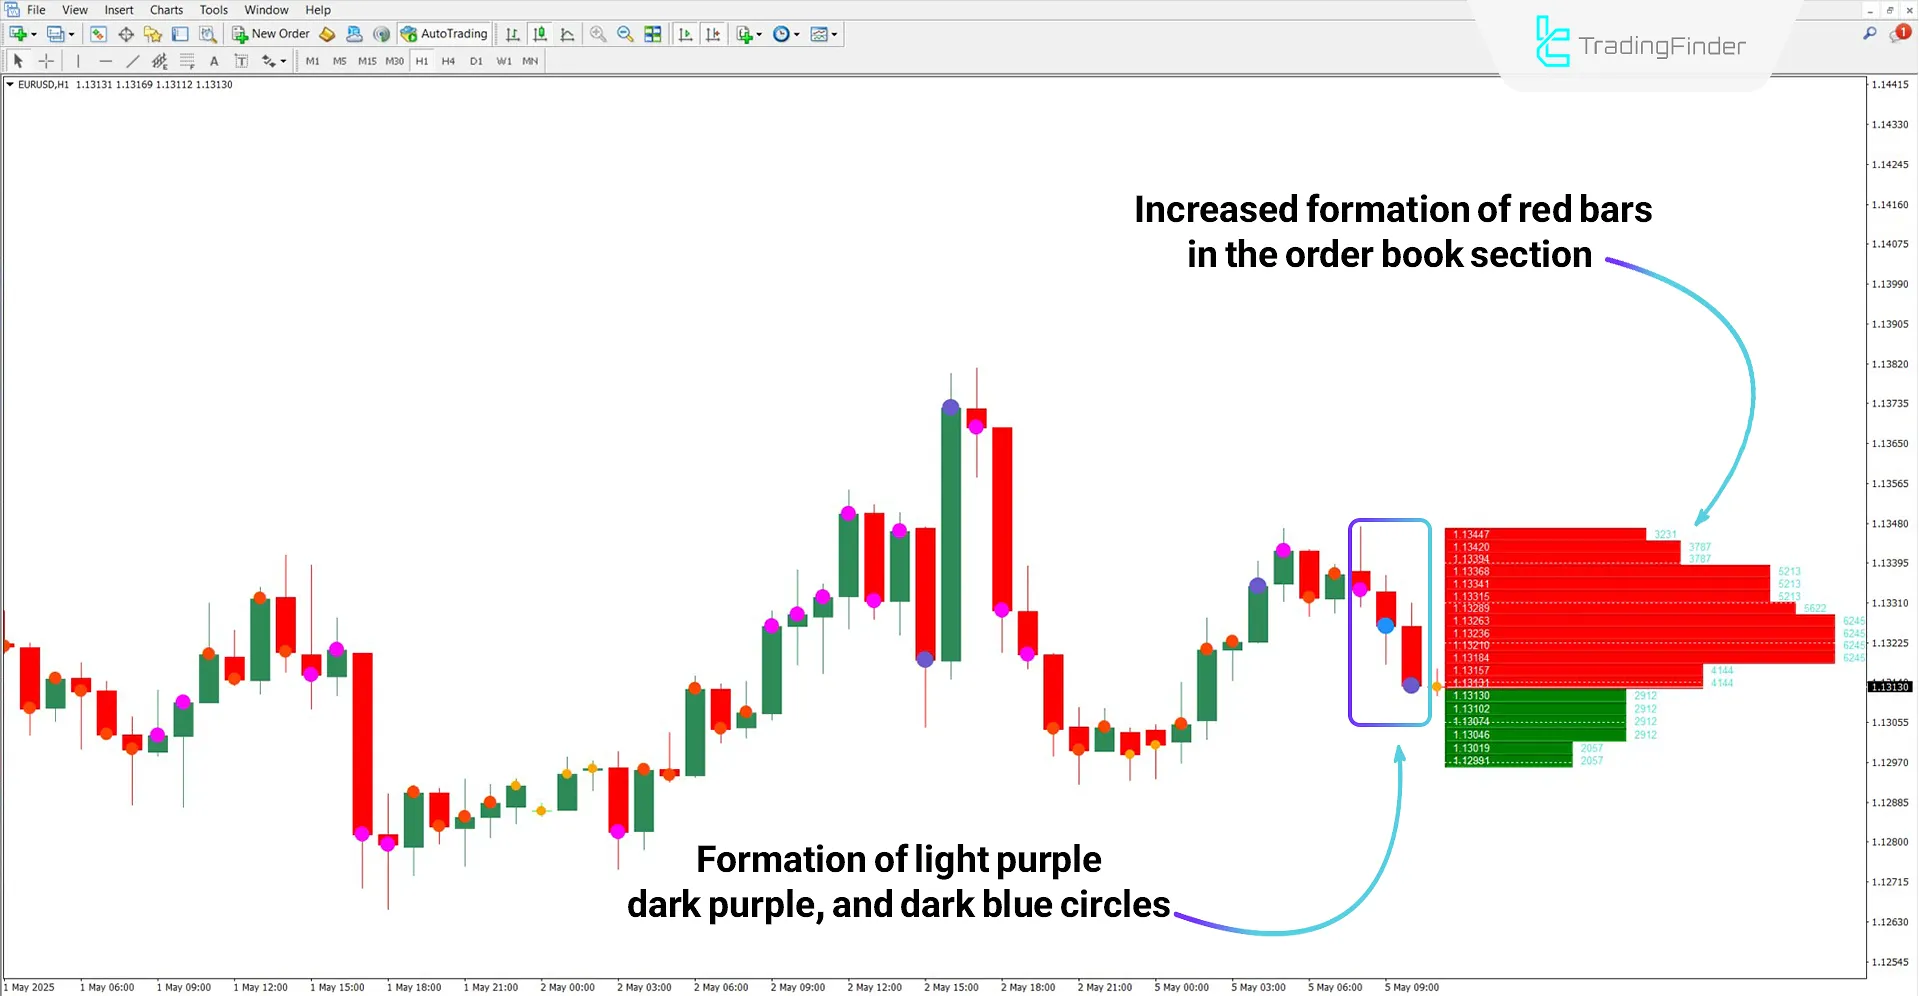
In the EUR/USD chart analysis, the appearance of multiple red histograms on the right side of the chart signals sell order concentration and high supply at those price levels.
Furthermore, light purple, dark purple, and dark blue circles above red candles indicate heavy sell volume in bearish market activity.

Book Map Indicator Settings
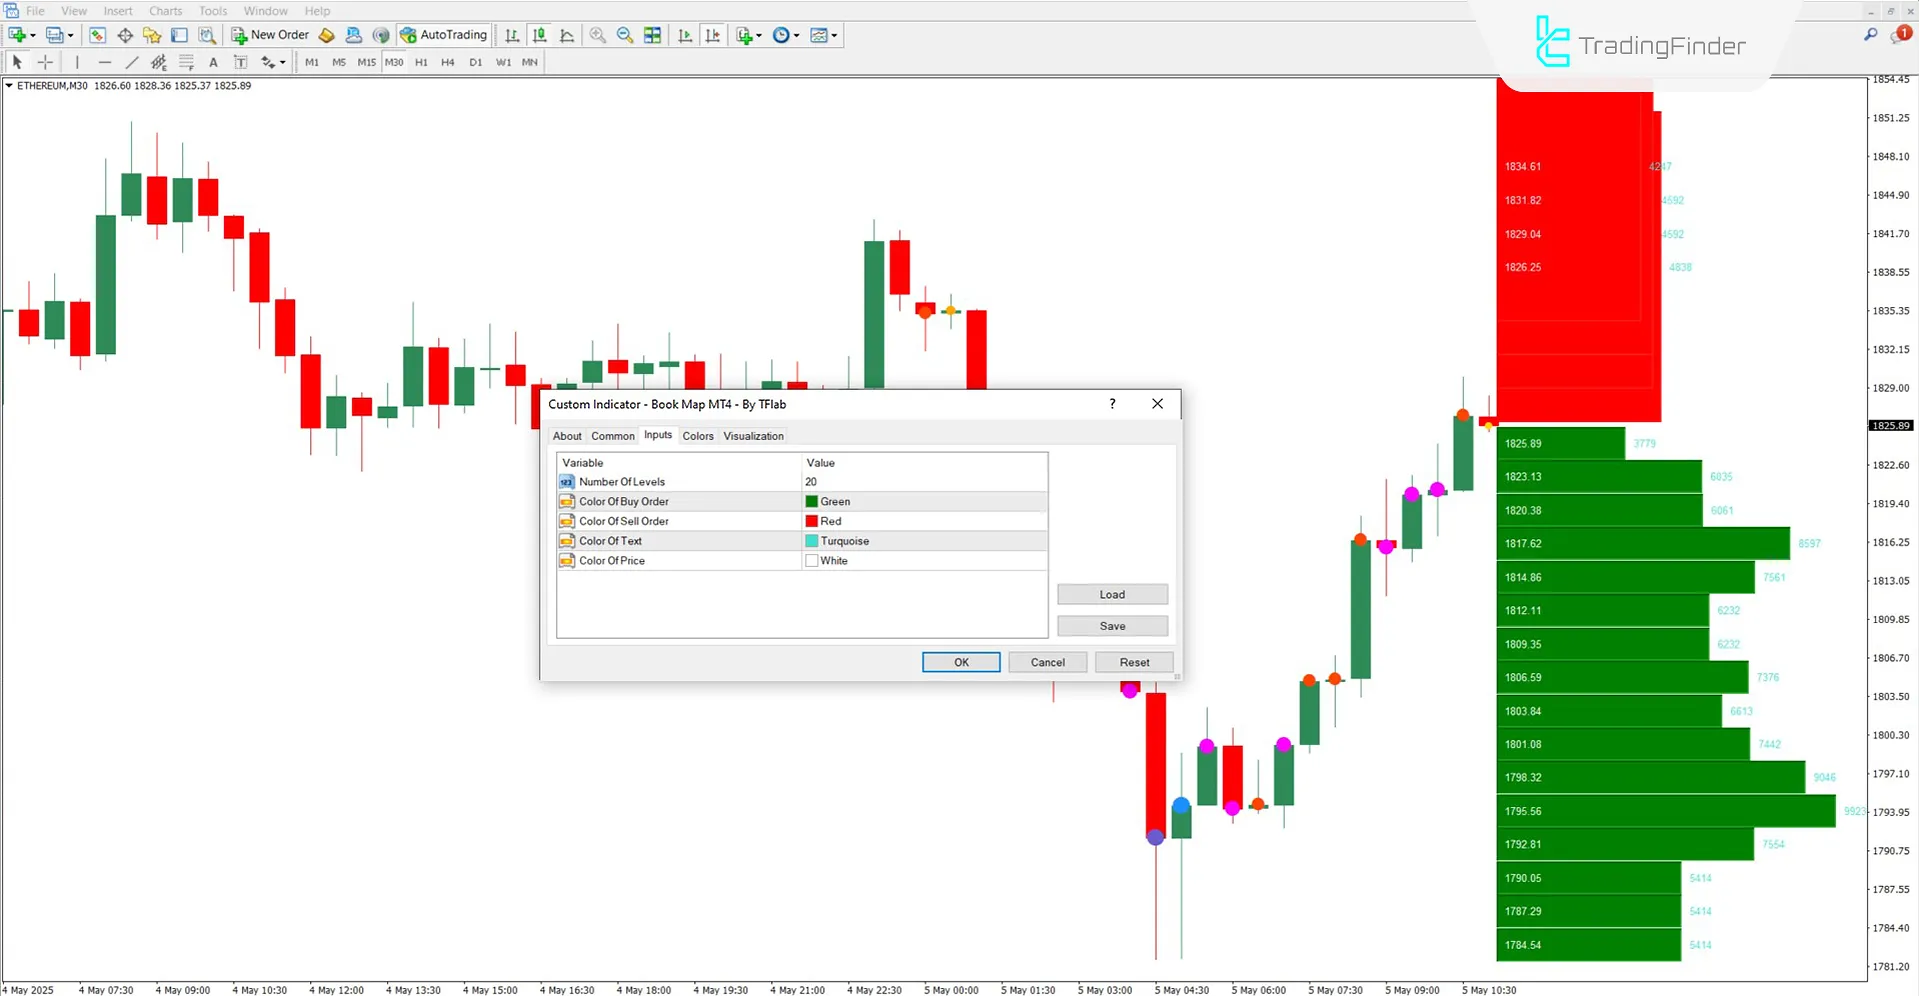
The image below displays the settings panel of the Book Map indicator on the MetaTrader 4 platform:

- Number of Levels: Set the number of price levels for buy/sell orders
- Color of Buy Order: Set the color of buy order bars
- Color of Sell Order: Set the color of sell order bars
- Color of Text: Define the color of text labels beside the bars
- Color of Price: Set the color of prices inside the bars
Conclusion
The Book Map Indicator is a key tool for order flow analysis and Depth of Market (DOM) tracking in MetaTrader 4.
The histograms drawn on the right side of the chart not only reflect order placement and volume but highlight potential support and resistance zones.
This indicator can be used in various tradingmarkets such as Forex, cryptocurrencies, stocks, and commodities.
Book Map MT4 PDF
Book Map MT4 PDF
Click to download Book Map MT4 PDFDoes the Book Map indicator generate entry/exit signals?
No, this indicator does not provide entry or exit signals.
Can this indicator be used on a daily timeframe?
No, it is only suitable for 1-minute to 4-hour timeframes.


