![CPR (Central Pivot Range) Indicator in MetaTrader 4 – Free – [Trading Finder]](https://cdn.tradingfinder.com/image/324889/2-48-en-cpr-indicator-mt4-1.webp)
![CPR (Central Pivot Range) Indicator in MetaTrader 4 – Free – [Trading Finder] 0](https://cdn.tradingfinder.com/image/324889/2-48-en-cpr-indicator-mt4-1.webp)
![CPR (Central Pivot Range) Indicator in MetaTrader 4 – Free – [Trading Finder] 1](https://cdn.tradingfinder.com/image/324883/2-48-en-cpr-indicator-mt4-2png.webp)
![CPR (Central Pivot Range) Indicator in MetaTrader 4 – Free – [Trading Finder] 2](https://cdn.tradingfinder.com/image/324892/2-48-en-cpr-indicator-mt4-3.webp)
![CPR (Central Pivot Range) Indicator in MetaTrader 4 – Free – [Trading Finder] 3](https://cdn.tradingfinder.com/image/324884/2-48-en-cpr-indicator-mt4-4.webp)
The CPR (Central Pivot Range) indicator is one of the most widely used tools in technical analysis. It is designed to identify key levels, reversal points, and potential market trend direction.
This MetaTrader 4 indicator is calculated based on high, low, and close prices and consists of a central pivot point, two resistance levels (blue), and two support levels (orange).
CPR Indicator Specifications Table
The table below outlines the general features of the CPR indicator.
Indicator Categories: | Pivot Points & Fractals MT4 Indicators Support & Resistance MT4 Indicators Volatility MT4 Indicators |
Platforms: | MetaTrader 4 Indicators |
Trading Skills: | Intermediate |
Indicator Types: | Reversal MT4 Indicators |
Timeframe: | Multi-Timeframe MT4 Indicators |
Trading Style: | Intraday MT4 Indicators |
Trading Instruments: | Share Stocks MT4 Indicators Forward Market MT4 Indicators Stock Market MT4 Indicators Cryptocurrency MT4 Indicators Forex MT4 Indicators |
Uptrend Conditions
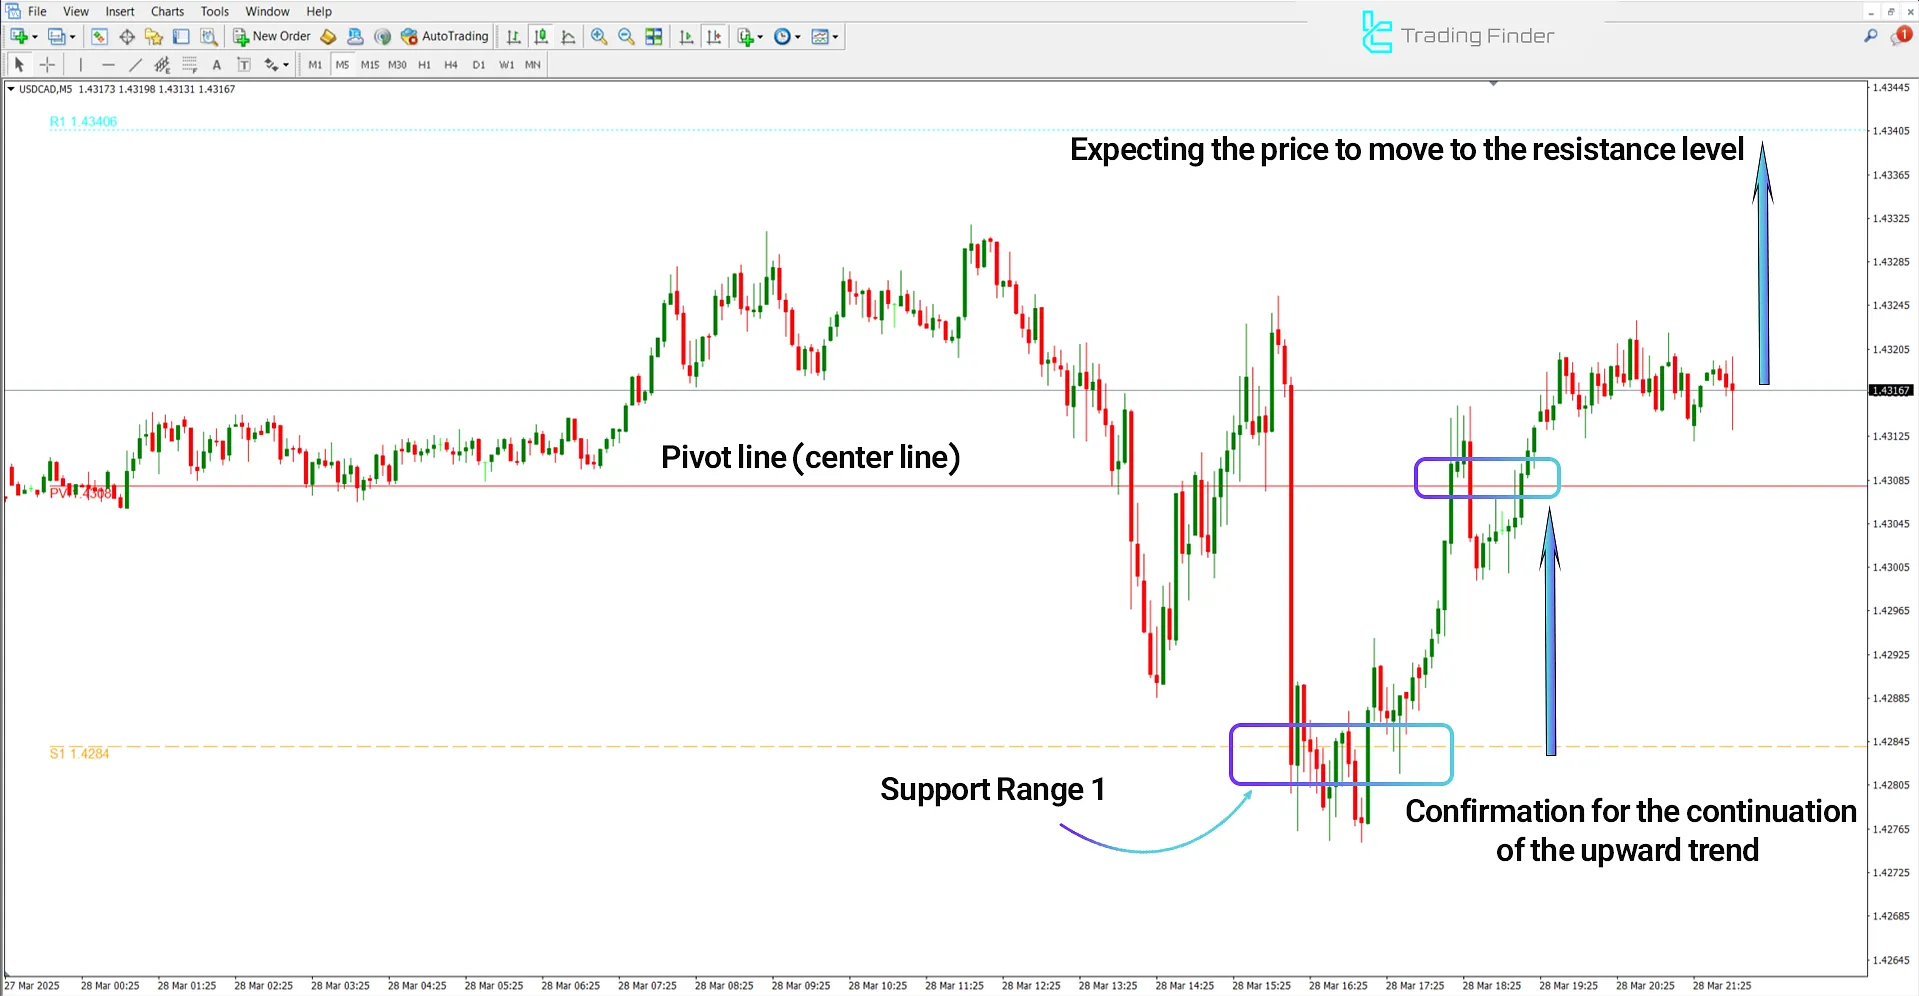
The chart below shows the USD/CAD currency pair in the 5 minute timeframe.
In this chart, after price fluctuation within the support zone, its return toward the pivot line and positioning above it can be considered a confirmation to enter a Buy position.
In such scenarios, the price target is usually the upcoming resistance zone, identifiable through the CPR structure.

Downtrend Conditions
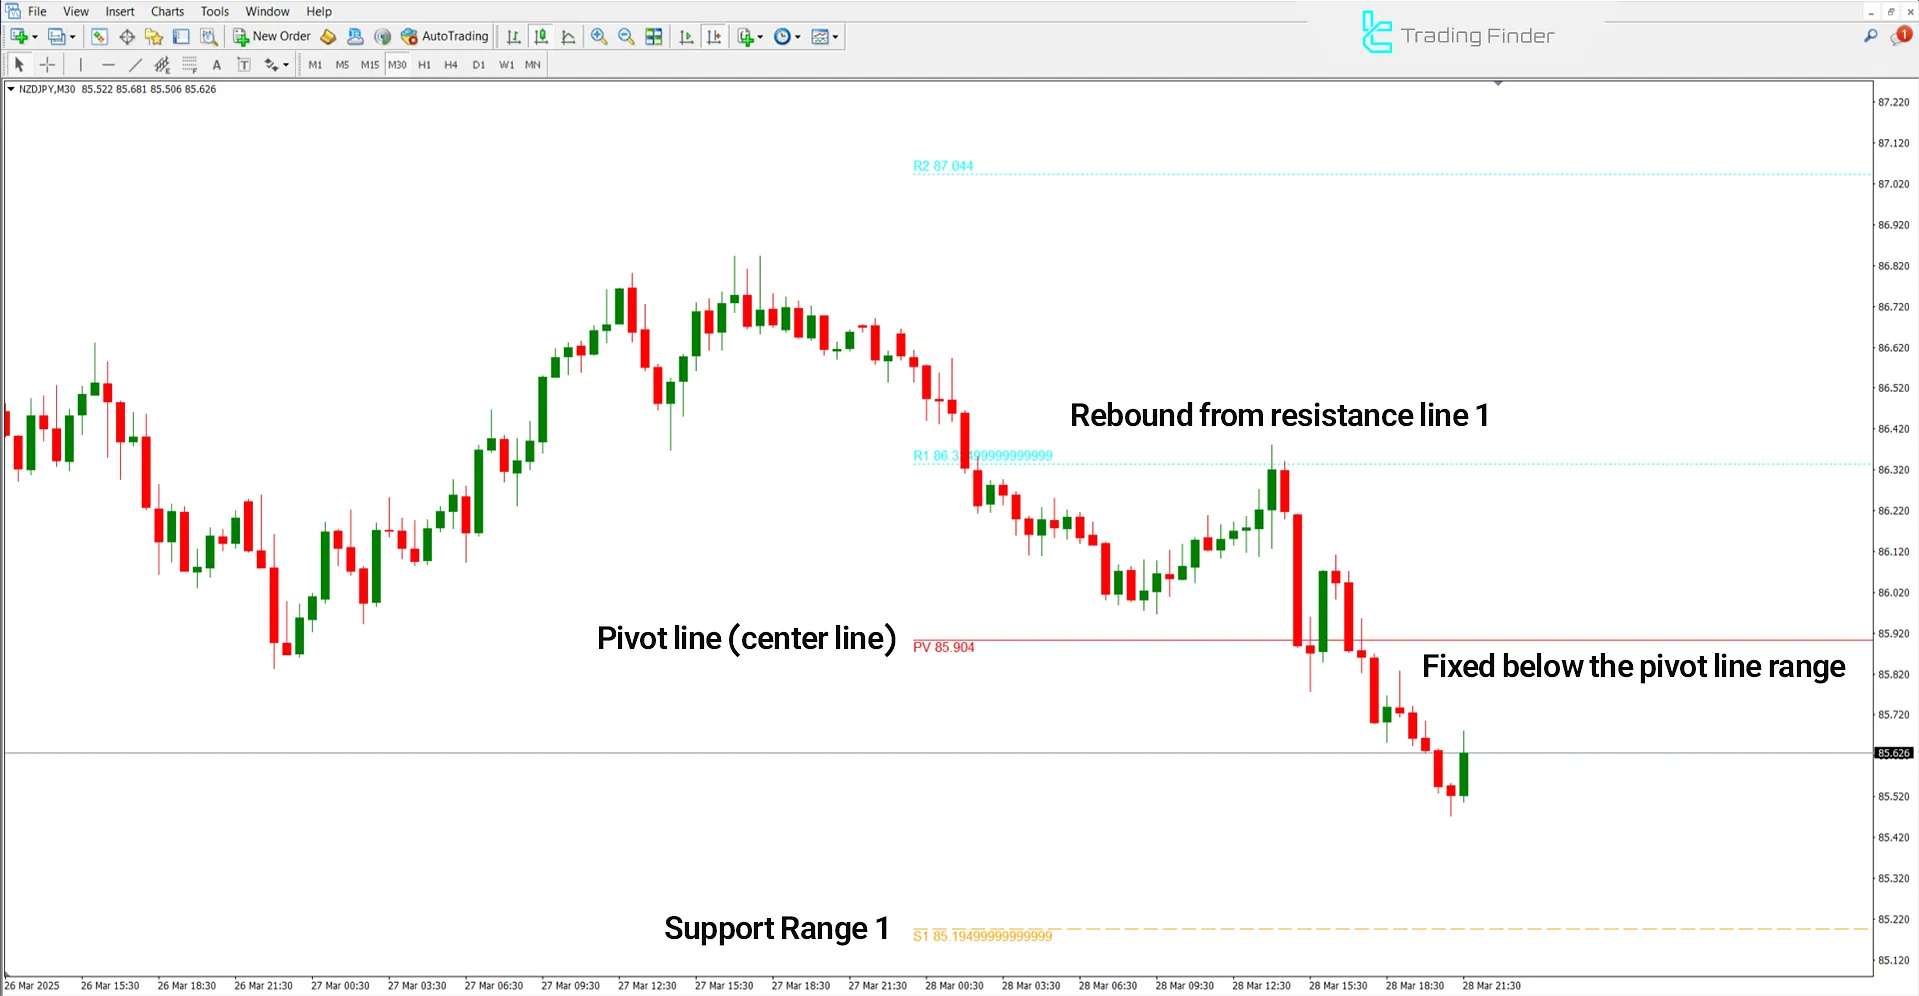
The image below displays the NZD/JPY currency pair chart in the 30-minute timeframe.
After the pullback to the resistance level (blue line) and stabilization below the central line (red line), this price behavior can be interpreted as confirmation of a continuing bearish trend. Under these conditions, the probability of the price moving toward the next support area increases.

Indicator Settings
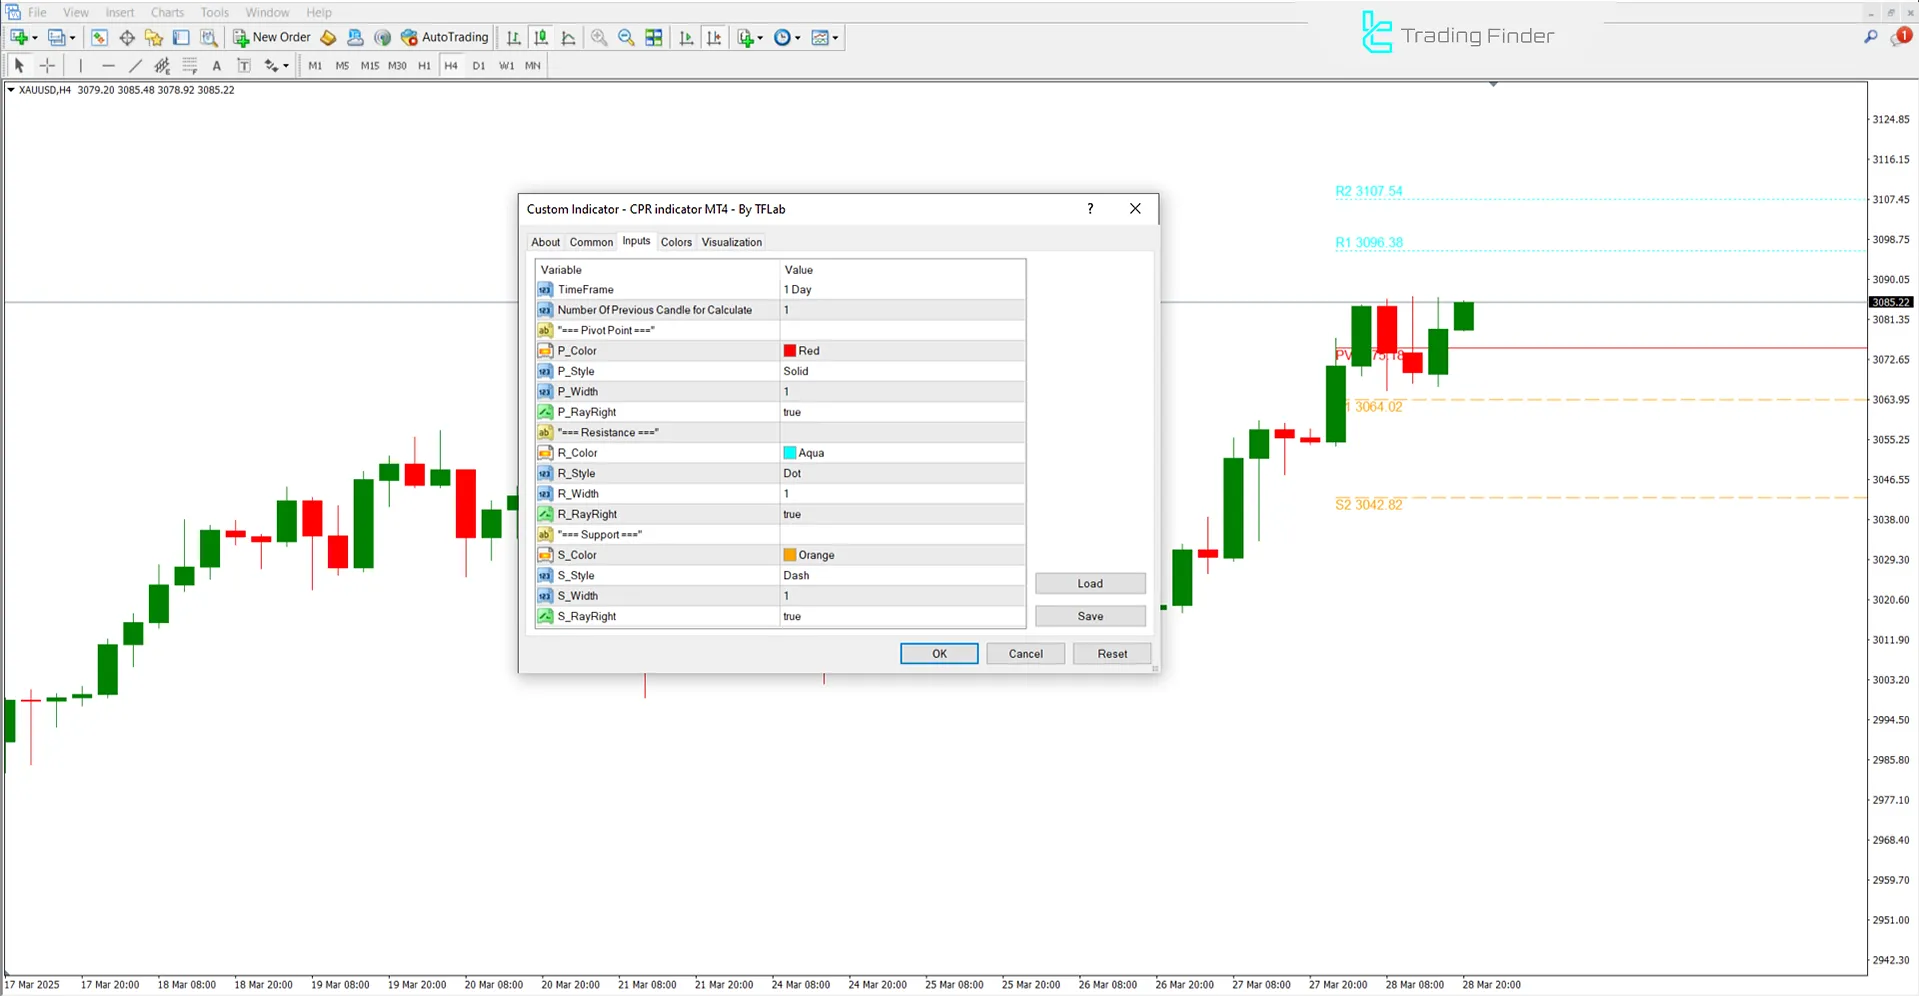
The following image displays the configuration details of the CPR (Central Pivot Range) indicator in MetaTrader 4:

- Timeframe: Time frame for indicator calculation
- Number Of Previous Candles for Calculate: Number of previous candles to calculate
- P_Color: Pivot line color
- P_Style: Pivot line style
- P_Width: Pivot line thickness
- P_RayRight: Extend the pivot line to the right
- R_Color: Resistance line color
- R_Style: Resistance line style
- R_Width: Resistance line thickness
- R_RayRight: Extend the resistance line to the right
- S_Color: Support line color
- S_Style: Support line style
- S_Width: Support line thickness
- S_RayRight: Extend the support line to the right
Conclusion
The CPR (Central Pivot Range) indicator is a technical analysis tool used to determine support and resistance levels and the potential direction of market trends. It is applicable to financial markets such as stocks, forex, and cryptocurrenciesand is highly popular among day traders.
CPR Central Pivot Range MT4 PDF
CPR Central Pivot Range MT4 PDF
Click to download CPR Central Pivot Range MT4 PDFWhat trading style is the CPR indicator suitable for?
This tool suits scalping, day trading, and swing trading strategies.
What is the CPR indicator?
CPR is a technical analysis indicator for identifying support, resistance levels, and potential market trend direction.


