![CISD - CSD + Price Gap Openings Indicator MT4 - Download - [TFlab]](https://cdn.tradingfinder.com/image/255474/13-78-en-cisd-csd-opening-gaps-mt4-01.webp)
![CISD - CSD + Price Gap Openings Indicator MT4 - Download - [TFlab] 0](https://cdn.tradingfinder.com/image/255474/13-78-en-cisd-csd-opening-gaps-mt4-01.webp)
![CISD - CSD + Price Gap Openings Indicator MT4 - Download - [TFlab] 1](https://cdn.tradingfinder.com/image/255475/13-78-en-cisd-csd-opening-gaps-mt4-02.webp)
![CISD - CSD + Price Gap Openings Indicator MT4 - Download - [TFlab] 2](https://cdn.tradingfinder.com/image/255473/13-78-en-cisd-csd-opening-gaps-mt4-03.webp)
![CISD - CSD + Price Gap Openings Indicator MT4 - Download - [TFlab] 3](https://cdn.tradingfinder.com/image/255472/13-78-en-cisd-csd-opening-gaps-mt4-04.webp)
The CISD – CSD + Price Gap Openings indicator can display "CISD" along with New Opening Caps. This MetaTrader 4 ICT indicator marks the "CISD" levels according to the filling of price gaps using arrow markers. The "CISD" zone indicates a trend reversal and market retracement.
CISD – CSD + Price Gap Openings Indicator Specifications Table
The following table shows the features and specifications of the CISD – CSD + Price Gap Openings Indicator.
Indicator Categories: | ICT MT4 Indicators Smart Money MT4 Indicators Signal & Forecast MT4 Indicators |
Platforms: | MetaTrader 4 Indicators |
Trading Skills: | Advanced |
Indicator Types: | Reversal MT4 Indicators |
Timeframe: | Multi-Timeframe MT4 Indicators |
Trading Style: | Day Trading MT4 Indicators |
Trading Instruments: | Stock Market MT4 Indicators Cryptocurrency MT4 Indicators Forex MT4 Indicators |
Indicator Overview
Price Gaps (OGs) are areas filled with liquidity and, therefore, targeted by price. This indicator displays price gaps as purple boxes. If the "Opening Gaps" zones lose validity, the purple boxes do not appear along the price.
Uptrend Conditions
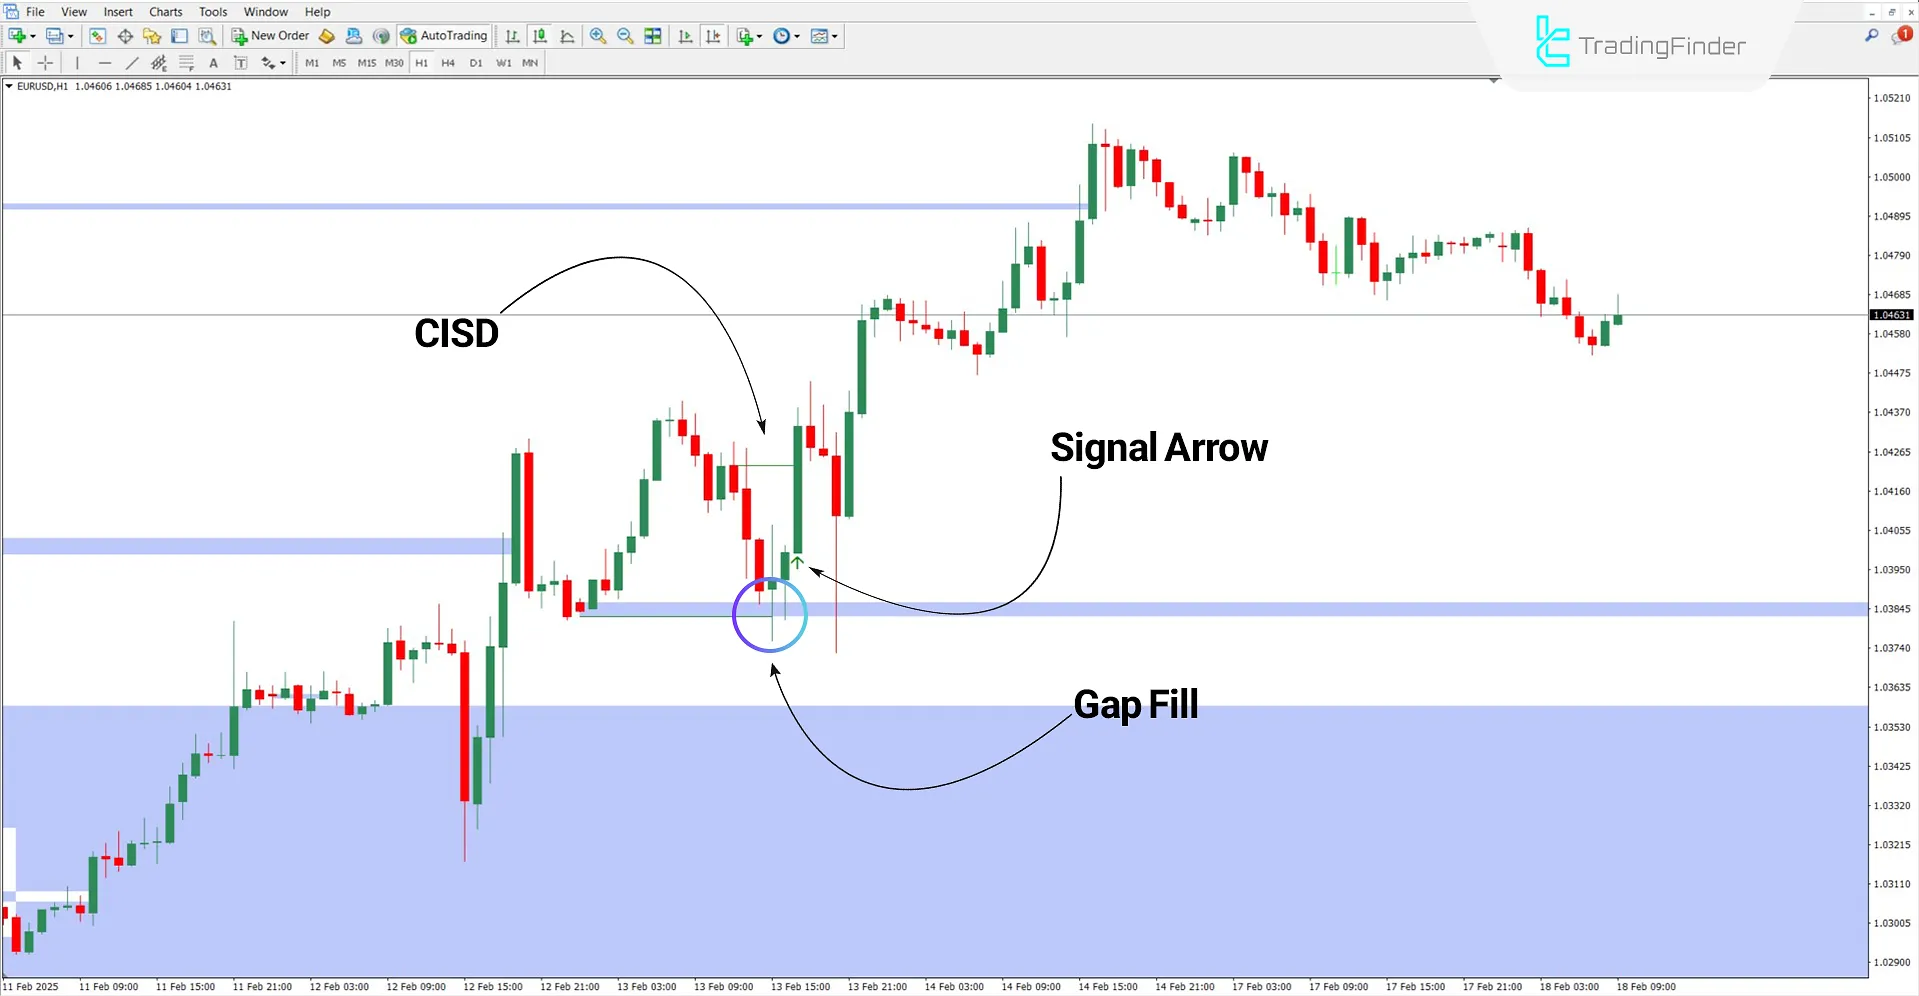
According to the 1-hour chart of the EUR/USD currency pair, the price fills the gap first, then retraces upwards, closing a bullish candle above the first non-similar colored candle.
In this condition, the indicator detects the CISD and highlights it with a green arrow.

Downtrend Conditions
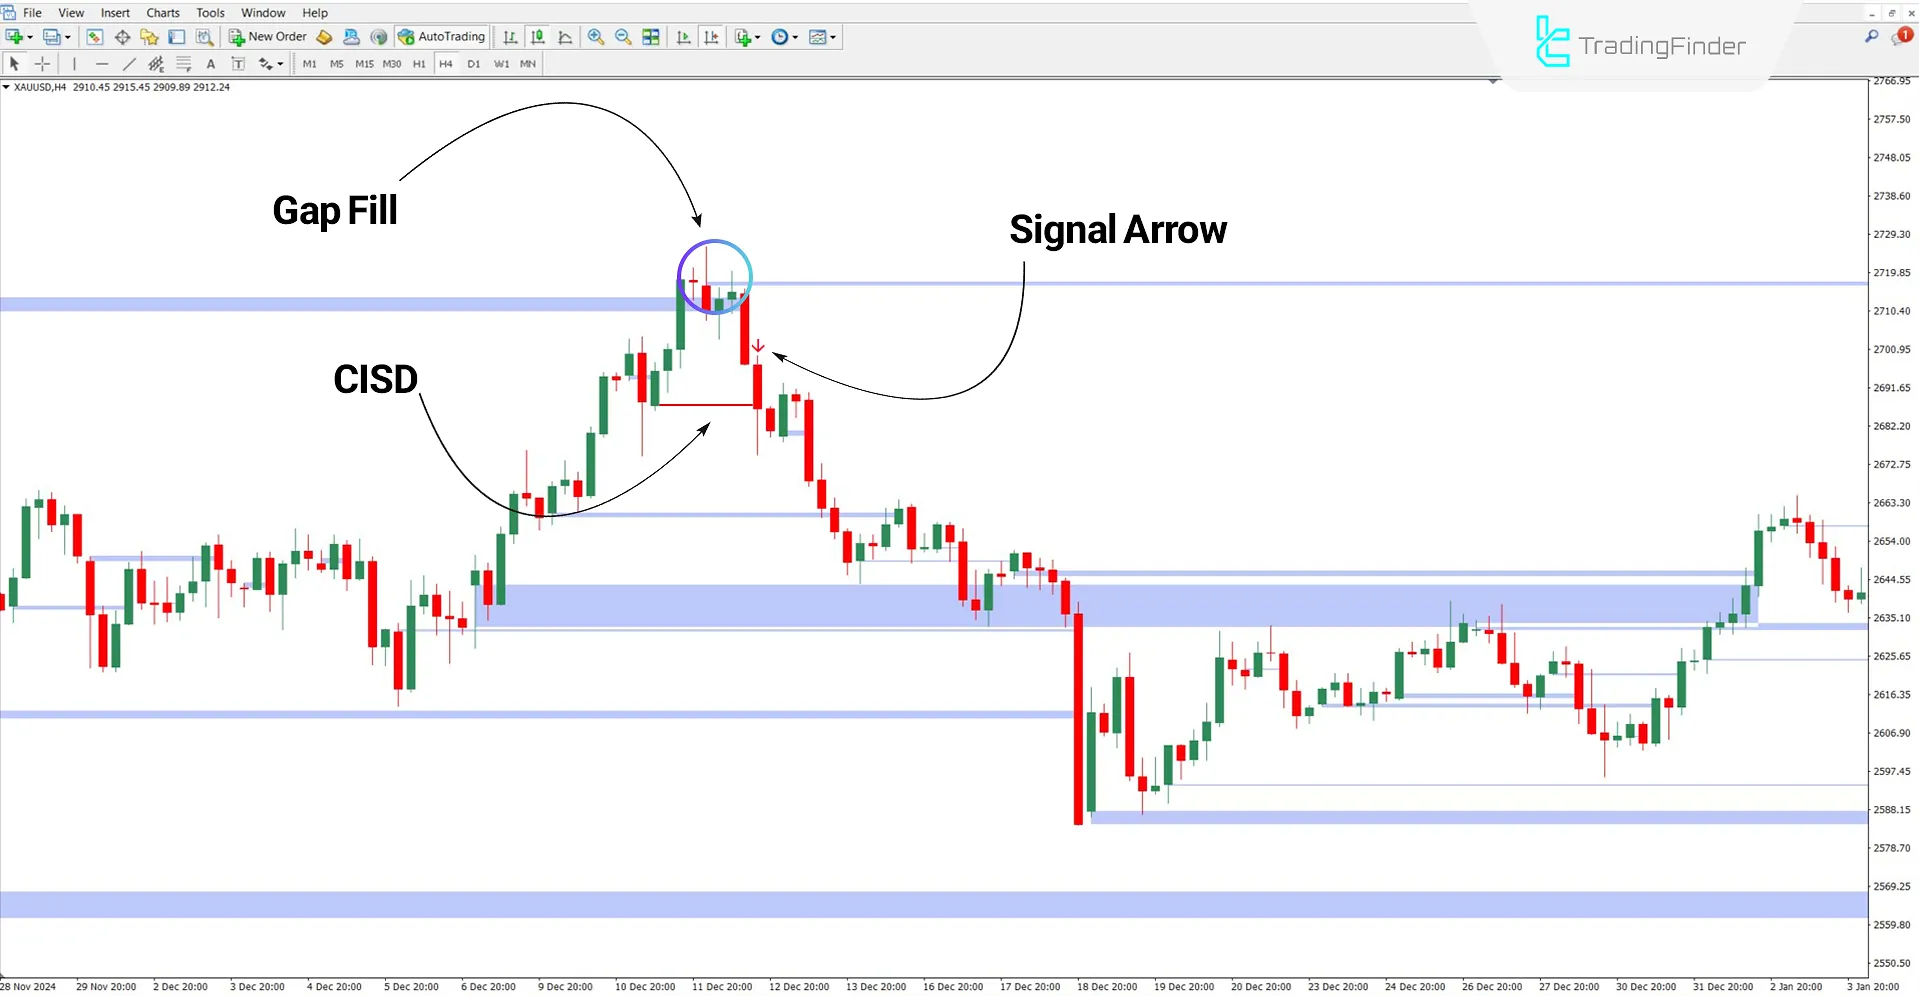
Based on the XAU/USD chart in the 4-hour timeframe, after filling the price gap, the price retraces downwards and closes a bearish candle lower than the first non-similar colored candle.
The CISD – CSD + Price Gap Openings Indicator displays the "CISD" with a red arrow.

CISD – CSD + OGs Indicator Settings
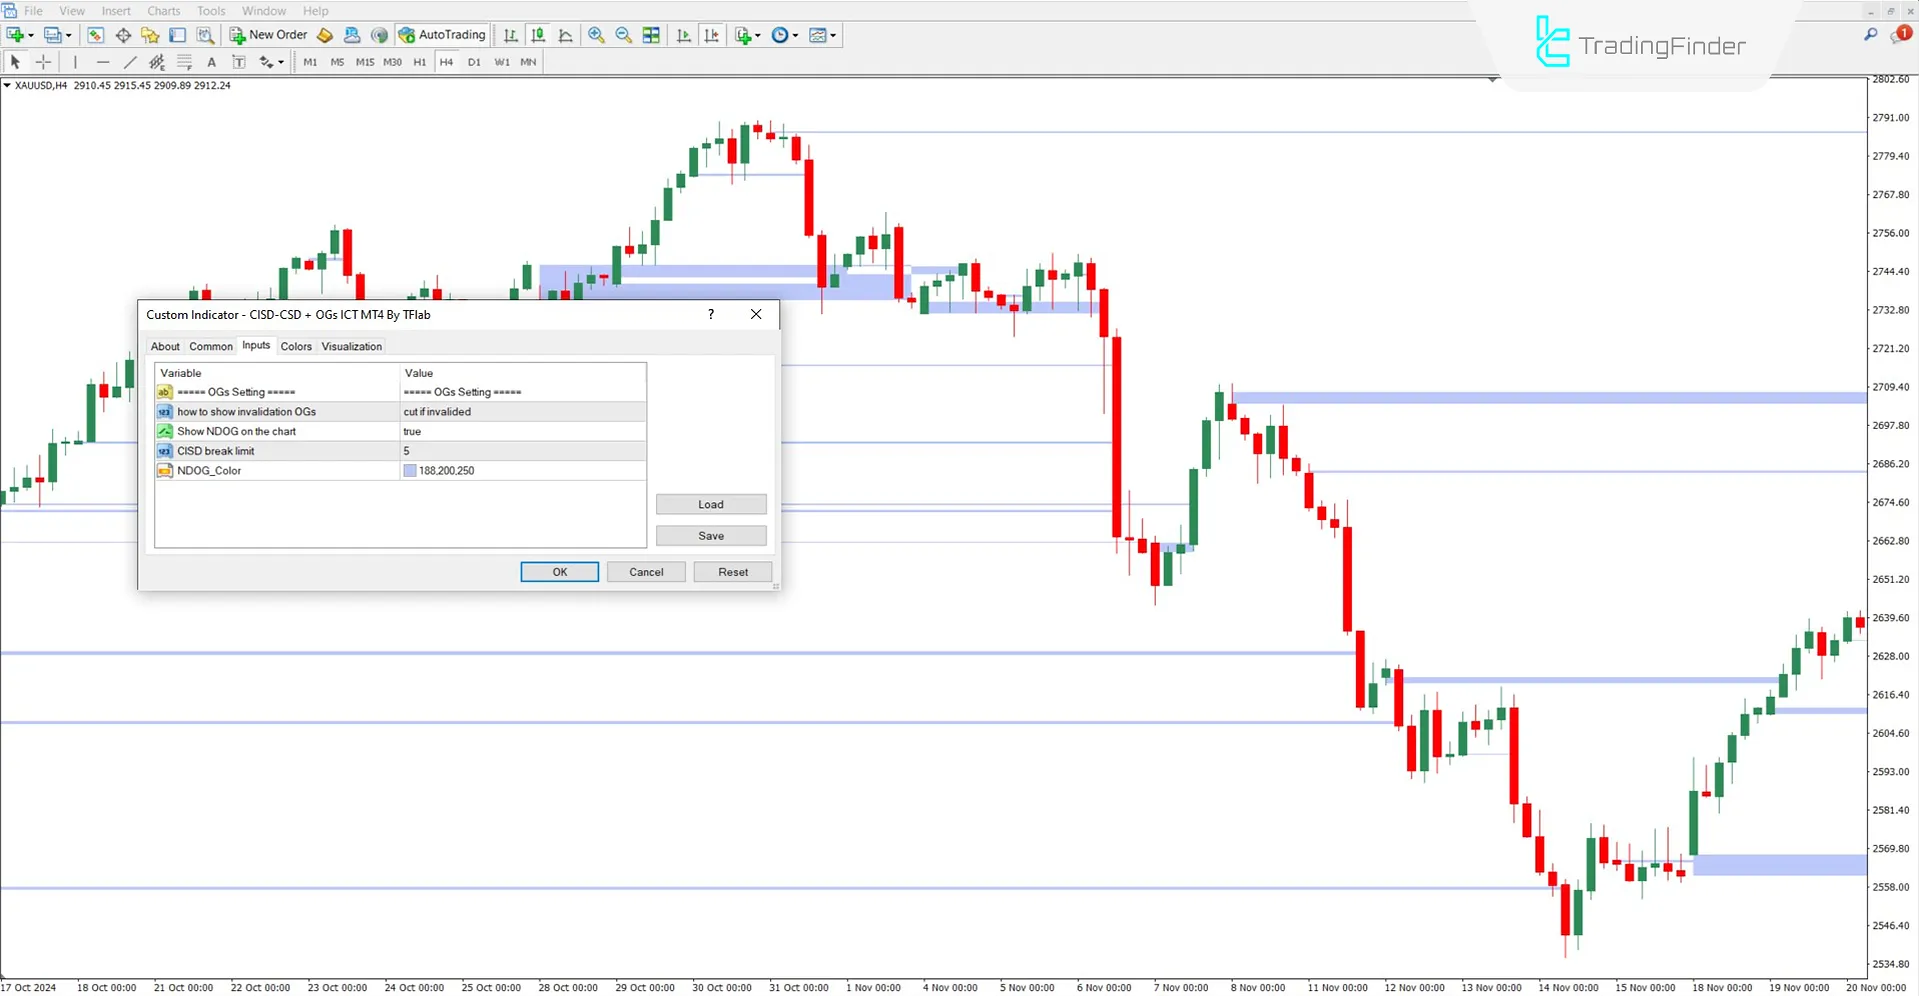
Image below shows the settings for the CISD – CSD + New Daily Price Gap indicator:

- How to show invalidation OGs: How to display invalidated zones
- Show NDOG on the chart: Show daily price gaps
- CISD break limit: Set the maximum number of allowed breaks for the "CISD" level before invalidation
- NDOG Color: Set the color of daily gap zones
Conclusion
The CISD- + Price Gap Openings indicator draws new daily gaps using purple boxes. This MetaTrader 4 signal and forecasting indicator is designed based on ICT Style principles and helps traders identify optimal entry points.
The CISD zones typically indicate trend reversals; therefore, arrow displays can be seen as signals for trade entry.
CISD CSD Price Gap MT4 PDF
CISD CSD Price Gap MT4 PDF
Click to download CISD CSD Price Gap MT4 PDFCan this indicator be used on higher timeframes?
Yes, this indicator is multi-timeframe and can be used on all timeframes.
Is knowledge of ICT required to use this indicator?
This indicator is suitable for traders who follow liquidity-based styles like ICT and Smart Money.


