


On June 22, 2025, in version 2, alert/notification functionality was added to this indicator
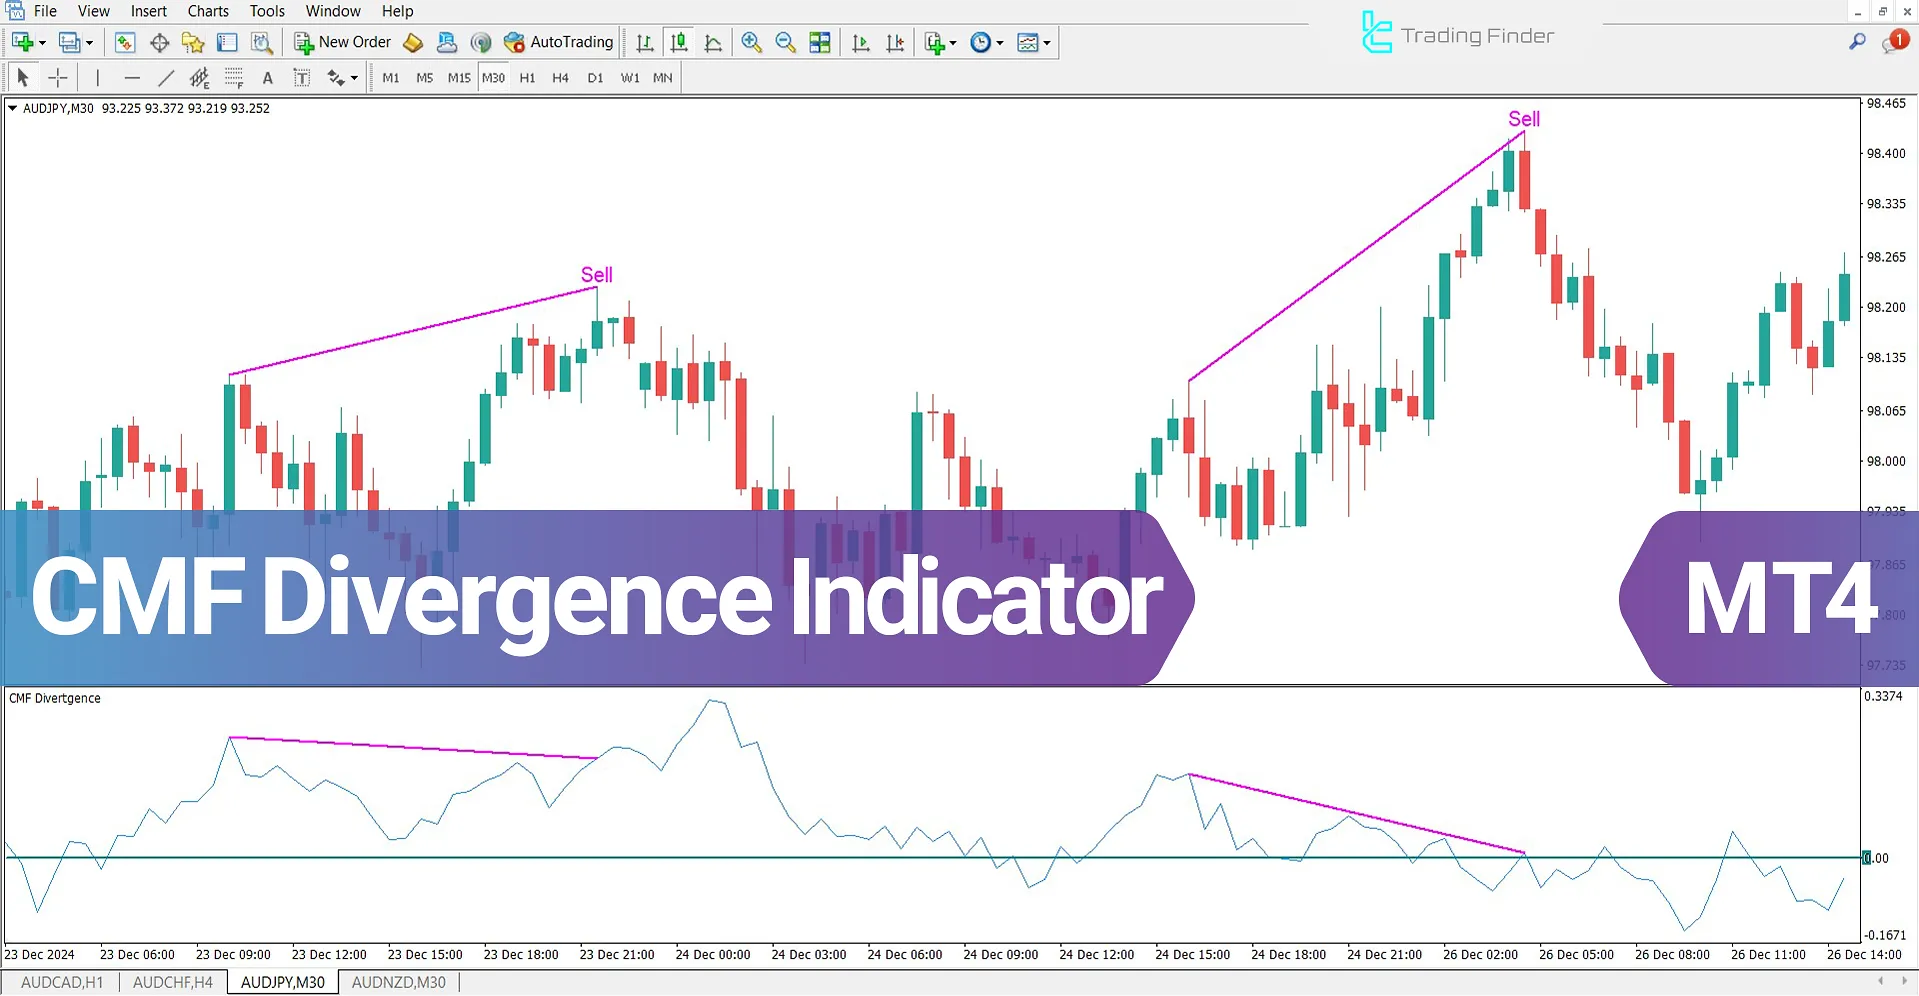
The Chaikin Money Flow Divergence indicator is a practical tool in technical analysis that combines the strength of money flow with divergence signals.
This MetaTrader 4 oscillator is an advanced version of the Chaikin Money Flow (CMF) indicator, which not only evaluates buying and selling pressure but also detects divergences between price and liquidity volume, generating trading signals.
CMF Divergence Indicator Specifications
The key features of the CMF Divergence Oscillator are summarized in the table below:
Indicator Categories: | Oscillators MT4 Indicators Signal & Forecast MT4 Indicators Trading Assist MT4 Indicators |
Platforms: | MetaTrader 4 Indicators |
Trading Skills: | Intermediate |
Indicator Types: | Leading MT4 Indicators Reversal MT4 Indicators |
Timeframe: | Multi-Timeframe MT4 Indicators |
Trading Style: | Day Trading MT4 Indicators |
Trading Instruments: | Share Stocks MT4 Indicators Forward Market MT4 Indicators Indices Market MT4 Indicators Stock Market MT4 Indicators Cryptocurrency MT4 Indicators Forex MT4 Indicators |
Indicator Overview
The CMF Divergence Indicator fluctuates between -1 and +1, making it useful for trend confirmation and identifying trading signals:
- Positive Divergence: When the price forms lower lows but CMF registers higher lows, it signals a decrease in selling pressure, increasing the likelihood of a bullish reversal. On the chart, this divergence is represented by a blue line
- Negative Divergence: When the price forms higher highs but CMF registers lower highs, it signals weakening buying pressure and a higher probability of correction or a bearish trend shift. This divergence is represented by a pink line on the chart
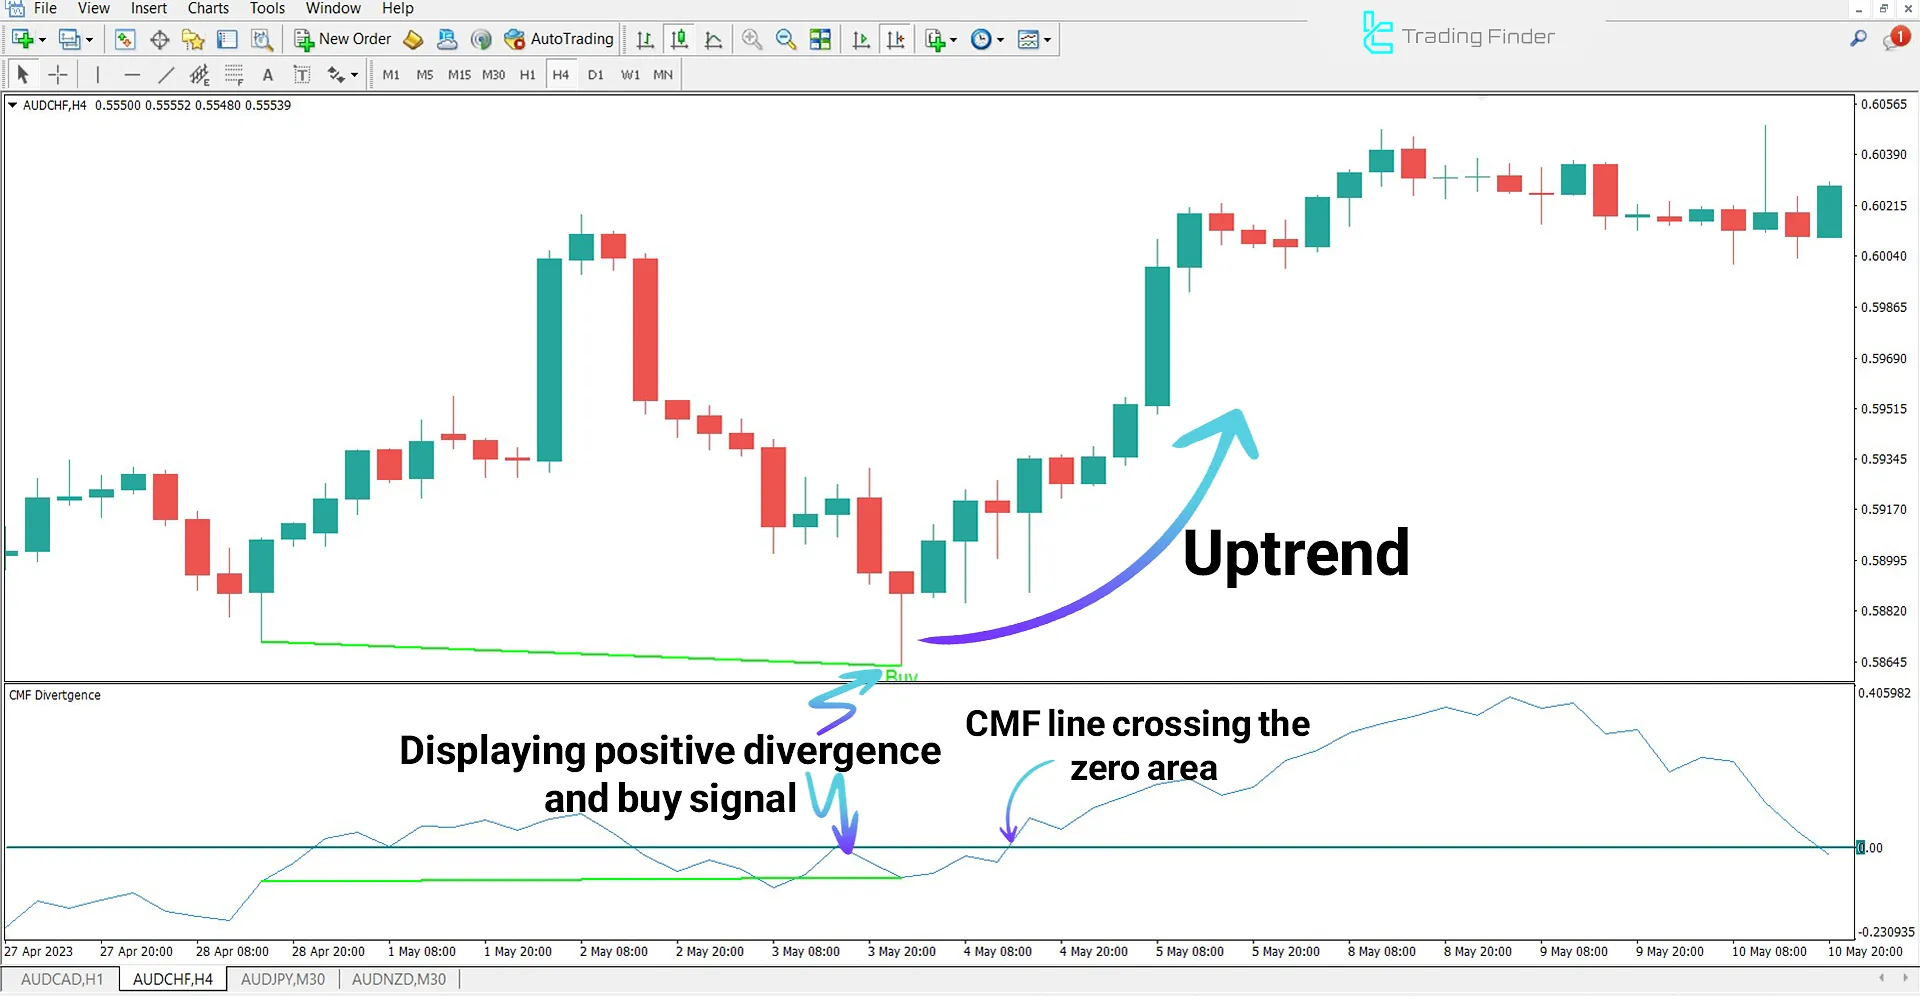
Indicator in an Uptrend
In the AUD/CHF uptrend, after confirming positive divergence, the price starts rising, and the indicator generates a buy signal.
If CMF crosses above the zero line, this further strengthens the trend's validity.
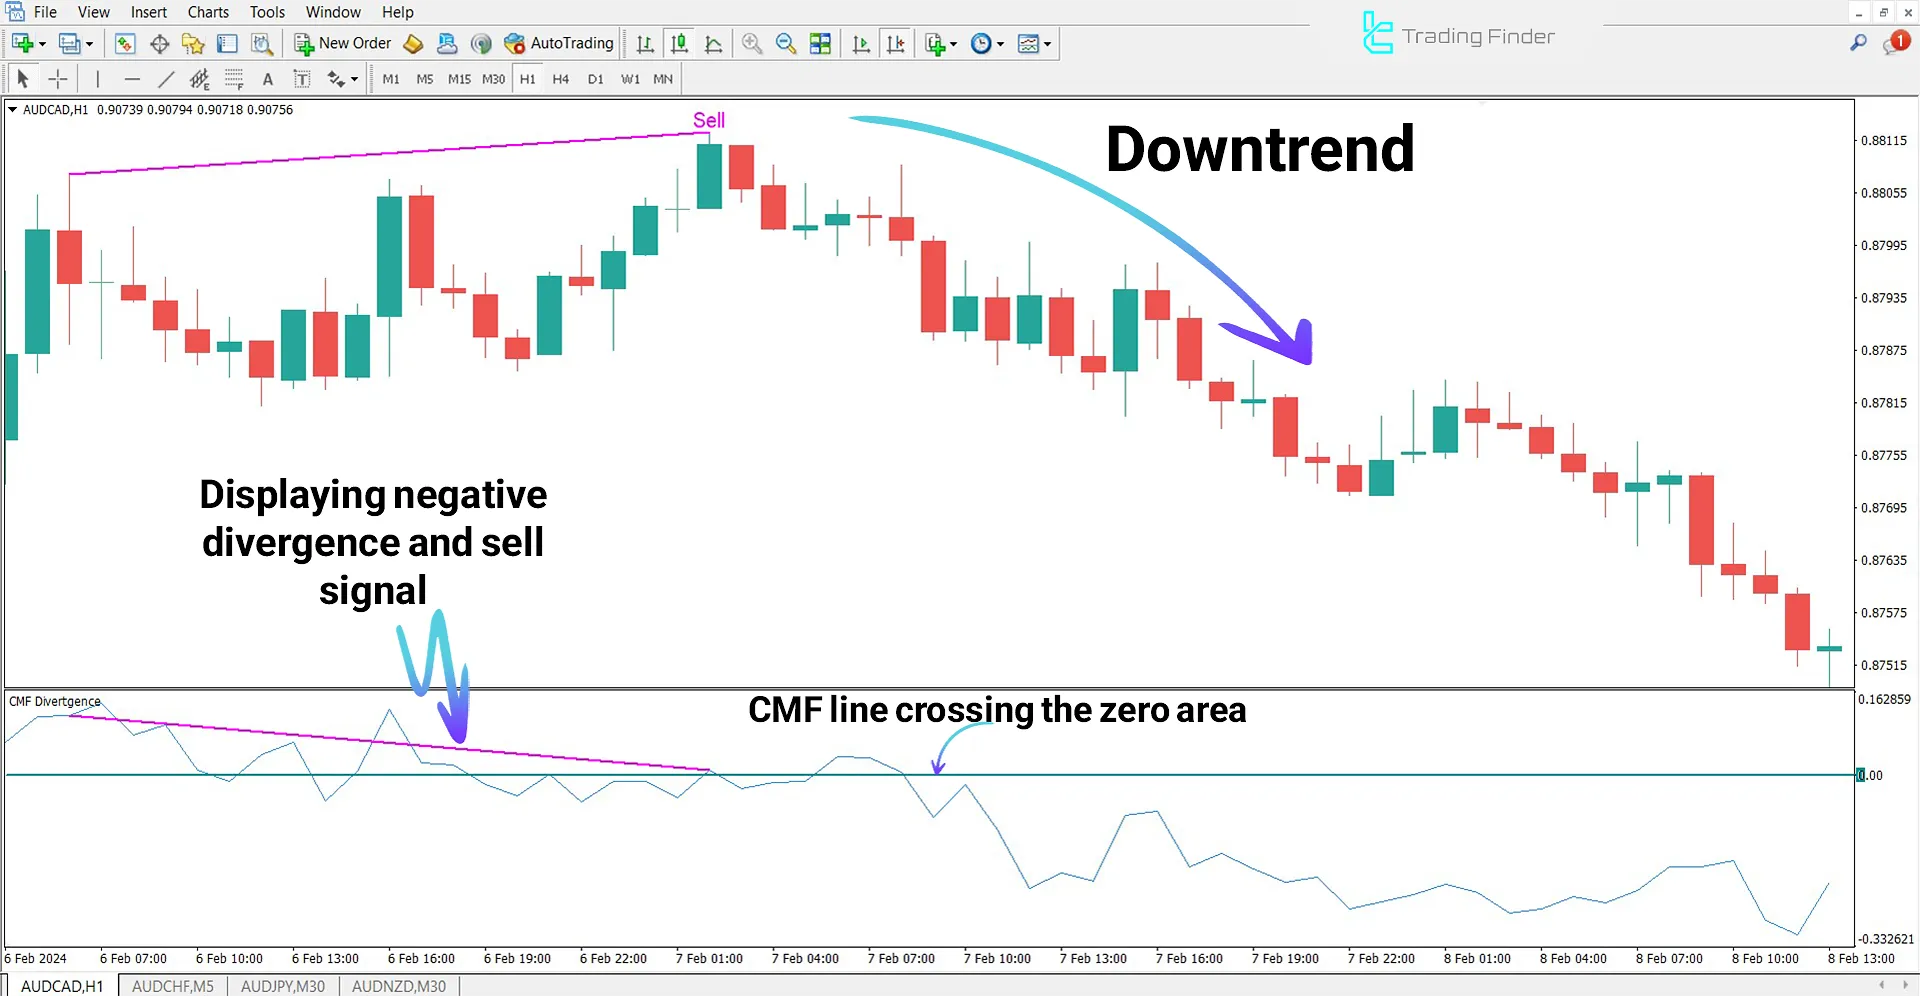
Indicator in a Downtrend
In the AUD/CAD 1-hour chart, after detecting a divergence between price and CMF oscillator, the indicator issues a sell signal.
When the CMF line crosses below zero, the bearish trend becomes more reliable.
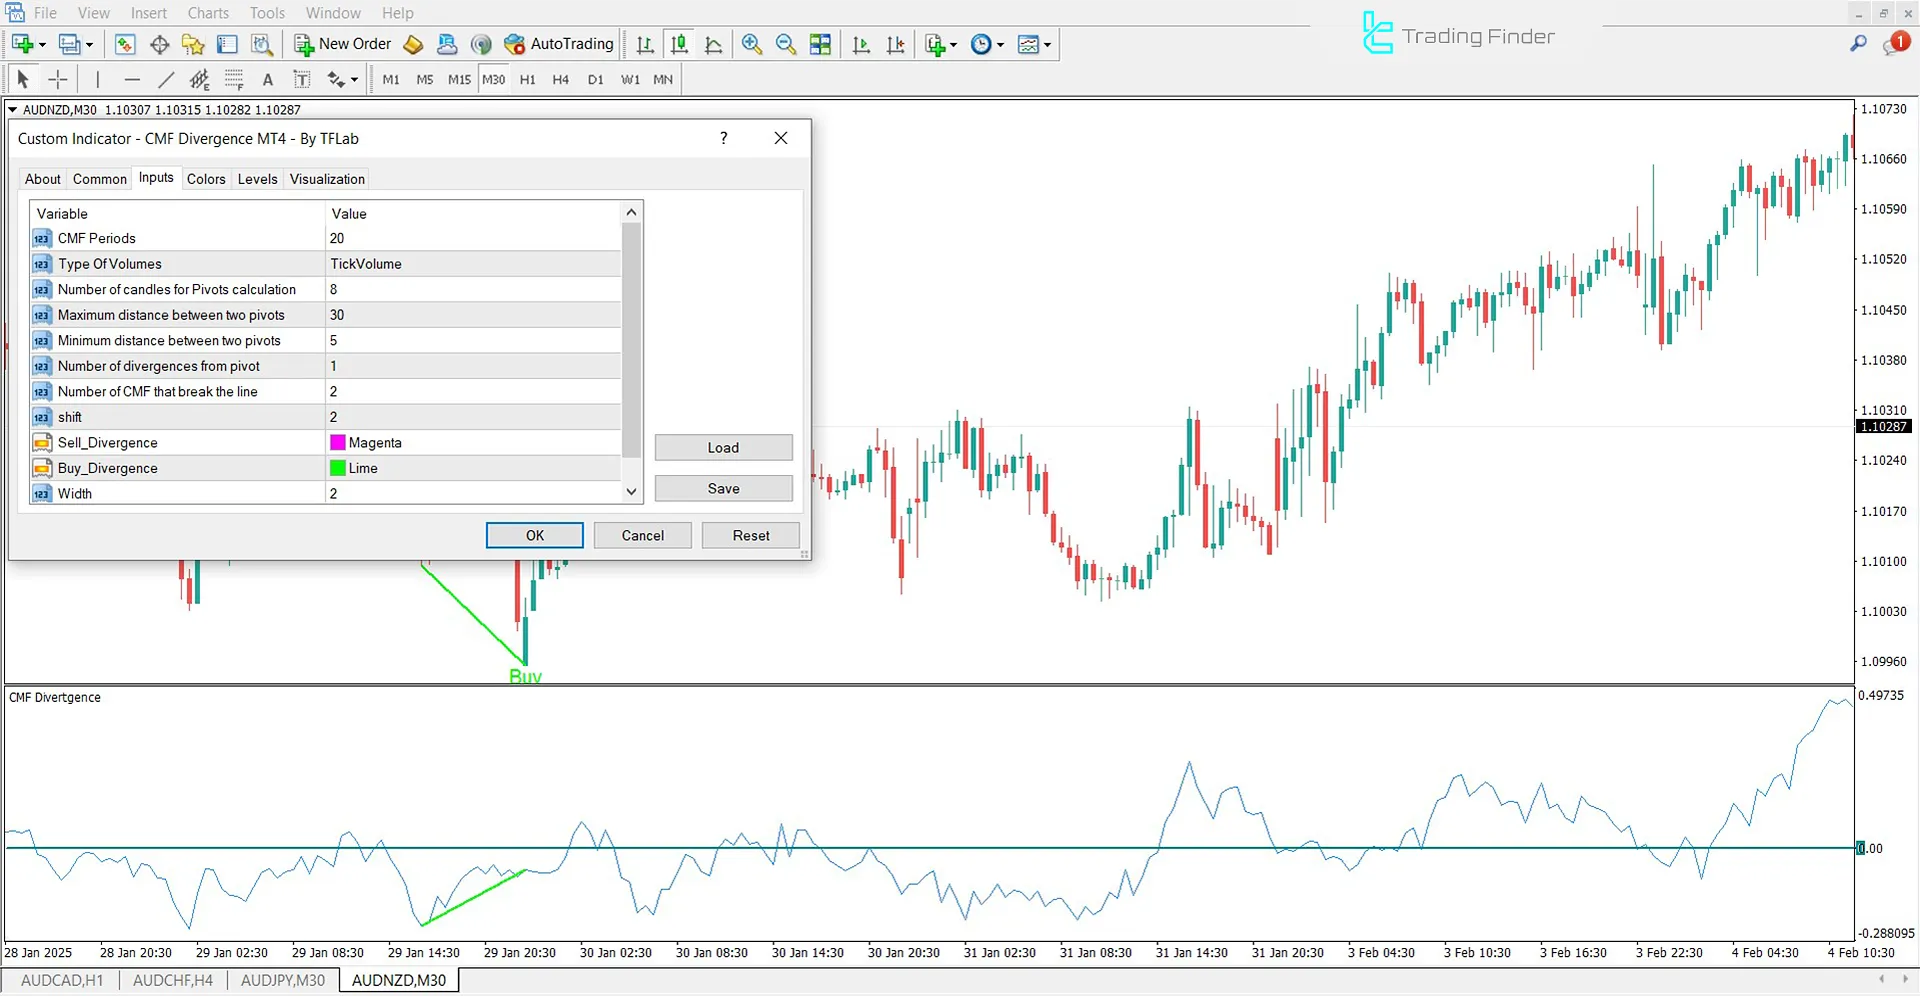
CMF Divergence Indicator Settings
The settings panel for the CMF Divergence Indicator is displayed in the image below:
- CMF Periods: Calculation period for CMF
- Type Of Volumes: Volume calculation type for the indicator
- Number of candles for Pivots calculation: Number of candles used for pivot calculations
- Maximum distance between two pivots: Maximum distance between two pivots
- Minimum distance between two pivots: Minimum distance between pivots
- Number of divergences from pivot: Number of divergences detected from a pivot
- Number of CCI that break the line: Number of CCI line breaks
- Shift: Price shift value
- Sell Divergence: Color of the sell divergence signal
- Buy Divergence: Color of the buy divergence signal
- Width: Line thickness
Conclusion
The Chaikin Money Flow Divergence Indicator is an advanced and hybrid trading tool that not only analyzes market liquidity flow but also detects divergences between price and money flow volume, generating trading signals.
This MetaTrader 4 trading tool is used to confirm trend direction and identify the best entry and exit points across various markets, such as Forex.
Chaikin Money Flow Divergence MT4 PDF
Chaikin Money Flow Divergence MT4 PDF
Click to download Chaikin Money Flow Divergence MT4 PDFWhat is the Chaikin Money Flow Divergence Indicator (CMF Divergence)?
This indicator is a hybrid tool in technical analysis, which evaluates market liquidity flow, detects divergences between price and money flow volume, and provides buy and sell signals.
How is CMF Divergence different from the classic CMF Indicator?
The classic CMF only evaluates liquidity flow, while the CMF Divergence Indicator not only does this but also detects positive and negative divergences and generates trading signals.


