![Corrected RSX Indicator for MetaTrader 4 Download - [TradingFinder]](https://cdn.tradingfinder.com/image/344535/2-46-en-corrected-rsx-mt4-1.webp)
![Corrected RSX Indicator for MetaTrader 4 Download - [TradingFinder] 0](https://cdn.tradingfinder.com/image/344535/2-46-en-corrected-rsx-mt4-1.webp)
![Corrected RSX Indicator for MetaTrader 4 Download - [TradingFinder] 1](https://cdn.tradingfinder.com/image/344530/2-46-en-corrected-rsx-mt4-2.webp)
![Corrected RSX Indicator for MetaTrader 4 Download - [TradingFinder] 2](https://cdn.tradingfinder.com/image/344540/2-46-en-corrected-rsx-mt4-3.webp)
![Corrected RSX Indicator for MetaTrader 4 Download - [TradingFinder] 3](https://cdn.tradingfinder.com/image/344531/2-46-en-corrected-rsx-mt4-4.webp)
The Corrected RSX Indicator is an optimized version of the RSI indicator on the MetaTrader 4 platform.
This technical analysis oscillator provides clearer signals by filtering out noise in the RSI output. Like the RSI, the RSX indicator highlights overbought regions in orange and oversold regions in blue.
Corrected RSX Specifications Table
The table below outlines the key features of the Corrected RSX Indicator.
Indicator Categories: | Oscillators MT4 Indicators Currency Strength MT4 Indicators Trading Assist MT4 Indicators |
Platforms: | MetaTrader 4 Indicators |
Trading Skills: | Intermediate |
Indicator Types: | Range MT4 Indicators Reversal MT4 Indicators |
Timeframe: | Multi-Timeframe MT4 Indicators |
Trading Style: | Intraday MT4 Indicators |
Trading Instruments: | Share Stocks MT4 Indicators Cryptocurrency MT4 Indicators Forex MT4 Indicators |
Uptrend Conditions
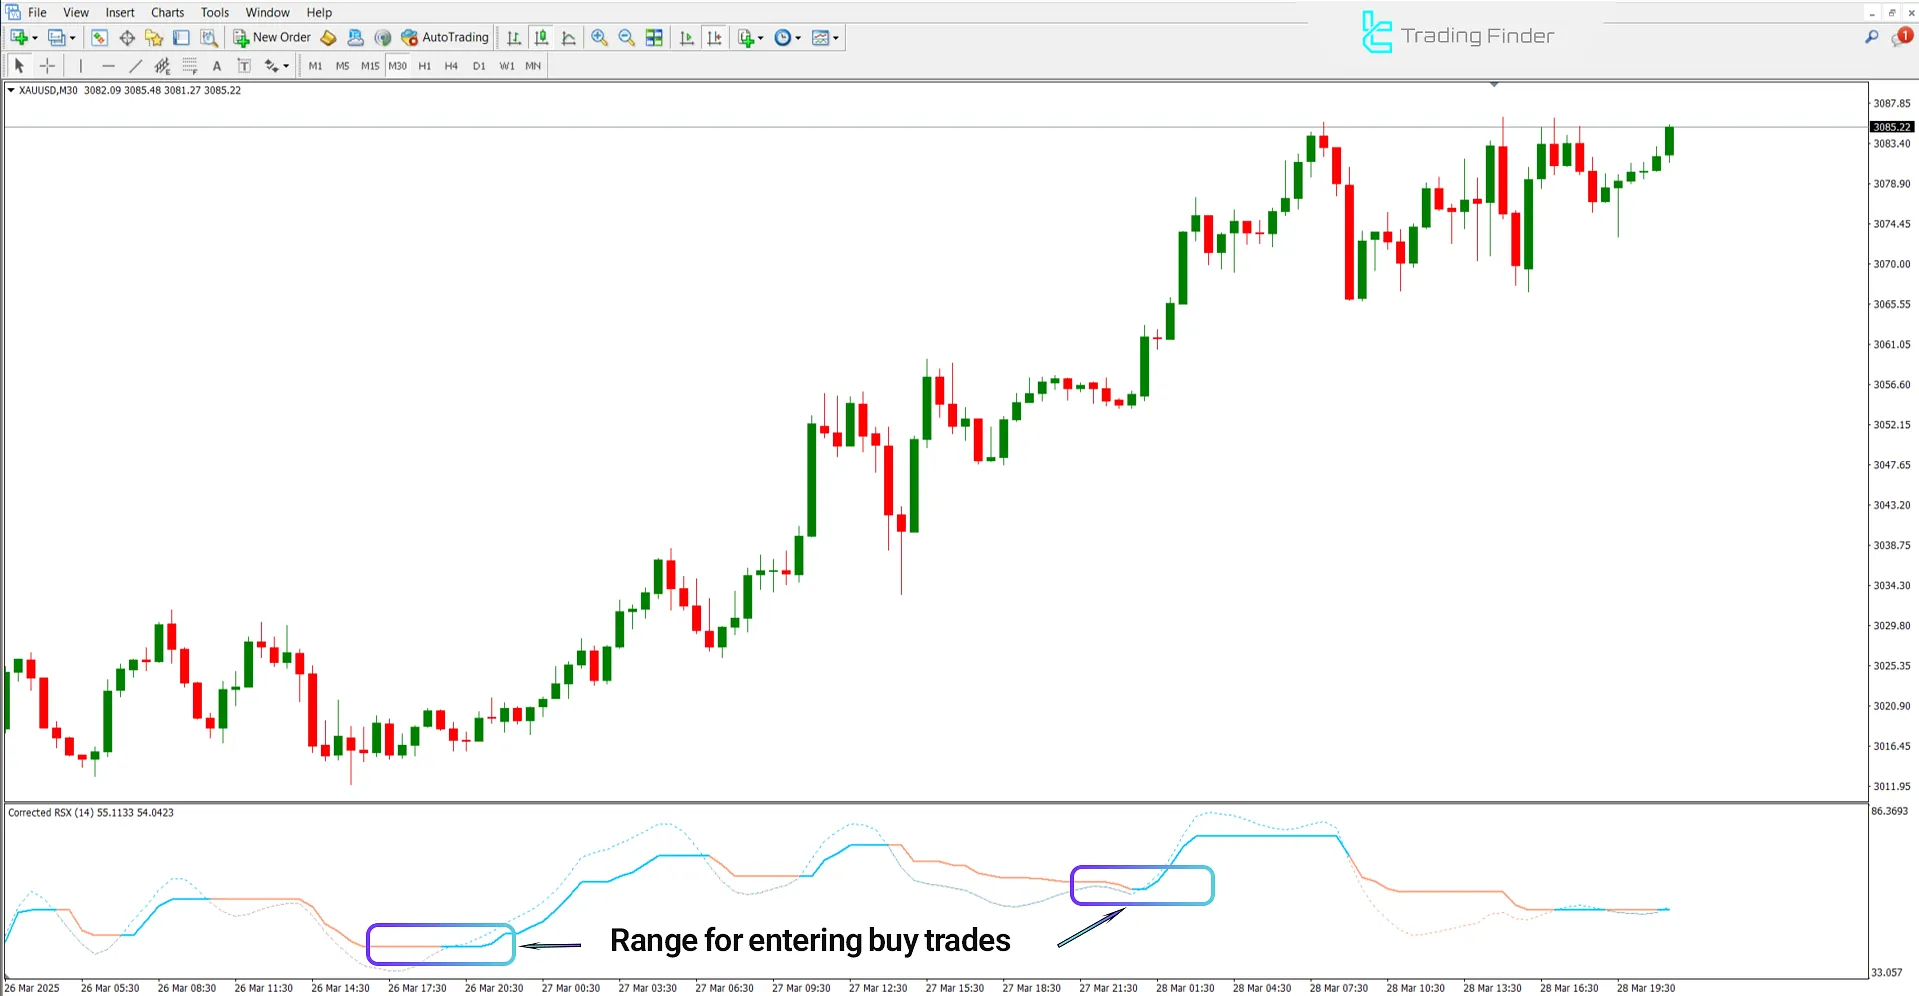
In the 30-minute chart of spot gold (XAUUSD), a buy signal is issued when the dashed line of the RSX Indicator turns blue and starts to move upwards.
If this color change and direction shift occur within the oversold region, the likelihood of a trend reversal significantly increases. This creates a range for entering buy trades.

Downtrend Conditions
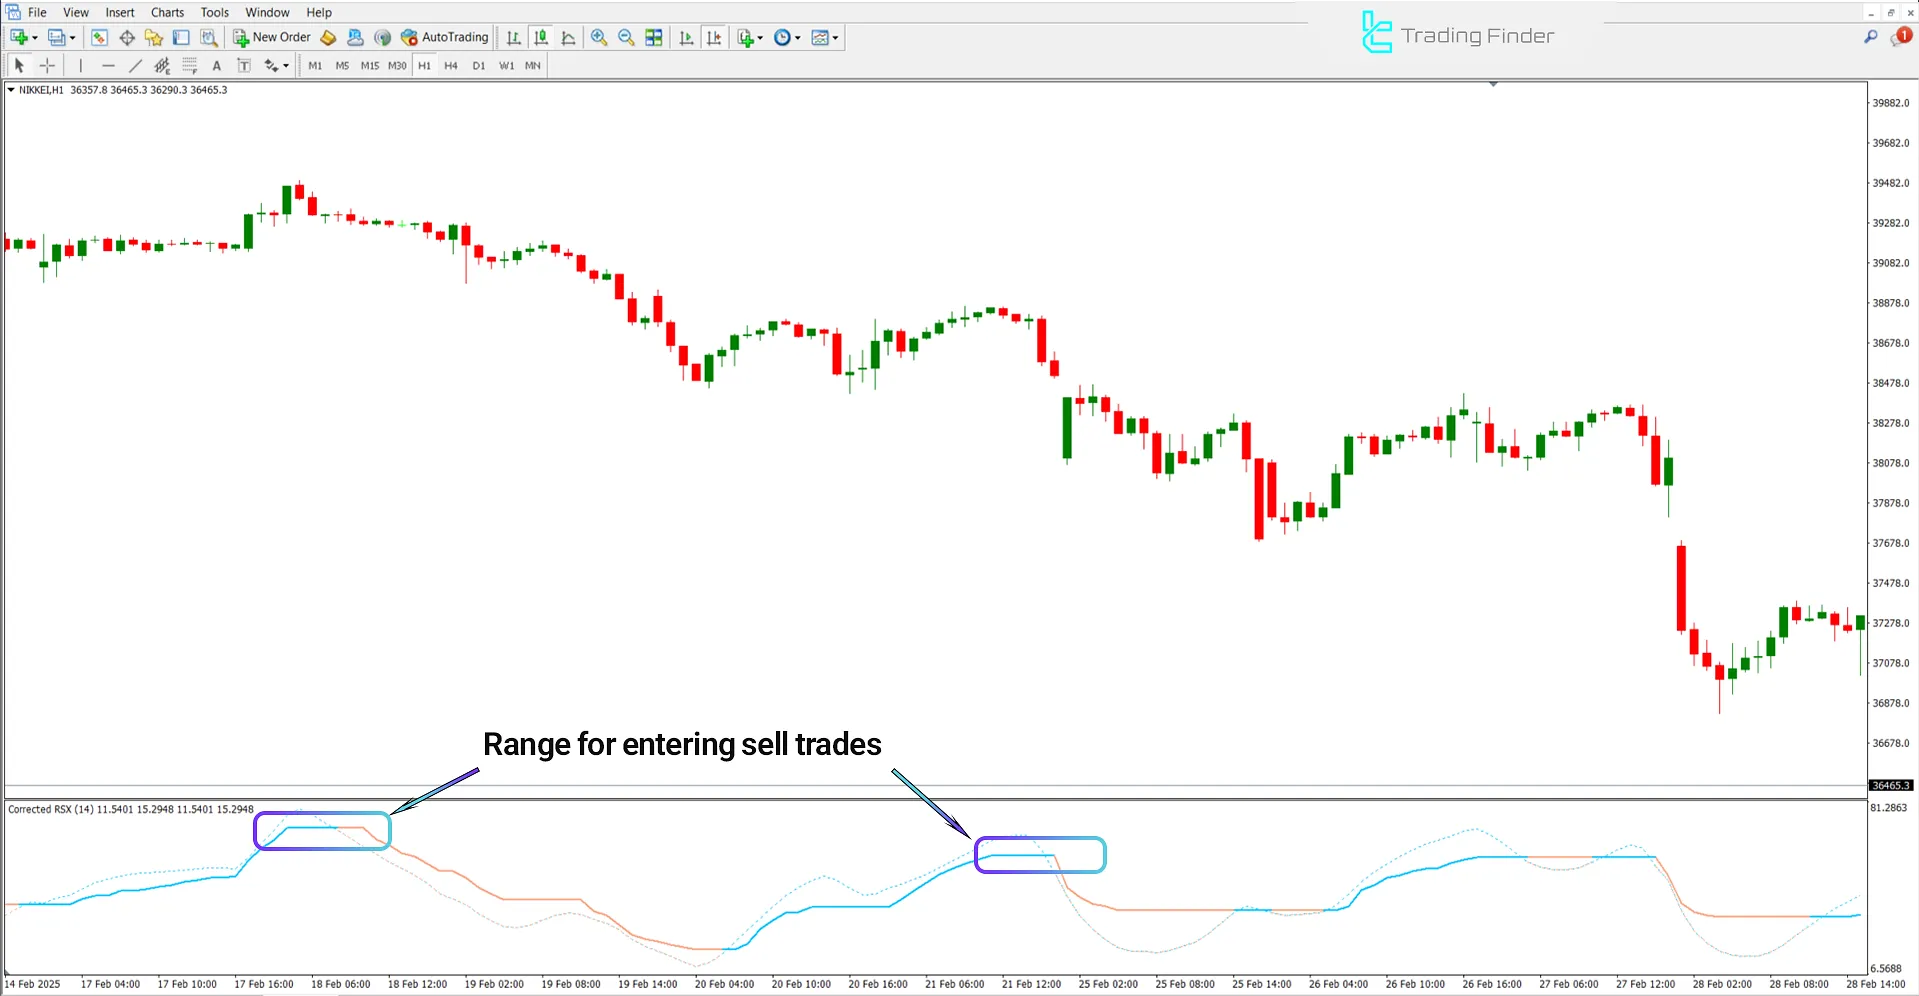
The chart below shows the NIKKEI stock in a 1-hour timeframe. If the dashed RSX line moves downward and turns orange, especially if the price is in the overbought region, it strongly indicates a potential trend reversal and the right time to enter a sell position.

Indicator Settings
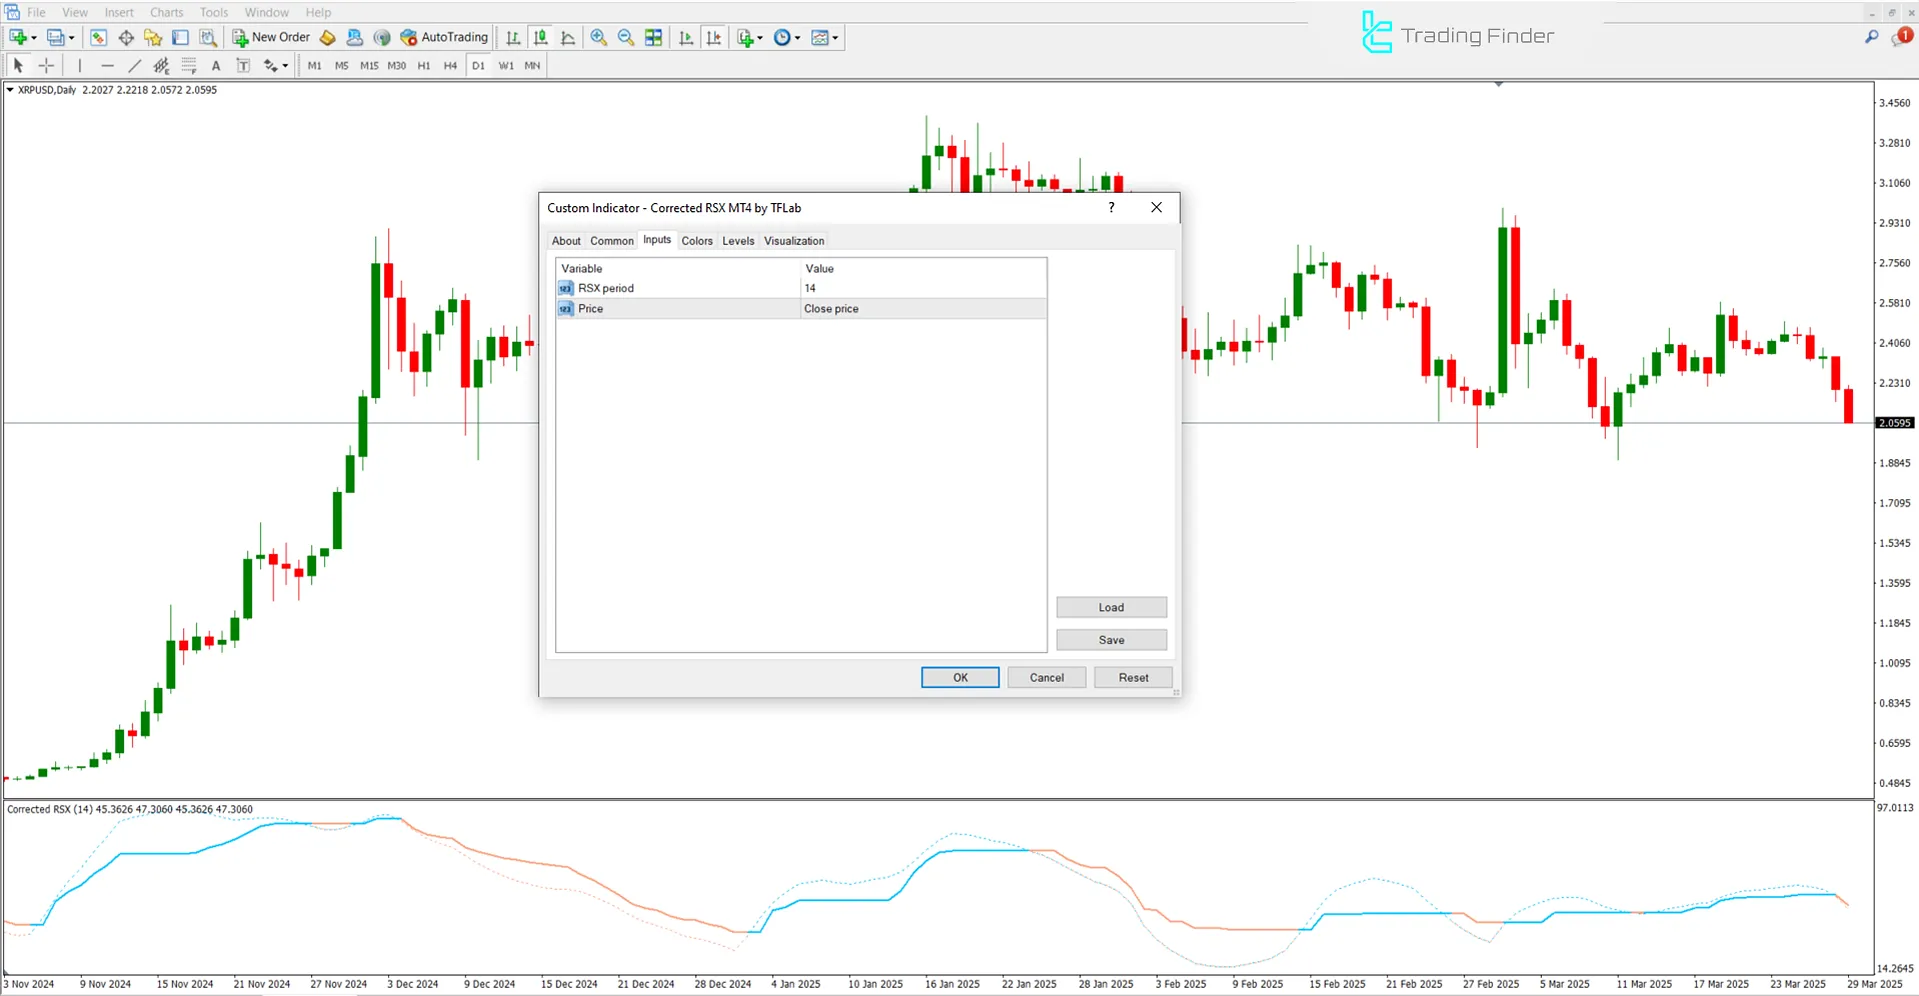
The image below shows the customizable settings for the Corrected RSX Indicator:

- RSX Period: RSX period
- Price: Price
Conclusion
The Corrected RSX Indicator filters price noise and accurately identifies entry and exit points. The presence of the colored moving average line, which changes color according to market trends, enhances the validity of the signals.
This indicator is an excellent tool for technical traders, especially in identifying divergences and confirming trend reversals.
Corrected RSX MT4 PDF
Corrected RSX MT4 PDF
Click to download Corrected RSX MT4 PDFDoes the Corrected RSX Oscillator generate entry and exit signals?
No; the Corrected RSX Indicator marks the entry and exit zones by changing the color of the lines.
Is the Corrected RSX Indicator useful in a range-bound market?
The Corrected RSX Indicator can also be used in range-bound market conditions.


