![Cracking Correlation (ICT) Indicator for MetaTrader 4 Download – [TFlab]](https://cdn.tradingfinder.com/image/262412/13-81-en-cracking-correlation-mt4-01.webp)
![Cracking Correlation (ICT) Indicator for MetaTrader 4 Download – [TFlab] 0](https://cdn.tradingfinder.com/image/262412/13-81-en-cracking-correlation-mt4-01.webp)
![Cracking Correlation (ICT) Indicator for MetaTrader 4 Download – [TFlab] 1](https://cdn.tradingfinder.com/image/262411/13-81-en-cracking-correlation-mt4-02.webp)
![Cracking Correlation (ICT) Indicator for MetaTrader 4 Download – [TFlab] 2](https://cdn.tradingfinder.com/image/262410/13-81-en-cracking-correlation-mt4-03.webp)
![Cracking Correlation (ICT) Indicator for MetaTrader 4 Download – [TFlab] 3](https://cdn.tradingfinder.com/image/262413/13-81-en-cracking-correlation-mt4-04.webp)
The Cracking Correlation indicator, a smart money indicator for MT4, is designed to identify periods during which the correlation between three assets such as "DJI," "ND100," and "SP500" changes.
Highly correlated symbols usually move in similar directions. However, this correlation can sometimes break down. This trading tool highlights these correlation breaks using lines.
Cracking Correlation Indicator Specifications
The table below highlights the key features of the Cracking Correlation Indicator.
Indicator Categories: | ICT MT4 Indicators Smart Money MT4 Indicators Liquidity MT4 Indicators |
Platforms: | MetaTrader 4 Indicators |
Trading Skills: | Advanced |
Indicator Types: | Reversal MT4 Indicators |
Timeframe: | Multi-Timeframe MT4 Indicators |
Trading Style: | Day Trading MT4 Indicators |
Trading Instruments: | Stock Market MT4 Indicators |
Indicator Overview
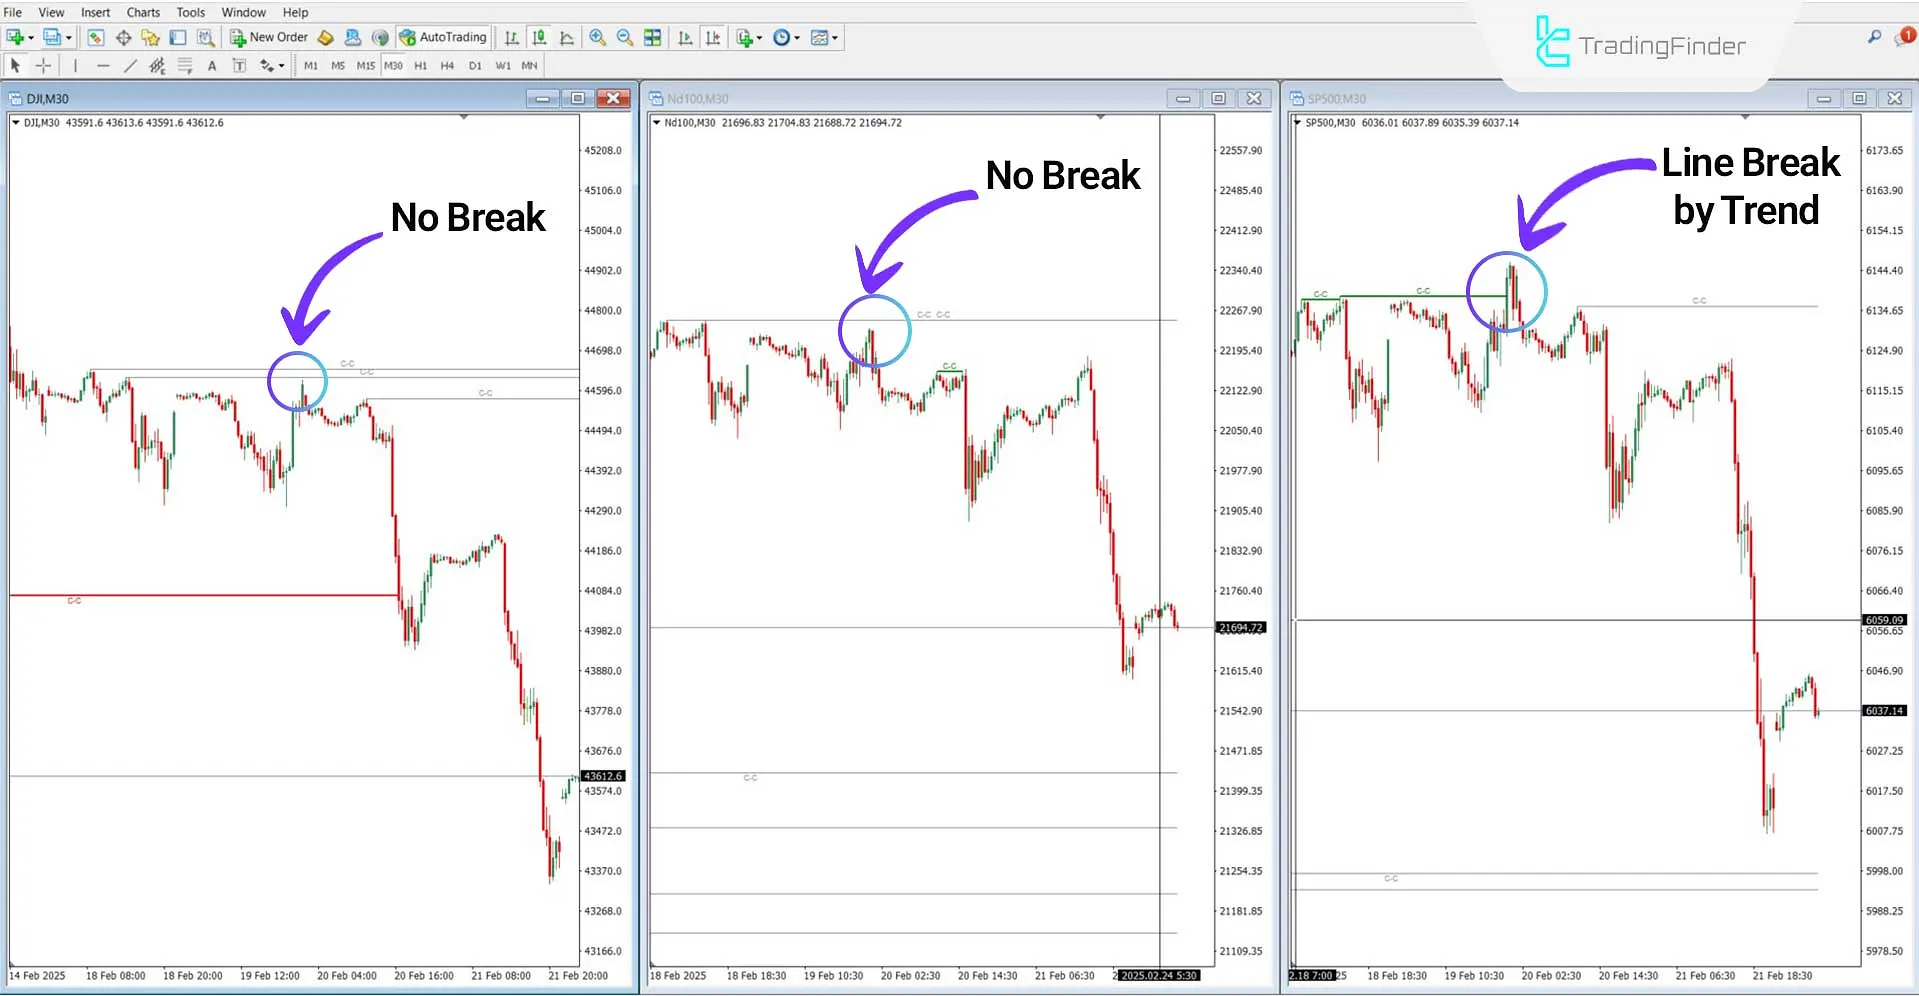
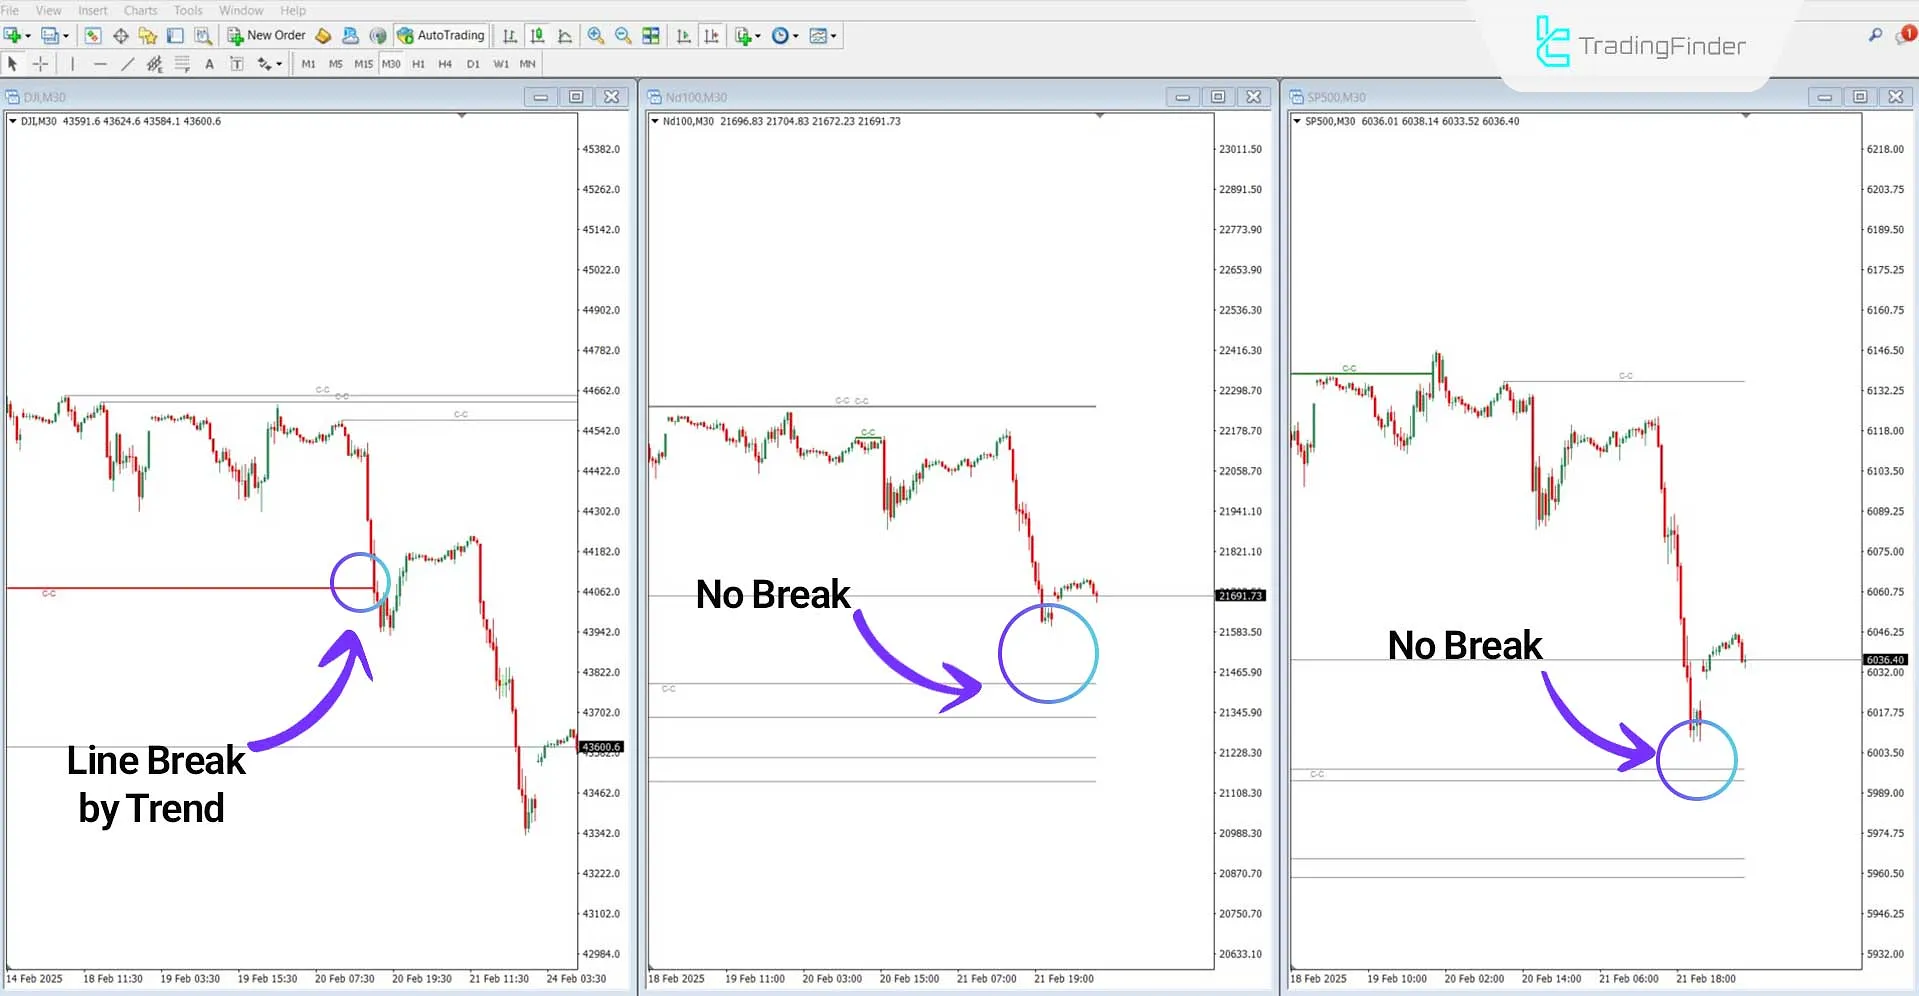
The Cracking Correlation Indicator visually tracks correlation breaks between three symbols using colored lines. When one symbol breaks a level while the others do not, the line changes color from gray to either red (bearish break) or green (bullish break), signaling a divergence.
Bullish Market Scenario
In a 30-minute chart of DJI, ND100, and SP500, the SP500 breaks above a price ceiling, while the other two symbols remain below it.
This reflects a correlation break, indicating that SP500 is leading the market in an uptrend.

Bearish Market Scenario
In the 30-minute charts of DJI, ND100, and SP500, the DJI breaks below a defined support level, while ND100 and SP500 fail to break the same level.
This identifies a correlation breakdown, highlighting the DJI as the outlier leading the downtrend.

Cracking Correlation Indicator Settings
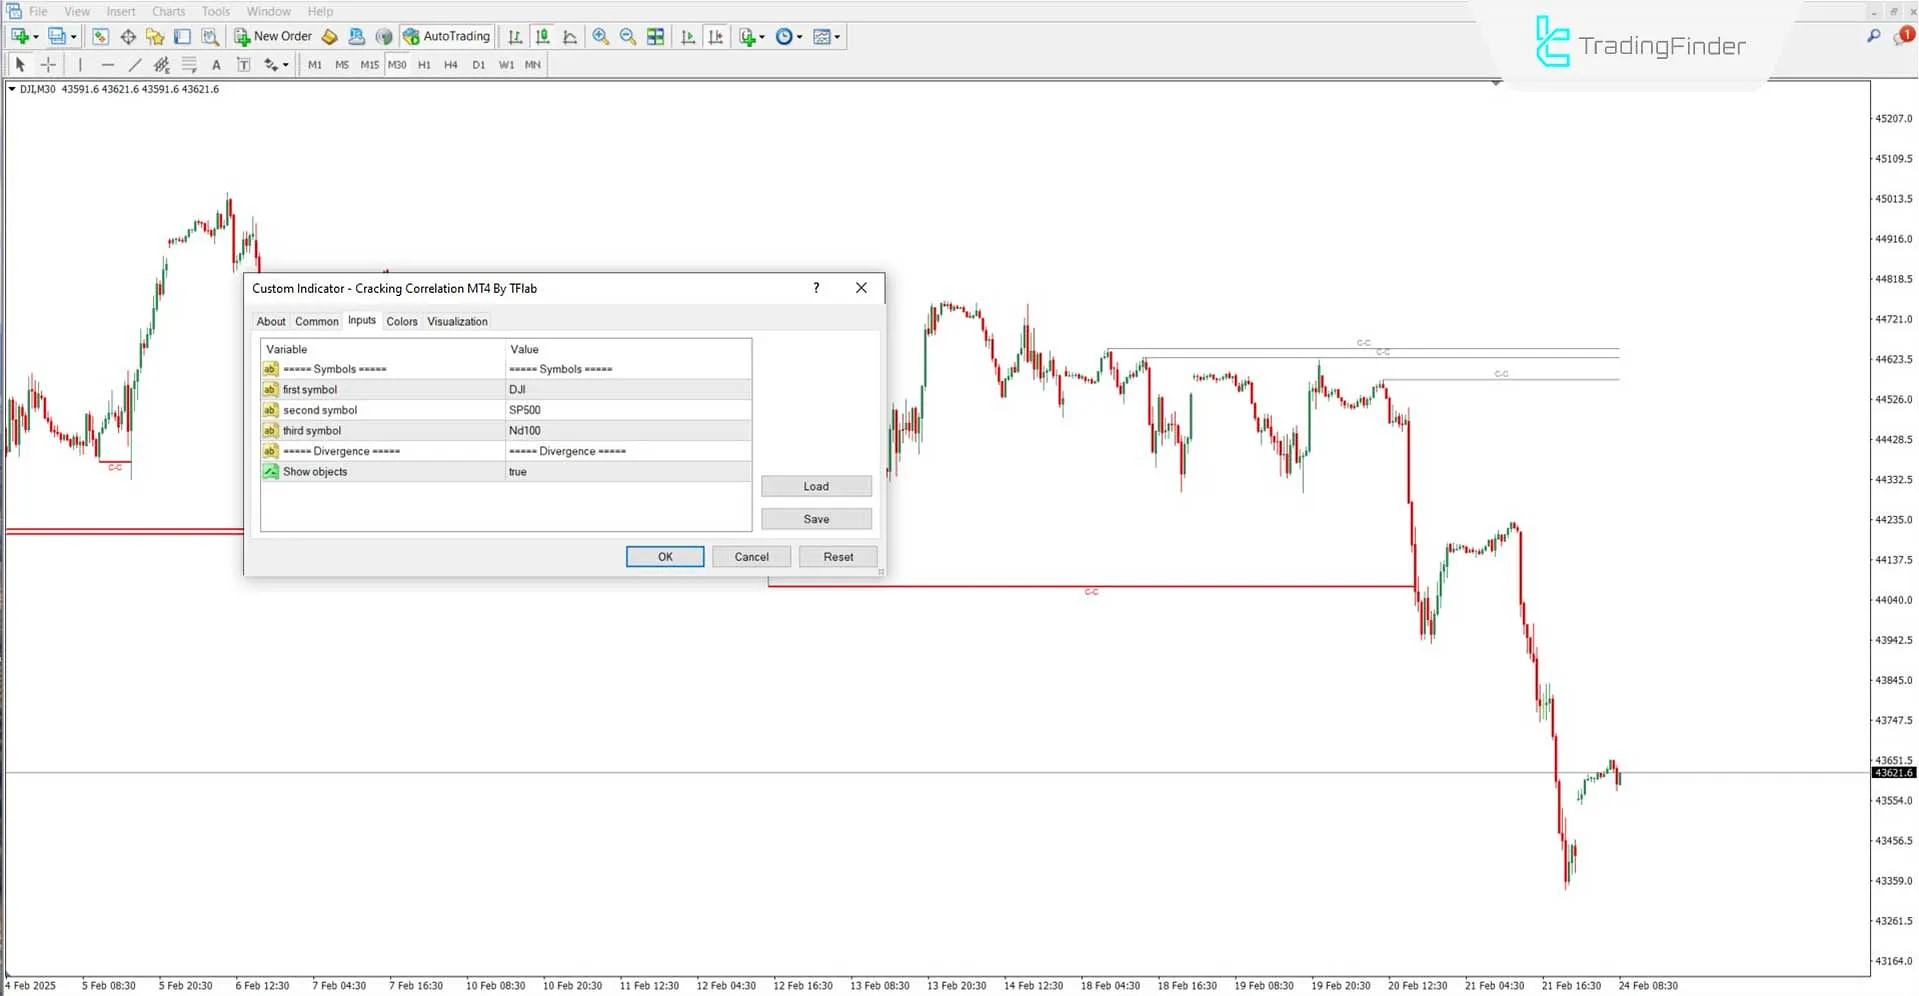
The following image showcases the settings panel for the Cracking Correlation Indicator:

- First symbol: Set the primary asset for analysis
- Second symbol: Choose the second asset
- Third symbol: Select the third asset
- Show objects: Enable or disable the display of chart elements
Conclusion
The Cracking Correlation indicator is based on the ICT strategy and is capable of displaying correlation breaks between three trading symbols
This liquidity indicator uses color changing lines to help identify correlation breakdowns between the selected symbols. It’s important to note that to activate the indicator, it must be applied to the First symbol.
Cracking Correlation ICT MT4 PDF
Cracking Correlation ICT MT4 PDF
Click to download Cracking Correlation ICT MT4 PDFDoes this indicator provide trade entry signals?
No, the Cracking Correlation Indicator does not generate trade entry signals.
Can this indicator be used in cryptocurrency markets?
No, it is designed specifically for stock market analysis.


