![Dynamic Zone RSI Indicator MetaTrader 4 - Free Download [TradingFinder]](https://cdn.tradingfinder.com/image/613000/2-163-en-dynamic-zone-rsi-mt4-1.webp)
![Dynamic Zone RSI Indicator MetaTrader 4 - Free Download [TradingFinder] 0](https://cdn.tradingfinder.com/image/613000/2-163-en-dynamic-zone-rsi-mt4-1.webp)
![Dynamic Zone RSI Indicator MetaTrader 4 - Free Download [TradingFinder] 1](https://cdn.tradingfinder.com/image/612998/2-163-en-dynamic-zone-rsi-mt4-2.webp)
![Dynamic Zone RSI Indicator MetaTrader 4 - Free Download [TradingFinder] 2](https://cdn.tradingfinder.com/image/613007/2-163-en-dynamic-zone-rsi-mt4-3.webp)
![Dynamic Zone RSI Indicator MetaTrader 4 - Free Download [TradingFinder] 3](https://cdn.tradingfinder.com/image/613009/2-163-en-dynamic-zone-rsi-mt4-4.webp)
The Dynamic Zone RSI Indicator, using the Relative Strength Index and dynamic bands, is a specialized tool for identifying overbought and oversold areas.
This indicator removes the fixed boundaries of RSI, monitors market conditions in real time, and defines entry and exit points within dynamic ranges.
Dynamic Zone RSI Indicator Table
The general specifications of the Dynamic Zone RSI Indicator are presented in the table below:
Indicator Categories: | Oscillators MT4 Indicators Trading Assist MT4 Indicators |
Platforms: | MetaTrader 4 Indicators |
Trading Skills: | Elementary |
Indicator Types: | Overbought and Oversold MT4 Indicators Reversal MT4 Indicators |
Timeframe: | Multi-Timeframe MT4 Indicators |
Trading Style: | Intraday MT4 Indicators |
Trading Instruments: | Share Stocks MT4 Indicators Indices Market MT4 Indicators Commodity Market MT4 Indicators Stock Market MT4 Indicators Cryptocurrency MT4 Indicators Forex MT4 Indicators |
Dynamic Zone RSI Indicator at a Glance
The operation of the indicator is based on the reaction of the RSI line to the dynamic bands, which act as support and resistance levels:
- Crossing of the RSI line above the upper band indicates an overbought condition and the probability of a downward reversal or correction;
- A drop of the RSI line below the lower band indicates an oversold condition and the probability of an upward move.
This mechanism adapts to market fluctuations and prevents false signals.
Indicator in Uptrend
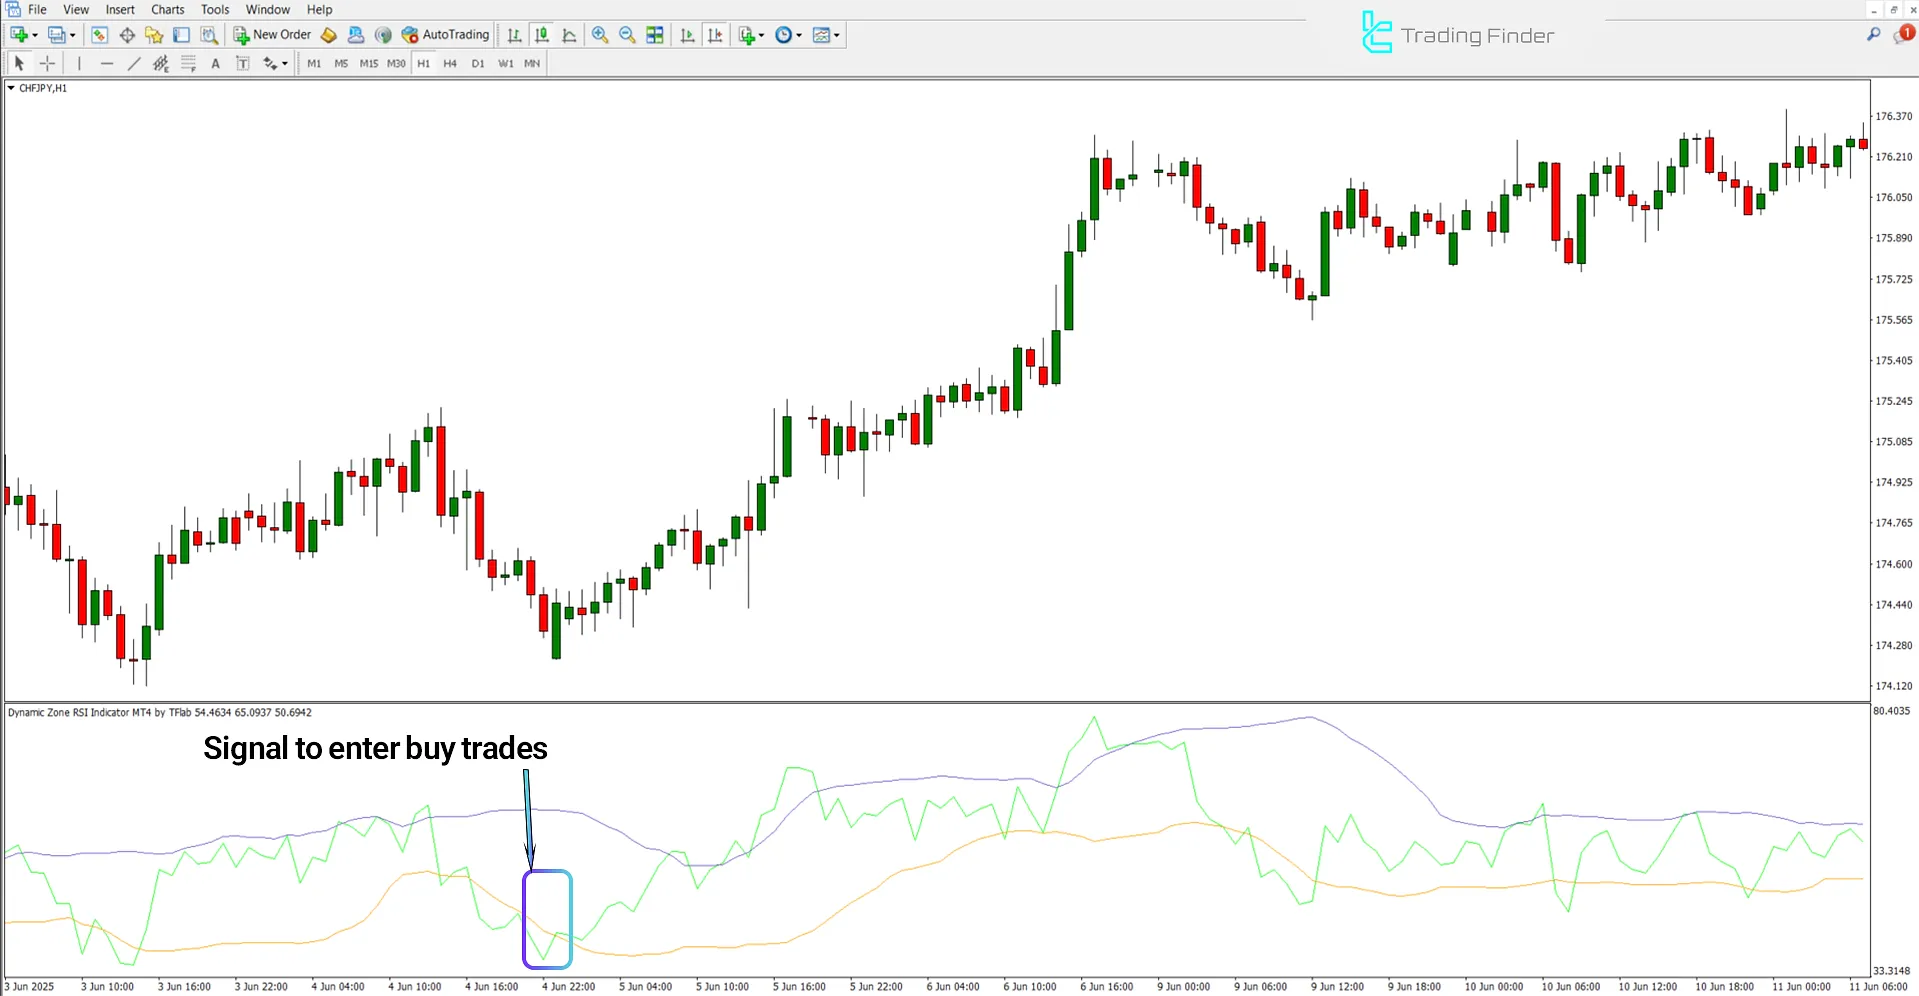
In a bullish condition, when the RSI line moves upward from the oversold area and crosses the lower band, a buy entry signal is generated.
Stabilization of the RSI line above the mid-level of the dynamic range confirms the strength of the uptrend.
In this situation, a positive divergence between price and the RSI indicator can provide a more reliable entry point.

Indicator in Downtrend
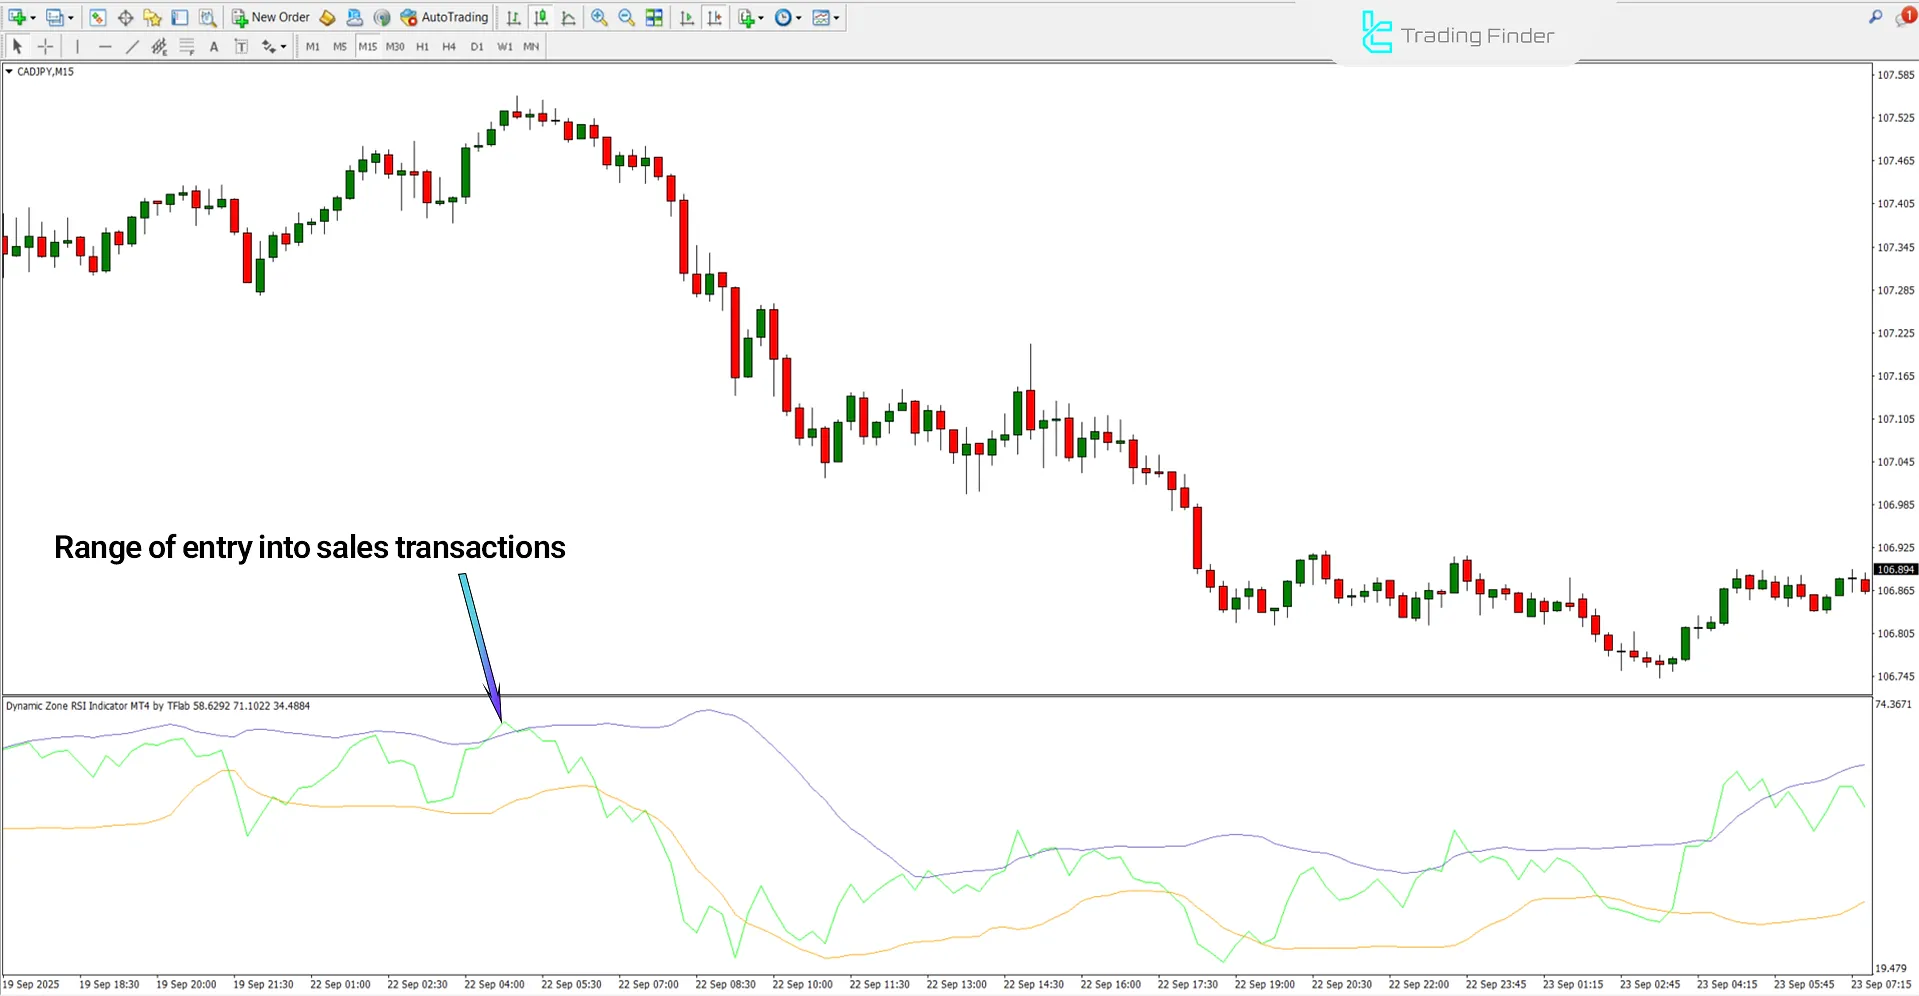
In a bearish condition, when the RSI line moves downward from the overbought area and cuts the upper band to the downside, a sell signal is generated.
Stabilization of the RSI line below the mid-level of the dynamic range indicates sellers’ dominance and the continuation of the bearish trend.
Additionally, a negative divergence between price and the RSI strengthens the probability of a market reversal.

Dynamic Zone RSI Indicator Settings
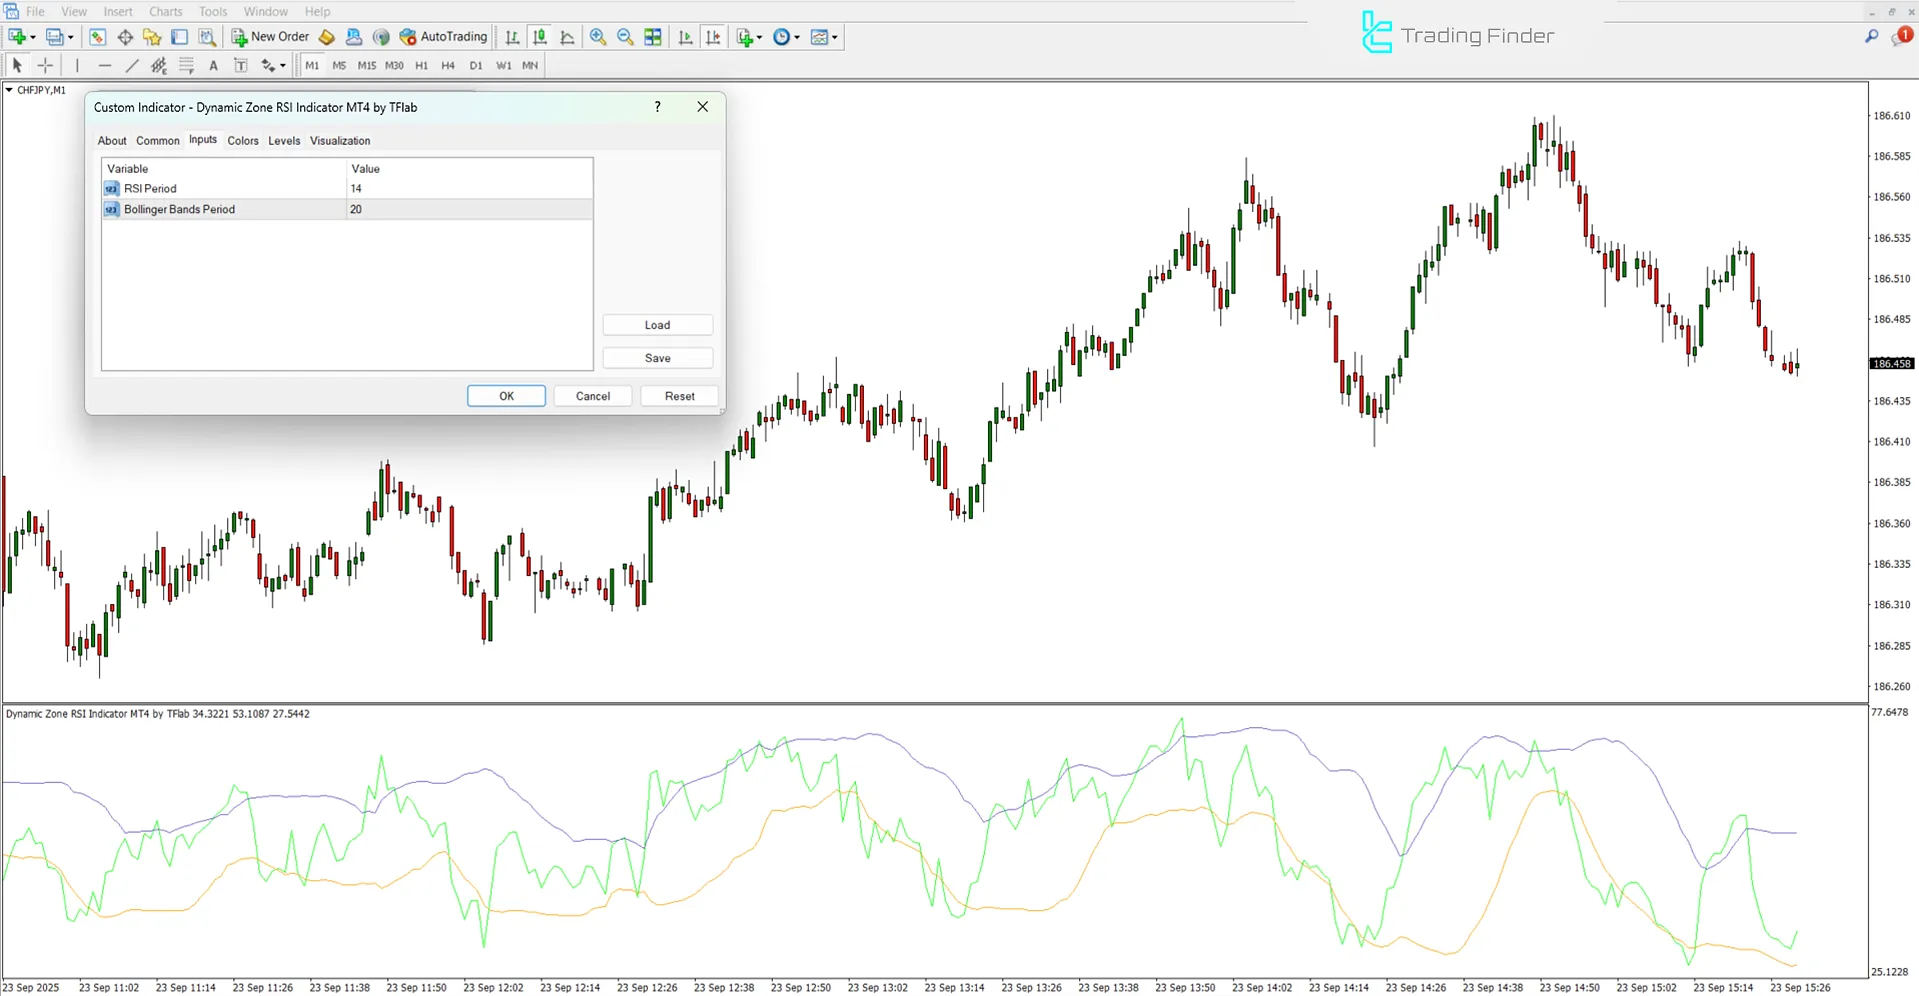
The image below shows the settings panel of the Dynamic Zone RSI Indicator:

- RSI Period: Display period of the Relative Strength Index
- Bollinger Bands Period: Timeframe of Bollinger Bands
Conclusion
The Dynamic Zone RSI Indicator, by combining the traditional structure of RSI with dynamic bands, provides an advanced tool for identifying key market areas.
This trading tool, by adapting to fluctuations, reduces false signals and presents more accurate entry and exit points.
Dynamic Zone RSI Indicator MetaTrader 4 PDF
Dynamic Zone RSI Indicator MetaTrader 4 PDF
Click to download Dynamic Zone RSI Indicator MetaTrader 4 PDFWhat is the main application of the Dynamic Zone RSI Indicator?
This indicator is used to accurately identify overbought and oversold areas and to determine more reliable trading opportunities.
Is the Dynamic Zone RSI Indicator applicable for short-term strategies?
Yes; due to its quick reaction to price changes, this trading tool is highly accurate in short-term trading and scalping.


