![First RSI Level Indicator for MetaTrader 4 Download - Free - [TFlab]](https://cdn.tradingfinder.com/image/287861/11-68-en-first-rsi-level-mt4-01.webp)
![First RSI Level Indicator for MetaTrader 4 Download - Free - [TFlab] 0](https://cdn.tradingfinder.com/image/287861/11-68-en-first-rsi-level-mt4-01.webp)
![First RSI Level Indicator for MetaTrader 4 Download - Free - [TFlab] 1](https://cdn.tradingfinder.com/image/287865/11-68-en-first-rsi-level-mt4-02.webp)
![First RSI Level Indicator for MetaTrader 4 Download - Free - [TFlab] 2](https://cdn.tradingfinder.com/image/287860/11-68-en-first-rsi-level-mt4-03.webp)
![First RSI Level Indicator for MetaTrader 4 Download - Free - [TFlab] 3](https://cdn.tradingfinder.com/image/287866/11-68-en-first-rsi-level-mt4-04.webp)
The First RSI Level Indicator is one of the signal and forecasting indicators for MetaTrader 4, designed based on the RSI indicator. This indicator displays buy signals in blue and sell signals in red.
Additionally, the First RSI Level is an advanced version of the RSI indicator, which not only generates trading signals but also identifies support and resistance levels.
First RSI Level Indicator Table
The table below outlines the general specifications of the First RSI Level Indicator.
Indicator Categories: | Support & Resistance MT4 Indicators Signal & Forecast MT4 Indicators Currency Strength MT4 Indicators Trading Assist MT4 Indicators RSI Indicators for MetaTrader 4 |
Platforms: | MetaTrader 4 Indicators |
Trading Skills: | Intermediate |
Indicator Types: | Lagging MT4 Indicators Reversal MT4 Indicators |
Timeframe: | Multi-Timeframe MT4 Indicators |
Trading Style: | Day Trading MT4 Indicators Intraday MT4 Indicators Scalper MT4 Indicators |
Trading Instruments: | Indices Market MT4 Indicators Stock Market MT4 Indicators Forex MT4 Indicators |
Buy Signal from the Indicator
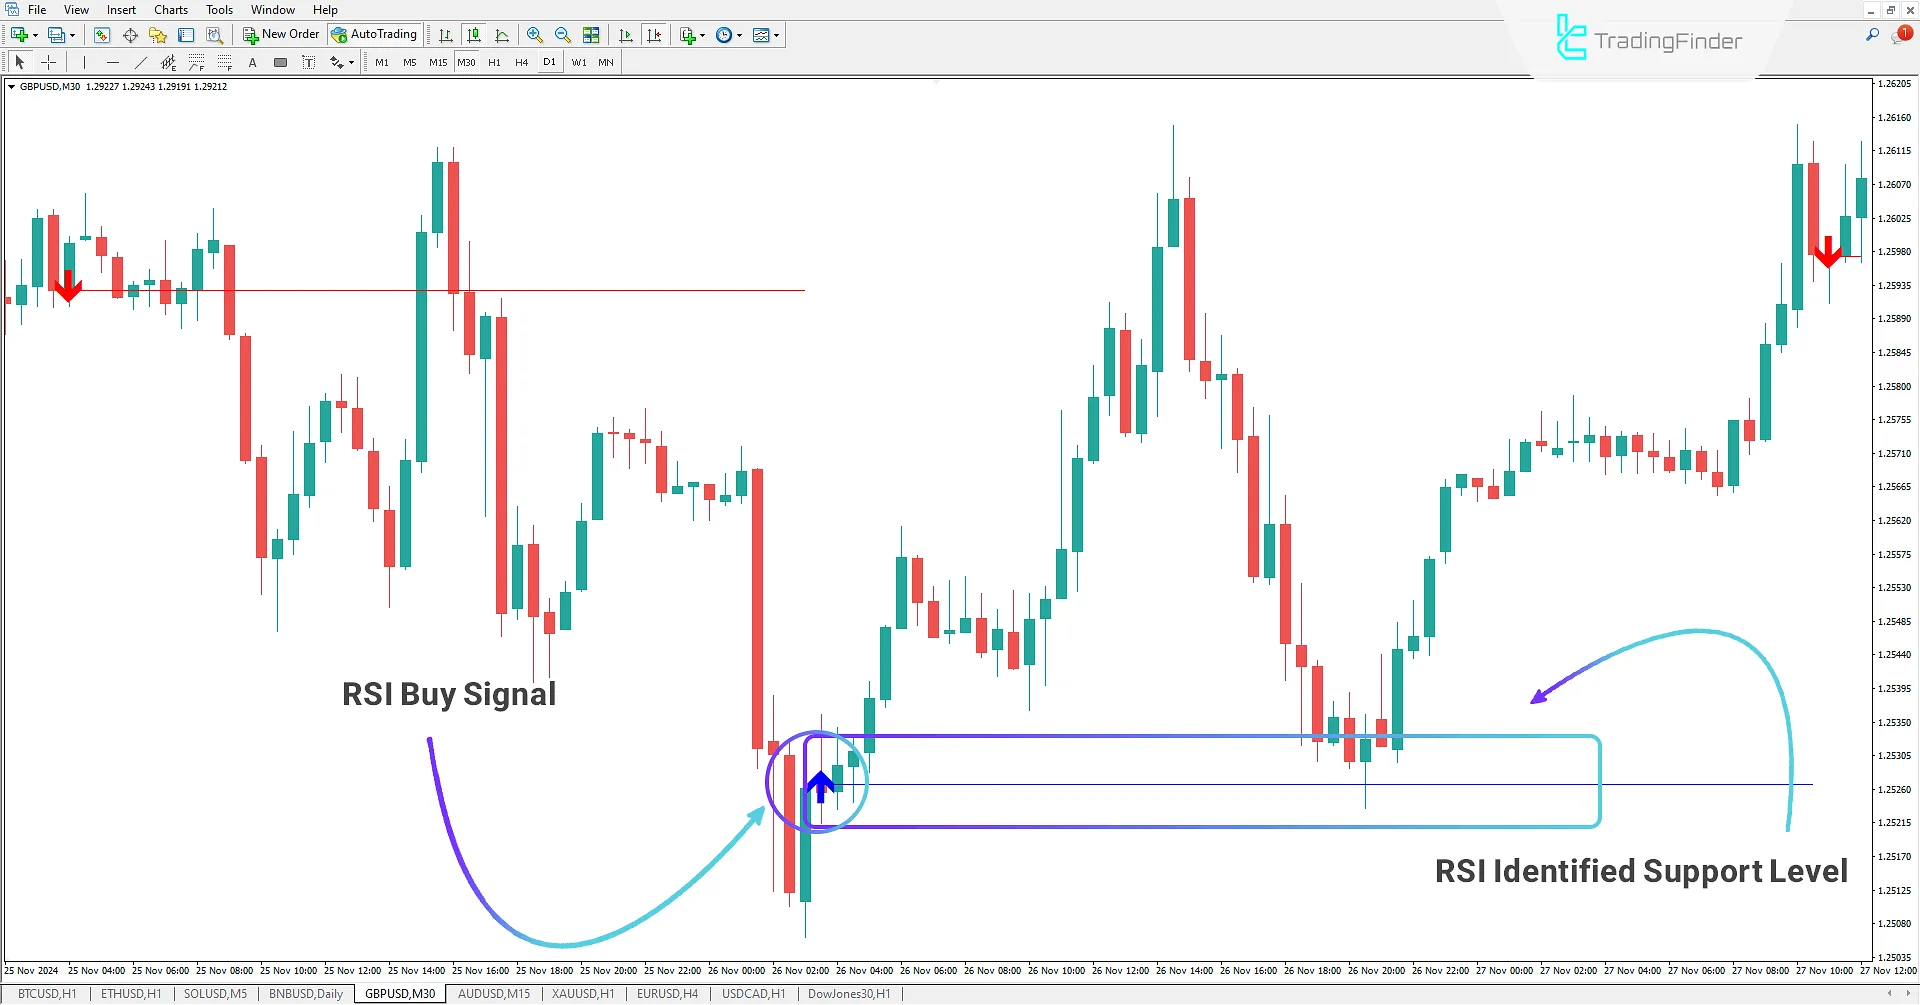
In the 30-minute GBP/USD chart, the First RSI Level Indicator has issued a buy signal. Traders can use this signal to enter a buy position.
Additionally, the drawn support level can serve as a re-entry point or a support level for the price, enabling traders to conduct more specialized analysis.

Sell Signal from the Indicator
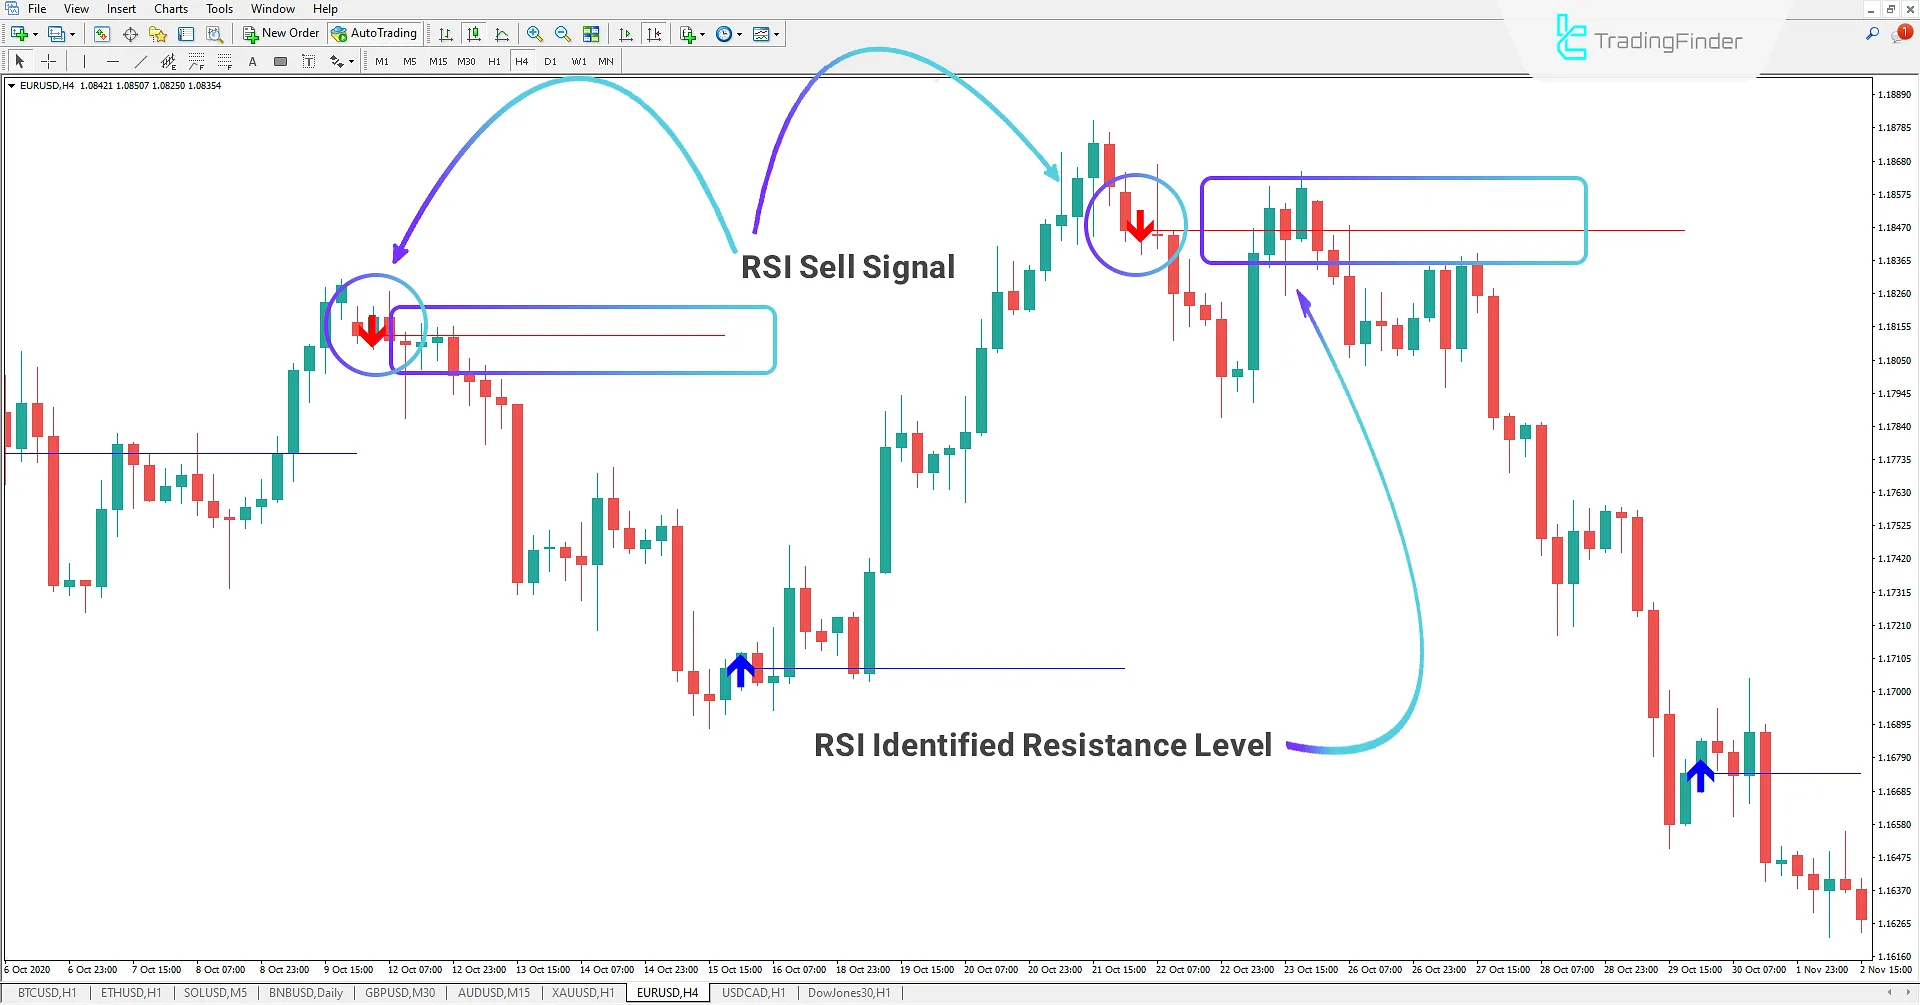
In the 1-hour EUR/USD chart, the First RSI Level Indicator has issued two sell signals. Traders can use these signals to enter a sell position or utilize the drawn resistance level.
After the downward trend begins, the price retests the resistance level and starts to decline again, highlighting the importance of these levels in Trading tools.

First RSI Level Indicator Settings
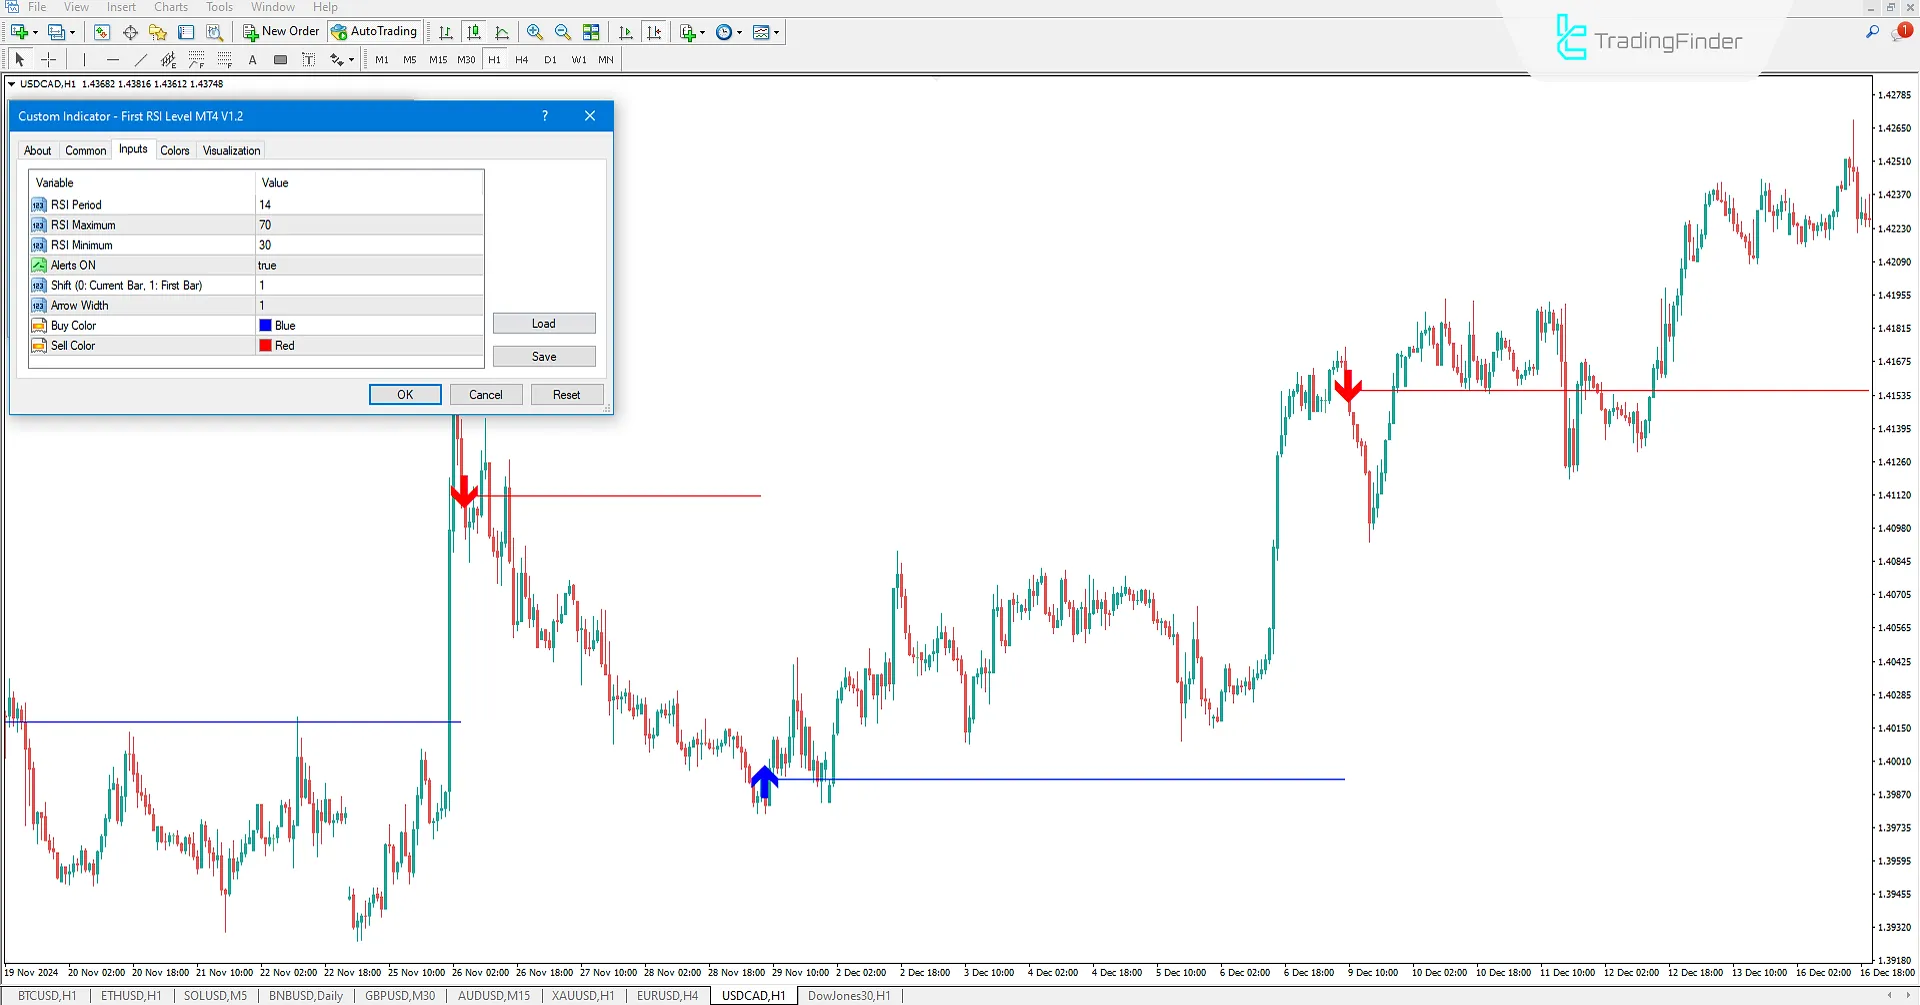
The settings for the First RSI Level Indicator are as follows:

- RSI Period: Set the period for the RSI indicator
- RSI Maximum: Set the overbought level for the RSI
- RSI Minimum: Set the oversold level for the RSI
- Alerts ON: Enable or disable alerts when signals are generate
- Shift (0: Current Bar, 1: First Bar): Set calculation based on the current candle (0) or the closing candle (1)
- Arrow Width: Set the size of the signal arrows (1-5)
- Buy Color: Set the color for buy signals
- Sell Color: Set the color for sell signals
Coclusion
The First RSI Level Indicator is one of the support and resistance indicators in MetaTrader 4. It uses the RSI indicator to perform calculations and generates buy and sell signals.
Additionally, it draws support and resistance levels, highlighting key areas for traders. By sending alerts when signals are generated, it helps traders identify trading opportunities.
First RSI Level MT4 PDF
First RSI Level MT4 PDF
Click to download First RSI Level MT4 PDFWhat is the First RSI Level Indicator?
The First RSI Level Indicator is a signal and forecasting indicator for MetaTrader 4, based on the RSI indicator. It displays buy signals in blue and sell signals in red.
What is the difference between the First RSI Level Indicator and the standard RSI?
The First RSI Level Indicator is an advanced version of the RSI indicator. In addition to generating trading signals, it also identifies support and resistance levels.


