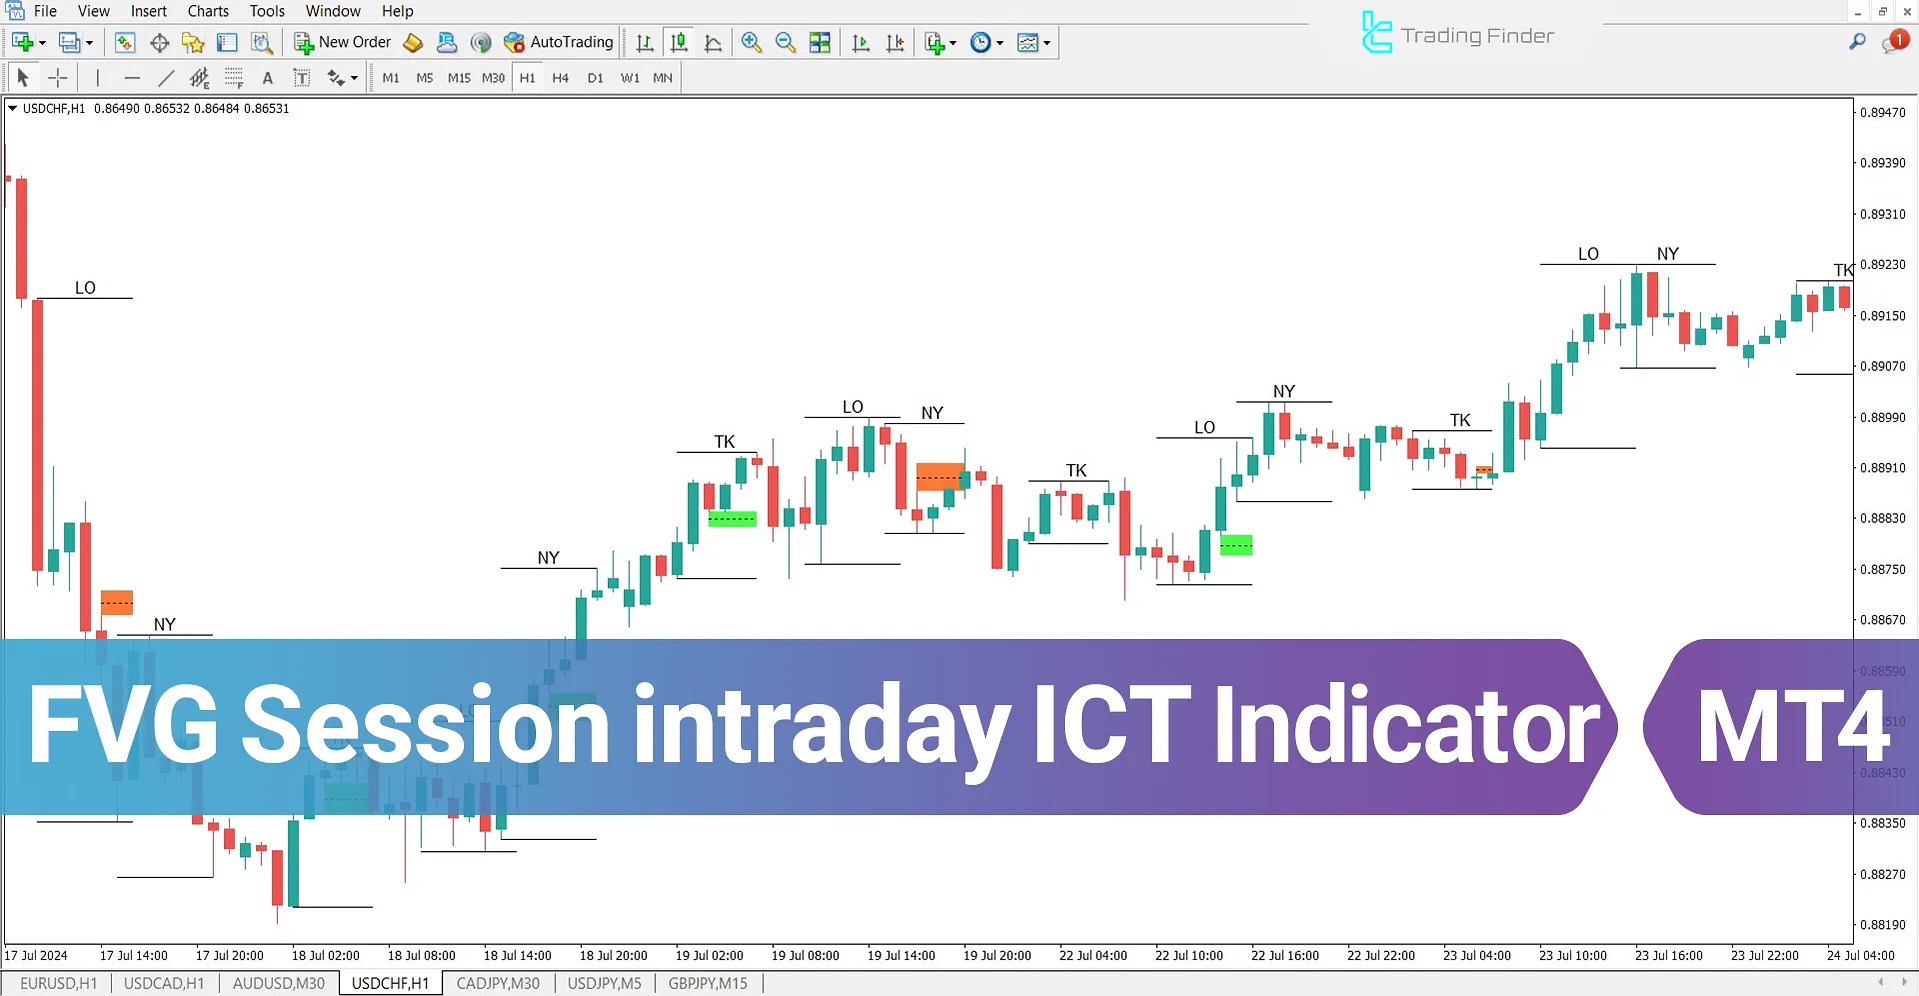


The FVG Session Intraday Indicator is a hybrid tool combining trading sessions and Fair Value Gaps (FVGs) among MetaTrader 4 indicators. This indicator displays the highs and lows formed during the New York, London, and Tokyo trading sessions using a horizontal line.
Additionally, it identifies the firstFair Value Gap (FVG) at the opening and closing times of these sessions. Bullish FVGs are displayed in green, while bearish FVGs appear in red, providing traders with a clear visualization of market imbalances.
Indicator Table
The table below presents the specifications of the FVG Session Intraday Indicator:
Indicator Categories: | ICT MT4 Indicators Liquidity MT4 Indicators Session & KillZone MT4 Indicators |
Platforms: | MetaTrader 4 Indicators |
Trading Skills: | Intermediate |
Indicator Types: | Reversal MT4 Indicators |
Timeframe: | Multi-Timeframe MT4 Indicators |
Trading Style: | Intraday MT4 Indicators |
Trading Instruments: | Share Stocks MT4 Indicators Forward Market MT4 Indicators Commodity Market MT4 Indicators Stock Market MT4 Indicators Cryptocurrency MT4 Indicators Forex MT4 Indicators |
Overview of the Indicator
The FVG Session Intraday Indicator, as one of the key tools in the ICT trading style, plays a crucial role in identifying and analyzing Fair Value Gap (FVG) zones.
This indicator automatically plots FVG areas, and if these zones are broken by price in the opposite direction, it fades them out, signaling to traders that these levels have lost their significance.
Indicator in Uptrend
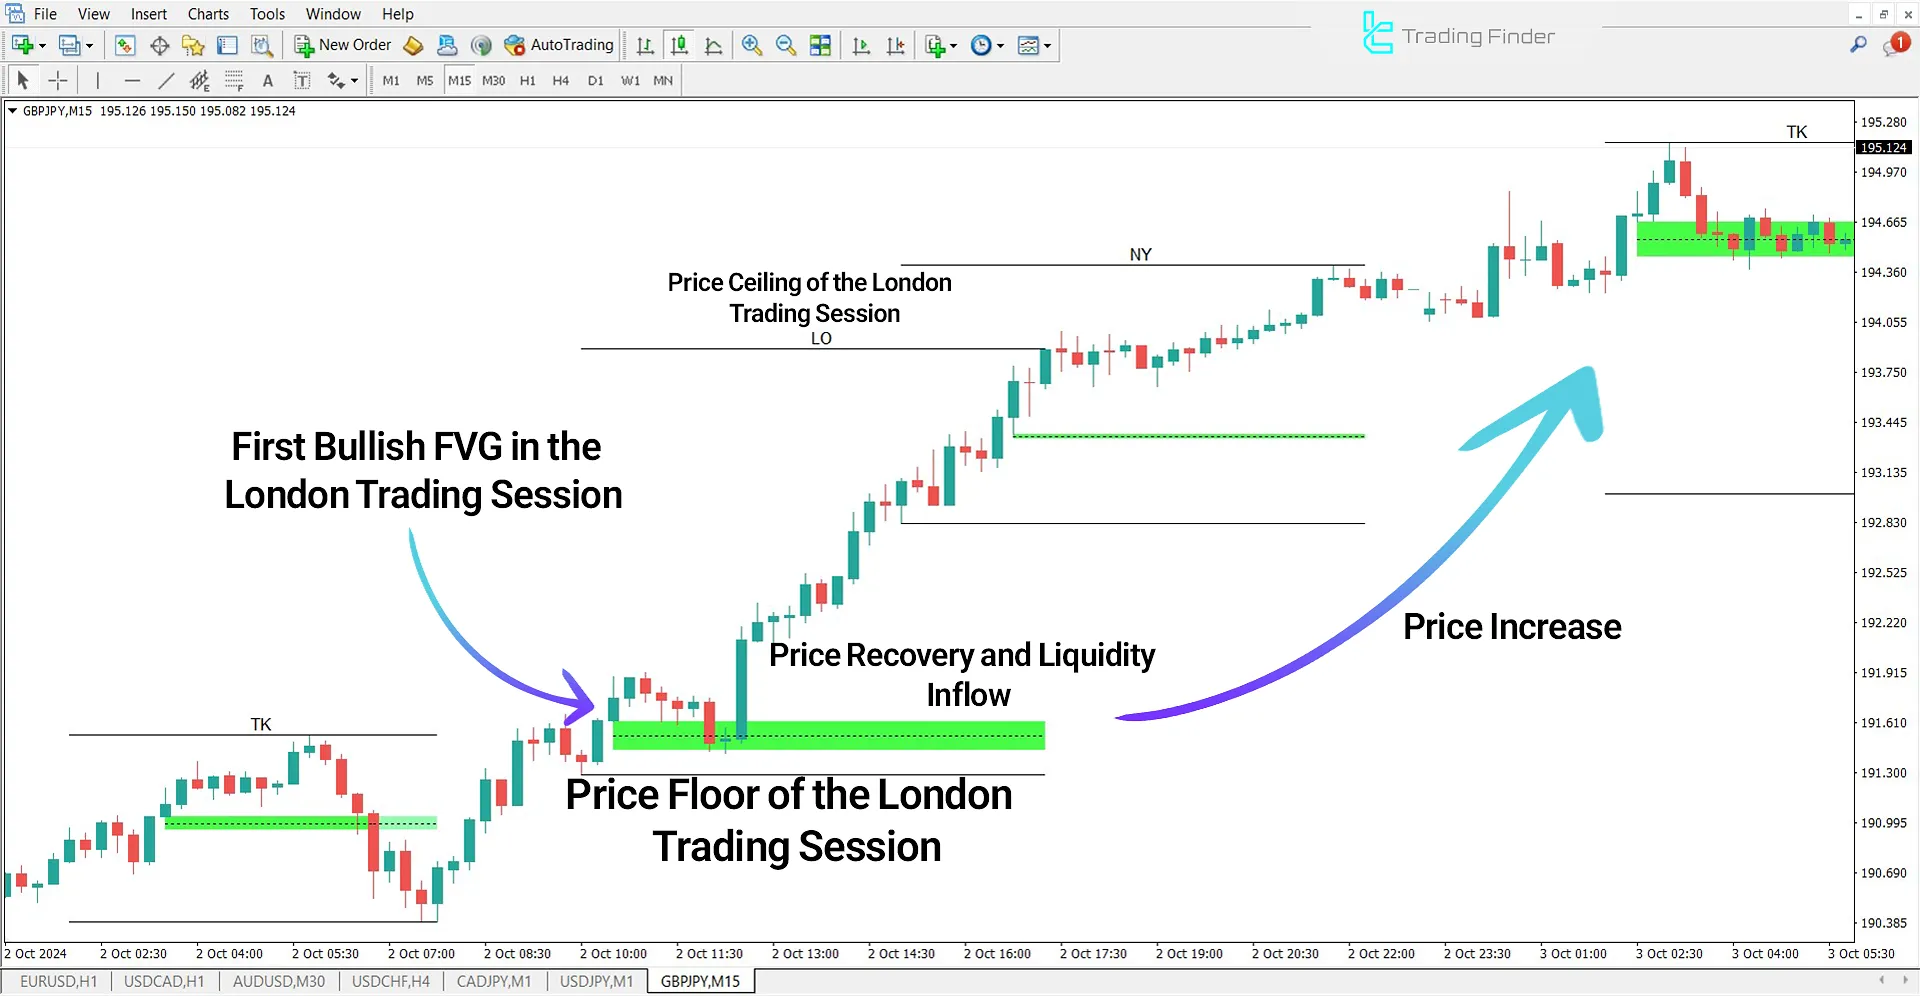
In the image below, the price chart of the GBP/JPY currency pair in a 15-minute timeframe is displayed. The indicator has identified a bullish Fair Value Gap (FVG) zone during the London trading session, and the price has retraced to this area to absorb liquidity.
After liquidity is collected, traders enter buy (Buy) positions, placing their stop losses ahead of these zones to manage risk effectively.

Indicator in Downtrend
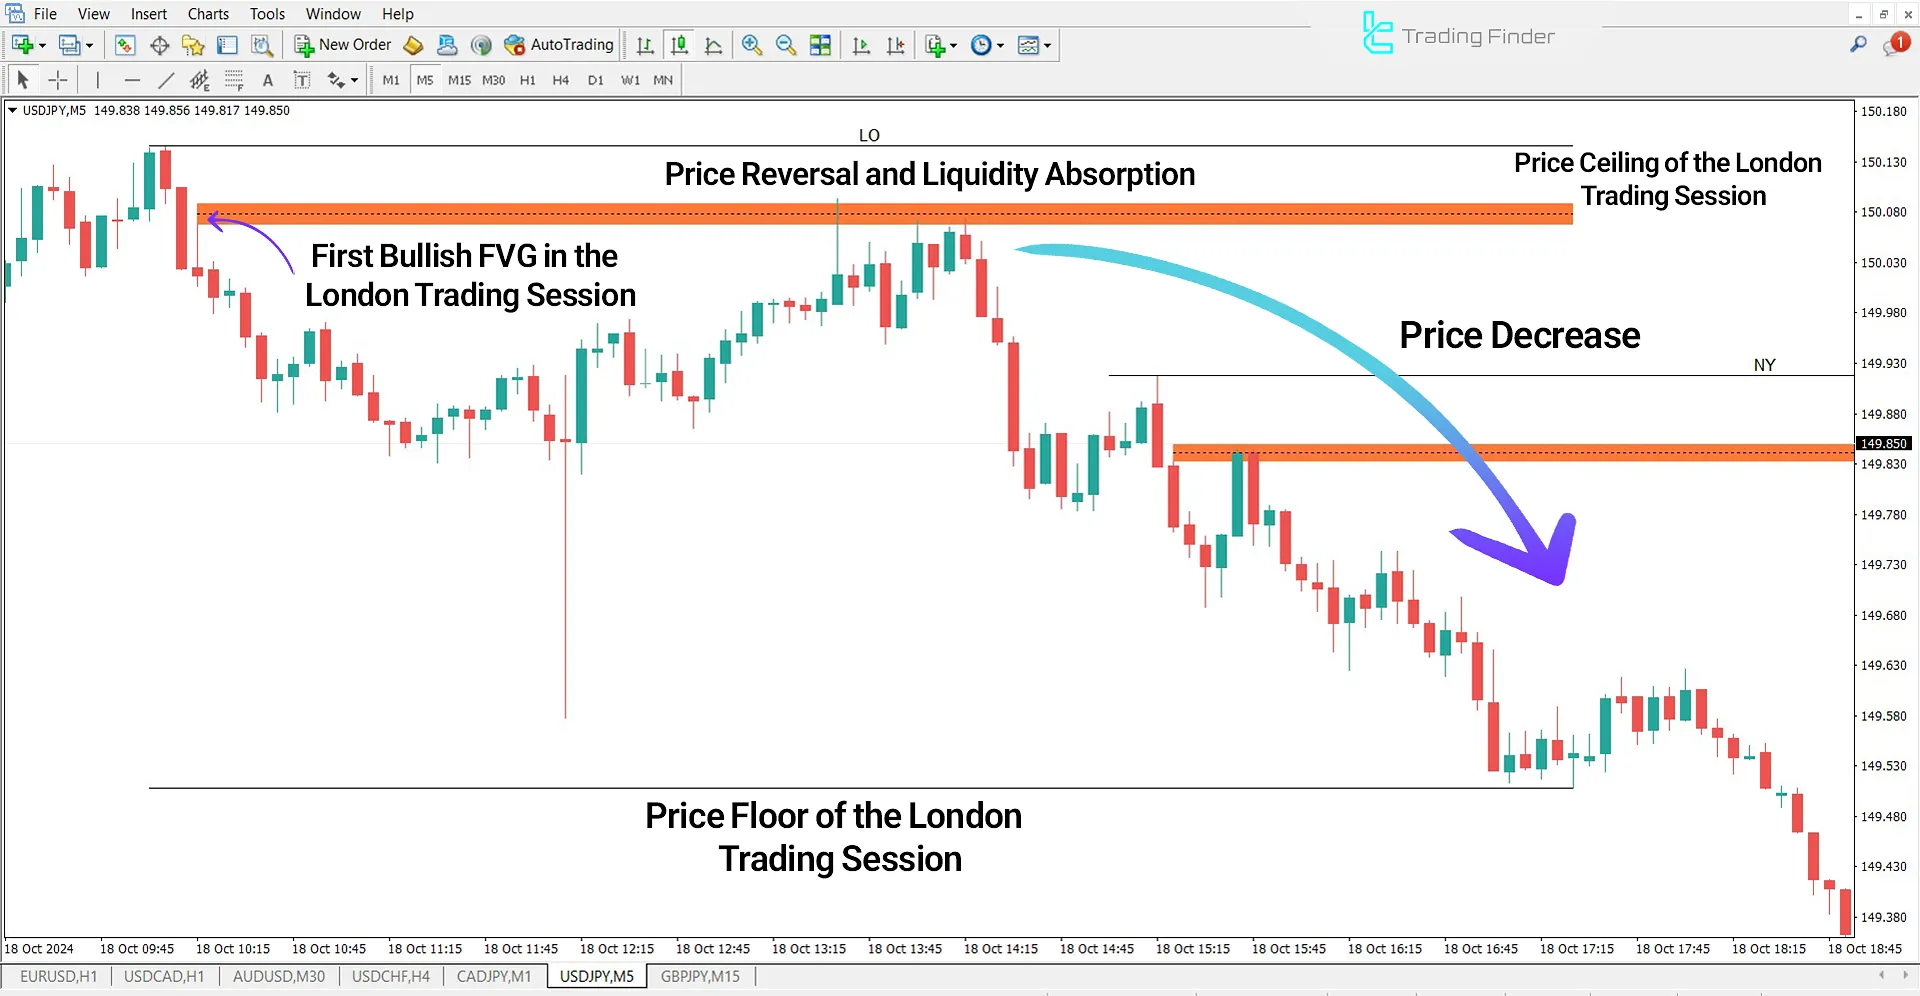
The price chart of the USD/JPY currency pair in a 5-minute timeframe is displayed. After forming a bearish Fair Value Gap (FVG), the price retraces to this zone to trigger orders and absorb liquidity. After testing this area, the price continues its downward trend, confirming the strength of the bearish momentum.

Indicator Settings
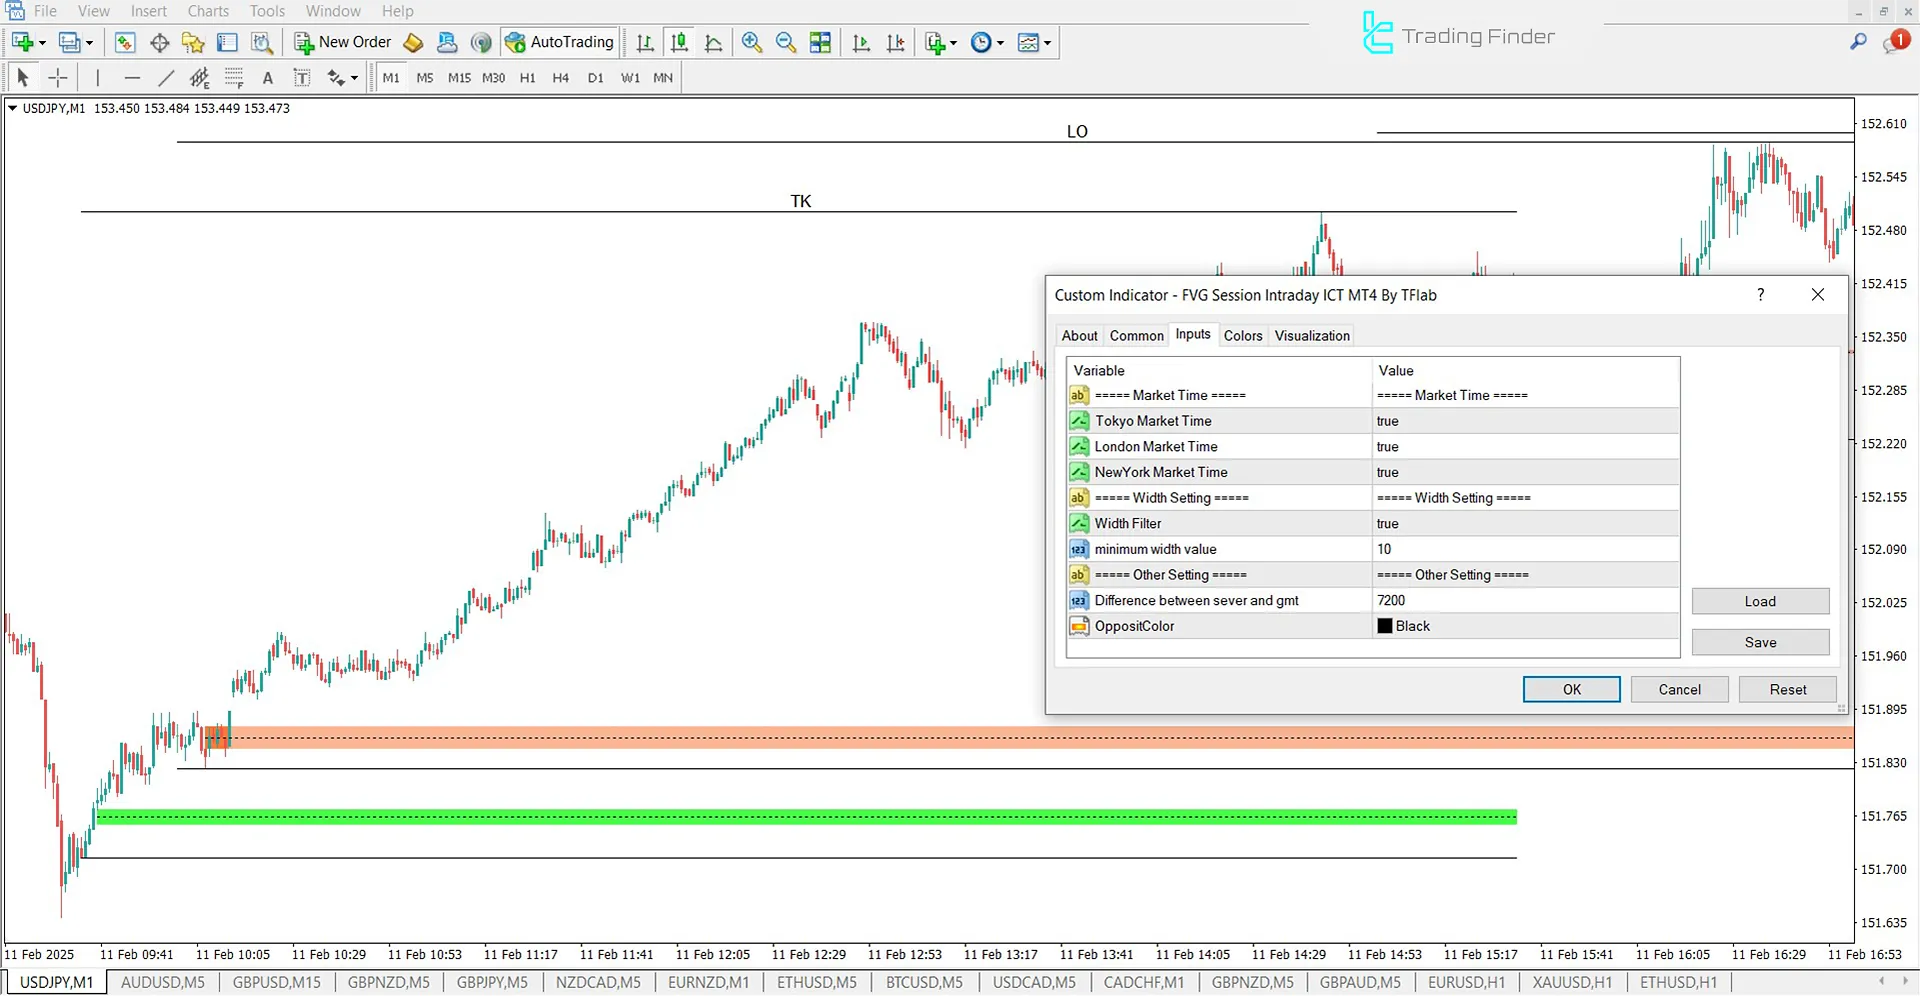
The image below displays the settings section of the FVG Session Intraday Indicator:

- Tokyo market time: Tokyo market time
- London market time: London market time
- New York market time: New York market time
- Width filter: Range width
- Minimum width value: Minimum width value for zone calculation
- Difference between server and GMT: The default time difference relative to GMT
Conclusion
The Fair Value Gap (FVG) Sessions Indicator is an efficient technical analysis tool that assists traders in identifying and analyzing key price zones. This indicator highlights entry and exit points in volatile markets by displaying Fair Value Gaps (FVGs) during the New York, London, and Tokyo trading sessions.
Additionally, the indicator fades out FVG zones once they are broken, allowing traders to evaluate the validity of these levels and adjust their strategies accordingly.
Fair Value Gap intraday MT4 PDF
Fair Value Gap intraday MT4 PDF
Click to download Fair Value Gap intraday MT4 PDFWhich sessions are analyzed by this indicator?
The indicator analyzes the New York, London, and Tokyo trading sessions, identifying price gaps associated with these sessions.
Is specific training required to use this indicator?
While this indicator is relatively simple, familiarity with technical analysis and ICT concepts can enhance trading performance.


